## Forex and Global News
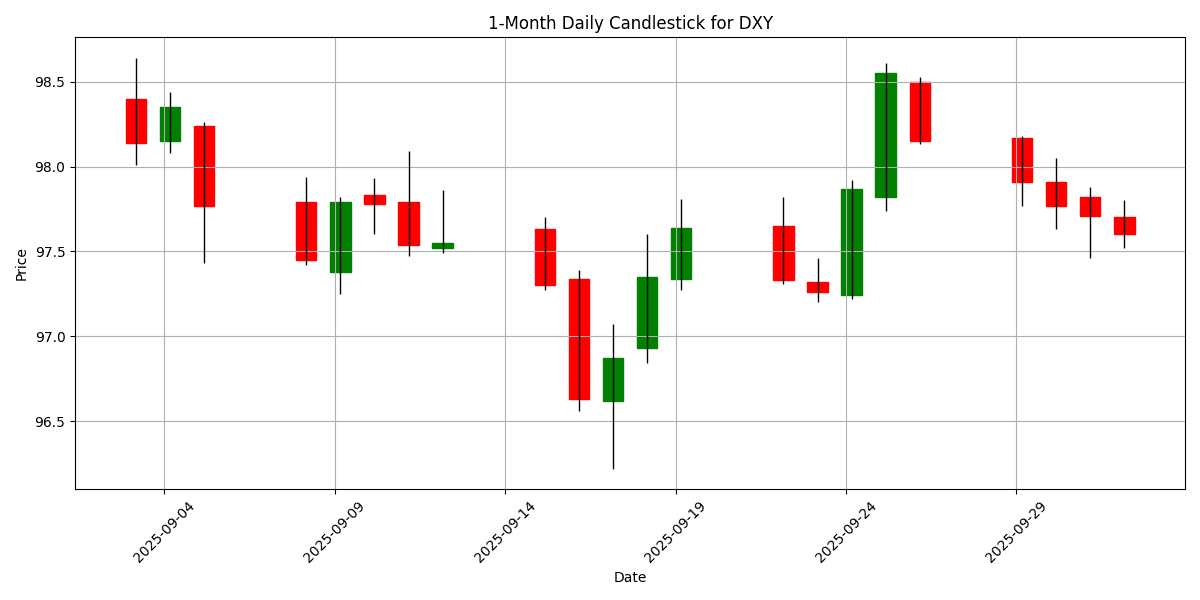
In today’s forex market, the US Dollar (USD) faced downward pressure, driven by disappointing labor data and a general sentiment of weakness against major currencies. USD/JPY fell below the 147.00 mark, hitting session lows at 146.75, while USD/CHF retreated to 0.7950 despite soft Swiss inflation data. The GBP/USD maintained a bullish stance near 1.3500, reflecting a positive outlook amid ongoing political developments in the US. The Euro (EUR) traded modestly higher at around 1.1750 but faces resistance at 1.1770, which could hinder further gains. In commodities, gold prices saw a slight retreat after peaking at $3,895, marking the first decline in six days. Geopolitical tensions persist, particularly with Russia’s economy under strain due to ongoing commitments in Ukraine. Overall, the market sentiment reflects caution, with investors closely monitoring economic indicators and geopolitical developments. The DXY is currently at 97.60, down by 0.1167%.
## Economic Calendar Events Today
All times are in US Eastern Time (New York).
| Date | Time | Cur | Imp | Event | Actual | Forecast |
|---|---|---|---|---|---|---|
| 2025-10-02 | 02:30 | 🇨🇭 | Medium | CPI (MoM) (Sep) | -0.2% | -0.2% |
| 2025-10-02 | 03:00 | 🇪🇺 | Medium | Spanish Unemployment Change (Sep) | -4.8K | 15.4K |
| 2025-10-02 | 04:00 | 🇧🇷 | Medium | IPC-Fipe Inflation Index (MoM) (Sep) | 0.65% | |
| 2025-10-02 | 05:00 | 🇪🇺 | Medium | Unemployment Rate (Aug) | 6.3% | 6.2% |
| 2025-10-02 | 10:00 | 🇺🇸 | Medium | Factory Orders (MoM) (Aug) | 1.4% | |
| 2025-10-02 | 12:00 | 🇷🇺 | Medium | GDP Monthly (YoY) (Aug) | ||
| 2025-10-02 | 13:00 | 🇪🇺 | Medium | ECB’s De Guindos Speaks | ||
| 2025-10-02 | 16:30 | 🇺🇸 | Medium | Fed’s Balance Sheet | ||
| 2025-10-02 | 20:30 | 🇯🇵 | Medium | au Jibun Bank Services PMI (Sep) | 53.0 |
On October 2, 2025, several key economic events are poised to influence FX markets, particularly affecting the EUR, CHF, and USD.
Starting with the Swiss franc (CHF), the Consumer Price Index (CPI) for September came in at -0.2%, aligning with forecasts. This stagnation in inflation may limit the Swiss National Bank’s monetary policy options, potentially weakening the CHF against stronger currencies.
In the Eurozone, Spain reported a surprising drop in unemployment, with a change of -4.8K, significantly better than the anticipated 15.4K increase. This positive labor market data could bolster the euro (EUR), particularly if it signals broader economic resilience within the region. However, the overall Eurozone unemployment rate for August was slightly higher than expected at 6.3%, which may temper bullish sentiment.
For the US dollar (USD), the upcoming Factory Orders data is closely watched, with a forecast of 1.4% growth. Any deviation from this expectation could lead to volatility in USD pairs. Additionally, the Federal Reserve’s balance sheet figures will be scrutinized for insights into monetary policy direction.
The Japanese yen (JPY) will be affected by the au Jibun Bank Services PMI, with a forecast of 53.0, indicating potential growth in the services sector. Overall, these events will shape market sentiment, with particular focus on the EUR and USD.
## Major FX Group
| Name | Symbol | Price | Daily (%) | 5D (%) | 1W (%) | 1M (%) | 3M (%) | 6M (%) | YTD (%) | 12M (%) | MA50 | MA100 | MA200 | RSI | MACD |
|---|---|---|---|---|---|---|---|---|---|---|---|---|---|---|---|
| EUR/USD – Euro / U.S. Dollar | EURUSD | 1.1755 | 0.1448 | 0.7909 | 0.0879 | 0.3336 | -0.1401 | 6.4404 | 12.96 | 6.2464 | 1.1684 | 1.1594 | 1.1149 | 49.00 | 0.0022 |
| USD/JPY – U.S. Dollar / Japanese Yen | USDJPY | 146.71 | -0.2020 | -2.1046 | -1.3741 | -0.2563 | 1.3996 | 0.3255 | -6.5531 | 2.0670 | 147.67 | 146.40 | 148.57 | 46.52 | 0.1553 |
| GBP/USD – British Pound / U.S. Dollar | GBPUSD | 1.3473 | -0.0593 | 1.0232 | 0.1532 | -0.5531 | -1.4288 | 2.9364 | 7.3623 | 1.4988 | 1.3472 | 1.3491 | 1.3121 | 44.86 | -0.0007 |
| USD/CHF – U.S. Dollar / Swiss Franc | USDCHF | 0.7957 | -0.1506 | -0.5425 | 0.1309 | -0.5561 | 0.2015 | -7.3917 | -11.9060 | -5.9834 | 0.8011 | 0.8074 | 0.8444 | 52.98 | -0.0021 |
| AUD/USD – Australian Dollar / U.S. Dollar | AUDUSD | 0.6608 | -0.1058 | 1.0813 | 0.3200 | 0.7809 | 0.4668 | 4.4989 | 6.2379 | -3.9534 | 0.6543 | 0.6520 | 0.6402 | 51.24 | 0.0016 |
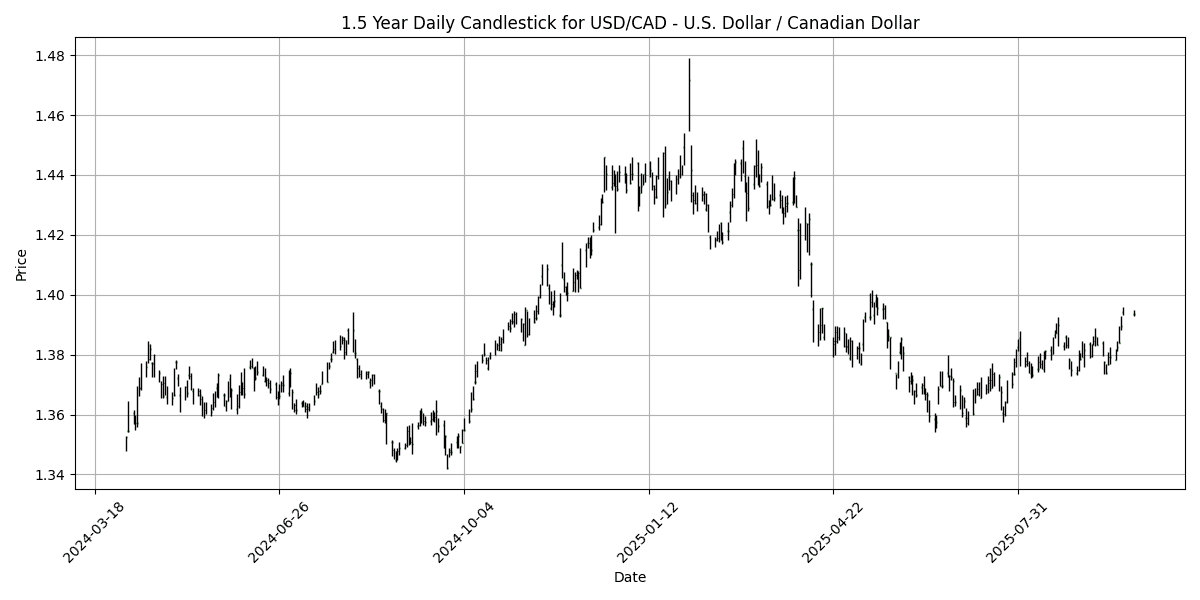
| USD/CAD – U.S. Dollar / Canadian Dollar | USDCAD | 1.3937 | 0.0072 | -0.0287 | 0.2950 | 1.3792 | 2.6818 | -1.0227 | -2.8767 | 3.2783 | 1.3791 | 1.3761 | 1.4003 | 66.76 | 0.0028 |
| NZD/USD – New Zealand Dollar / U.S. Dollar | NZDUSD | 0.5829 | 0.1374 | 1.1419 | 0.2132 | -1.3086 | -4.1299 | 0.7327 | 3.3563 | -7.2256 | 0.5914 | 0.5956 | 0.5839 | 37.36 | -0.0025 |
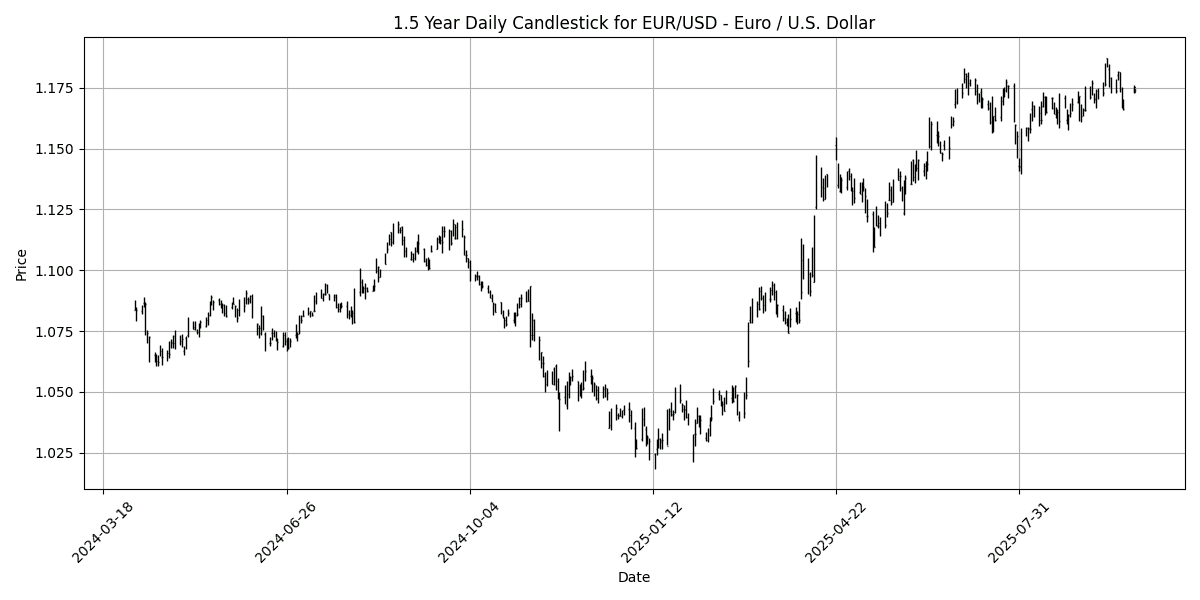
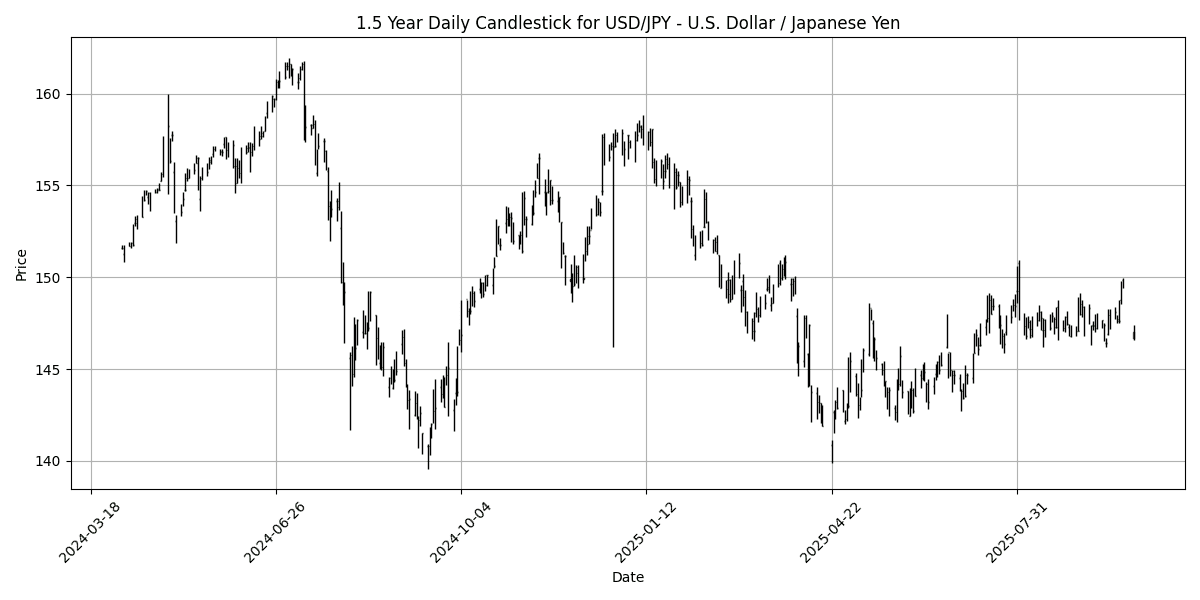
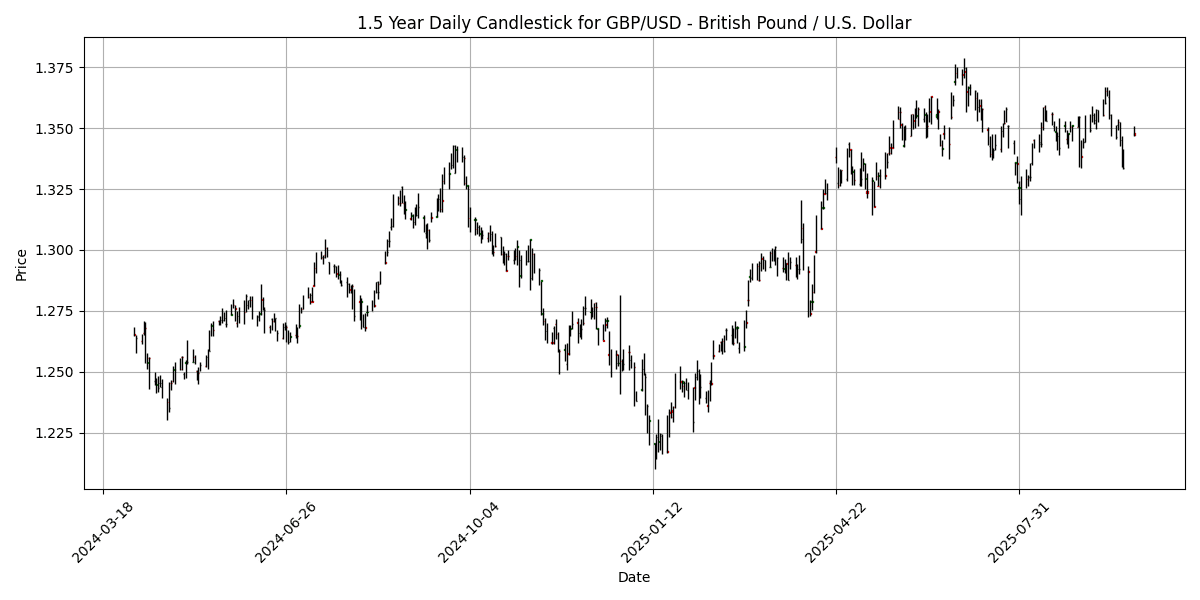
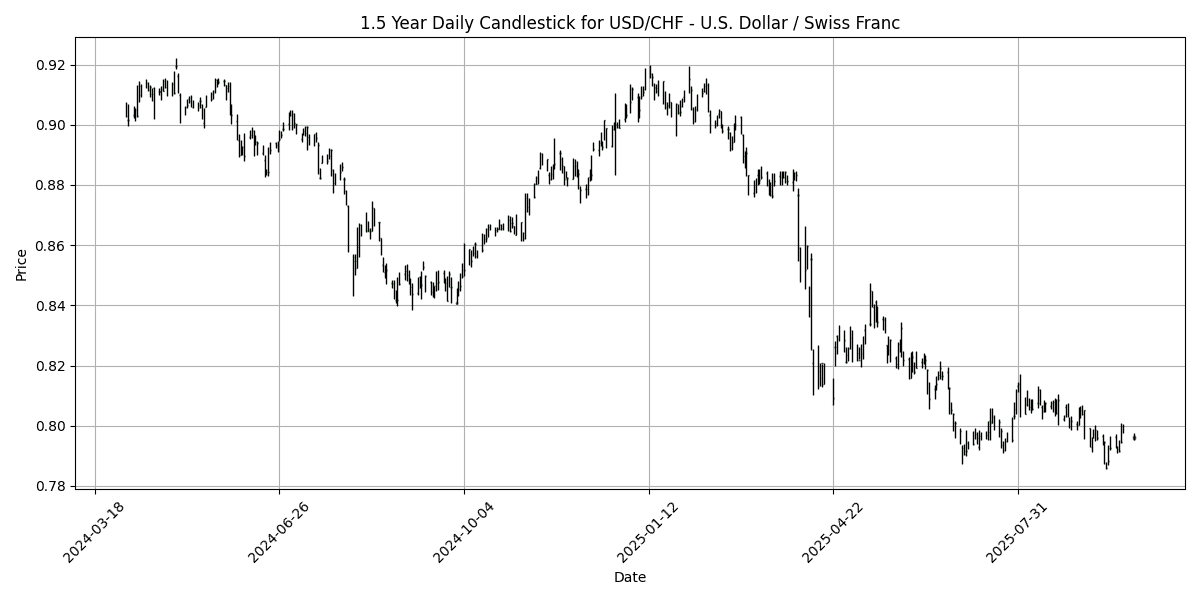
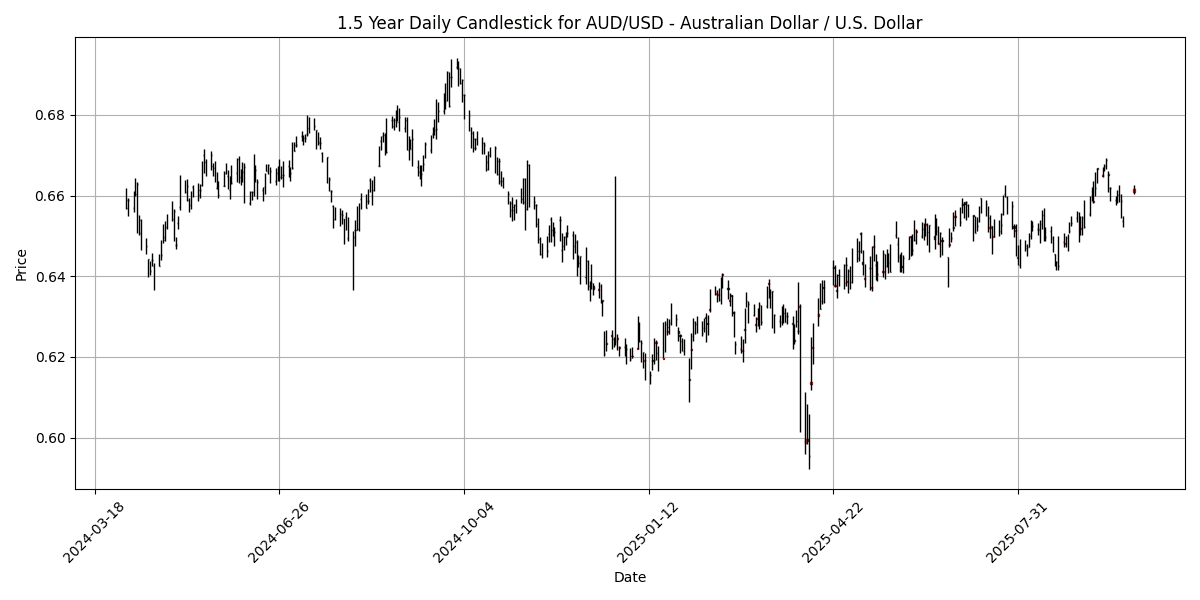

Currently, the analyzed FX pairs exhibit a mix of neutral to bearish conditions, with no pairs reaching extreme overbought or oversold levels. The EUR/USD remains stable with an RSI of 49.00 and a positive MACD, indicating a lack of strong momentum in either direction. The USD/JPY and GBP/USD also reflect similar sentiment, with RSIs of 46.52 and 44.86, respectively, and the latter showing a bearish MACD, suggesting potential downward pressure.
The USD/CAD is nearing overbought territory with an RSI of 66.76, though it remains below the critical 70 threshold, supported by a positive MACD. Conversely, the NZD/USD is notably oversold at an RSI of 37.36, coupled with a negative MACD, indicating a bearish outlook. Overall, market participants should remain cautious, as no significant trend reversals are indicated, and attention should be paid to upcoming economic data that could shift these dynamics.
## Cross FX Group
| Name | Symbol | Price | Daily (%) | 5D (%) | 1W (%) | 1M (%) | 3M (%) | 6M (%) | YTD (%) | 12M (%) | MA50 | MA100 | MA200 | RSI | MACD |
|---|---|---|---|---|---|---|---|---|---|---|---|---|---|---|---|
| EUR/GBP | EURGBP | 0.8722 | 0.1953 | -0.2573 | -0.0916 | 0.8674 | 1.2796 | 3.3780 | 5.1870 | 4.6380 | 0.8671 | 0.8590 | 0.8491 | 65.99 | 0.0021 |
| EUR/JPY | EURJPY | 172.43 | -0.0377 | -1.3435 | -1.3000 | 0.0621 | 1.2460 | 6.7773 | 5.5323 | 8.4270 | 172.51 | 169.73 | 165.46 | 42.93 | 0.5054 |
| EUR/CHF | EURCHF | 0.9352 | 0.0321 | 0.2326 | 0.2079 | -0.2347 | 0.0503 | -1.4365 | -0.5001 | -0.1196 | 0.9358 | 0.9358 | 0.9390 | 58.49 | -0.0007 |
| EUR/AUD | EURAUD | 1.7792 | 0.2649 | -0.2651 | -0.2086 | -0.4192 | -0.5728 | 1.8787 | 6.3352 | 10.64 | 1.7857 | 1.7778 | 1.7399 | 47.84 | -0.0009 |
| GBP/JPY | GBPJPY | 197.68 | -0.2387 | -1.0863 | -1.2094 | -0.7934 | -0.0268 | 3.2908 | 0.3457 | 3.6162 | 198.91 | 197.50 | 194.77 | 35.97 | 0.1026 |
| GBP/CHF | GBPCHF | 1.0720 | -0.1769 | 0.4780 | 0.2835 | -1.1015 | -1.2236 | -4.6696 | -5.4132 | -4.5652 | 1.0791 | 1.0895 | 1.1062 | 30.67 | -0.0035 |
| AUD/JPY | AUDJPY | 96.90 | -0.2974 | -1.0730 | -1.0912 | 0.4822 | 1.8349 | 4.8088 | -0.7396 | -1.9994 | 96.61 | 95.44 | 95.07 | 46.42 | 0.3368 |
| AUD/NZD | AUDNZD | 1.1334 | -0.2552 | -0.0661 | 0.1024 | 2.0998 | 4.7660 | 3.7257 | 2.7845 | 3.5201 | 1.1063 | 1.0947 | 1.0966 | 88.72 | 0.0074 |
| CHF/JPY | CHFJPY | 184.37 | -0.0482 | -1.5559 | -1.4891 | 0.3056 | 1.2007 | 8.3456 | 6.0841 | 8.5709 | 184.32 | 181.35 | 176.20 | 41.30 | 0.6711 |
| NZD/JPY | NZDJPY | 85.49 | -0.0362 | -0.9937 | -1.1825 | -1.5750 | -2.7993 | 1.0556 | -3.4296 | -5.3300 | 87.37 | 87.17 | 86.70 | 34.20 | -0.1773 |
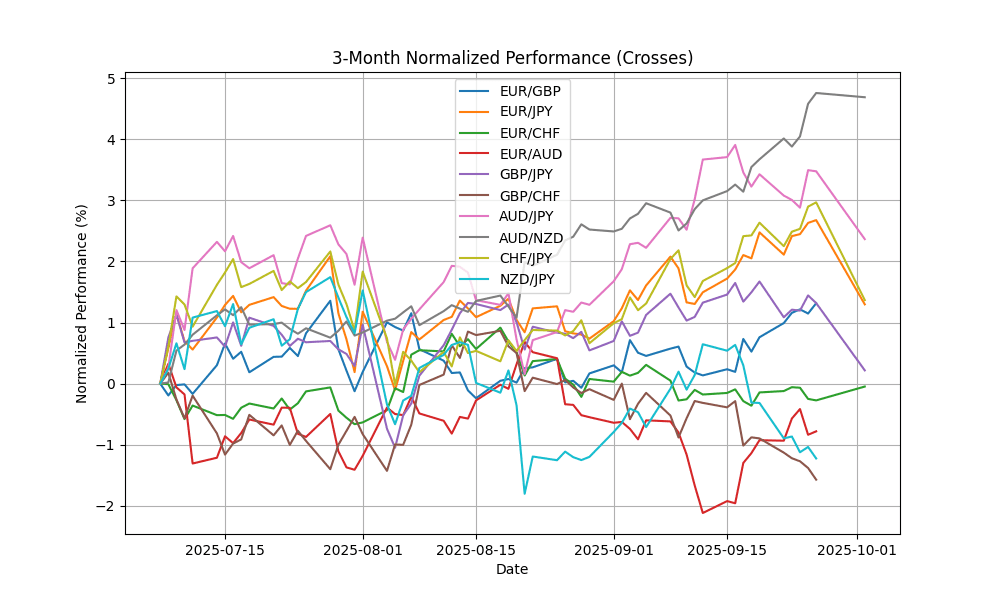
In the current forex landscape, the AUD/NZD pair stands out with an RSI of 88.72, indicating overbought conditions. This suggests potential price corrections ahead. Conversely, GBP/CHF and NZD/JPY exhibit significant bearish signals with RSIs of 30.67 and 34.20, respectively, pointing to oversold conditions, which may present buying opportunities. The MACD readings for GBP/CHF and AUD/NZD reinforce bearish and bullish sentiments, respectively. Additionally, the MA crossovers across these pairs indicate a mixed trend, with GBP/JPY and EUR/JPY reflecting consolidation. Traders should exercise caution and consider these indicators for informed decision-making in their trading strategies.
## Exotics and Emerging
| Name | Symbol | Price | Daily (%) | 5D (%) | 1W (%) | 1M (%) | 3M (%) | 6M (%) | YTD (%) | 12M (%) | MA50 | MA100 | MA200 | RSI | MACD |
|---|---|---|---|---|---|---|---|---|---|---|---|---|---|---|---|
| USD/TRY – U.S. Dollar / Turkish Lira | USDTRY | 41.60 | 0.0666 | 0.0857 | 0.3135 | 1.1100 | 4.4675 | 9.4562 | 17.83 | 21.69 | 40.99 | 40.24 | 38.48 | 82.48 | 0.1617 |
| USD/ZAR – U.S. Dollar / South African Rand | USDZAR | 17.18 | -0.1877 | -1.3919 | -0.8529 | -2.4792 | -1.8505 | -8.3227 | -8.4488 | -1.2877 | 17.60 | 17.73 | 18.12 | 34.97 | -0.0980 |
| USD/THB – U.S. Dollar / Thai Baht | USDTHB | 32.32 | -0.1545 | 0.3104 | 0.7167 | 0.1239 | -0.3392 | -5.5799 | -5.3282 | -0.6425 | 32.22 | 32.44 | 33.16 | 74.07 | -0.0490 |
| USD/SEK – U.S. Dollar / Swedish Krona | USDSEK | 9.3561 | -0.1931 | -1.1297 | -0.4665 | -0.2580 | -2.1977 | -4.4334 | -15.1284 | -8.9132 | 9.4939 | 9.5402 | 10.00 | 50.34 | -0.0327 |
| USD/NOK – U.S. Dollar / Norwegian Krone | USDNOK | 9.9362 | 0.2148 | -0.9379 | 0.0013 | -0.5099 | -1.1392 | -3.8034 | -12.2834 | -6.3292 | 10.08 | 10.11 | 10.52 | 47.29 | -0.0434 |
| USD/DKK – U.S. Dollar / Danish Krone | USDDKK | 6.3507 | -0.1760 | -0.7666 | -0.0677 | -0.3088 | 0.1974 | -6.0052 | -11.3872 | -5.7923 | 6.3888 | 6.4377 | 6.7080 | 50.92 | -0.0119 |
| USD/MXN – U.S. Dollar / Mexican Peso | USDMXN | 18.37 | -0.0876 | -0.6282 | -0.2755 | -1.5020 | -1.4905 | -7.8477 | -10.9741 | -6.4120 | 18.61 | 18.82 | 19.55 | 32.82 | -0.0783 |
| USD/PLN – U.S. Dollar / Polish Zloty | USDPLN | 3.6200 | -0.2755 | -1.1113 | -0.2768 | -0.4581 | 0.5155 | -5.3399 | -11.8593 | -6.5696 | 3.6431 | 3.6704 | 3.8088 | 52.21 | -0.0055 |
| USD/HUF – U.S. Dollar / Hungarian Forint | USDHUF | 330.41 | -0.2635 | -1.5673 | -0.8403 | -1.9342 | -2.3871 | -9.4070 | -16.3536 | -8.0864 | 337.94 | 343.68 | 361.61 | 51.81 | -1.8712 |
| USD/CZK – U.S. Dollar / Czech Koruna | USDCZK | 20.61 | -0.2290 | -1.1217 | -0.3081 | -1.1137 | -1.4442 | -9.0901 | -14.6876 | -9.7355 | 20.92 | 21.23 | 22.33 | 48.39 | -0.0898 |
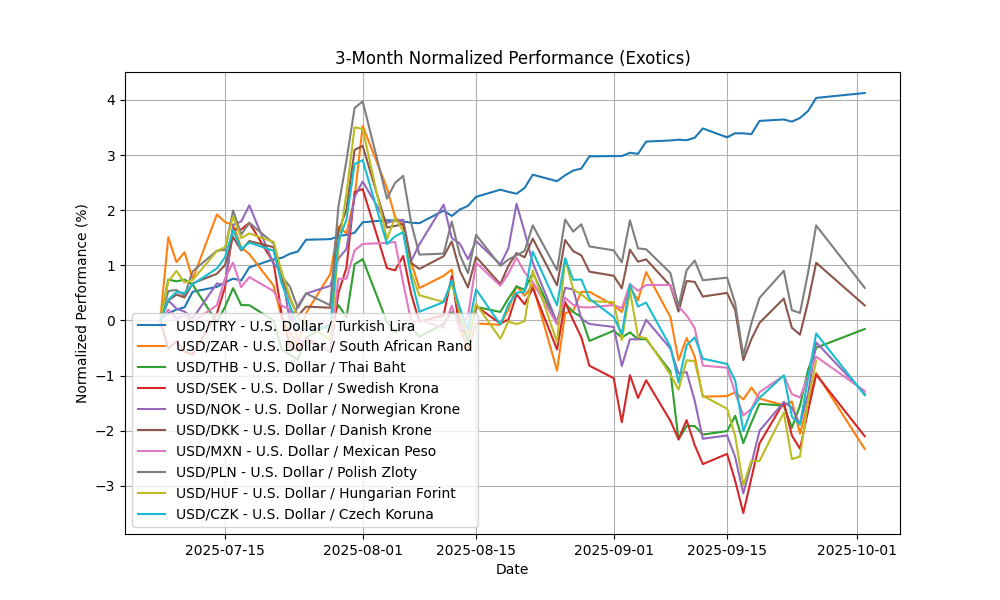
In the current analysis of key FX pairs, USD/TRY is significantly overbought with an RSI of 82.48, indicating strong bullish momentum despite a positive MACD of 0.1617. This suggests potential for a correction. Conversely, USD/ZAR, with an RSI of 34.97 and a negative MACD of -0.0980, is approaching oversold territory, signaling possible buying opportunities. USD/THB, at an RSI of 74.07, is also overbought, though its MACD is negative, indicating weakening momentum. Other pairs like USD/SEK and USD/NOK show neutral conditions, with RSIs around 50, suggesting limited immediate trading action. Overall, caution is warranted


