Asian Indices Rise; KOSPI Composite Leads Gains
Shanghai Composite Technical Analysis
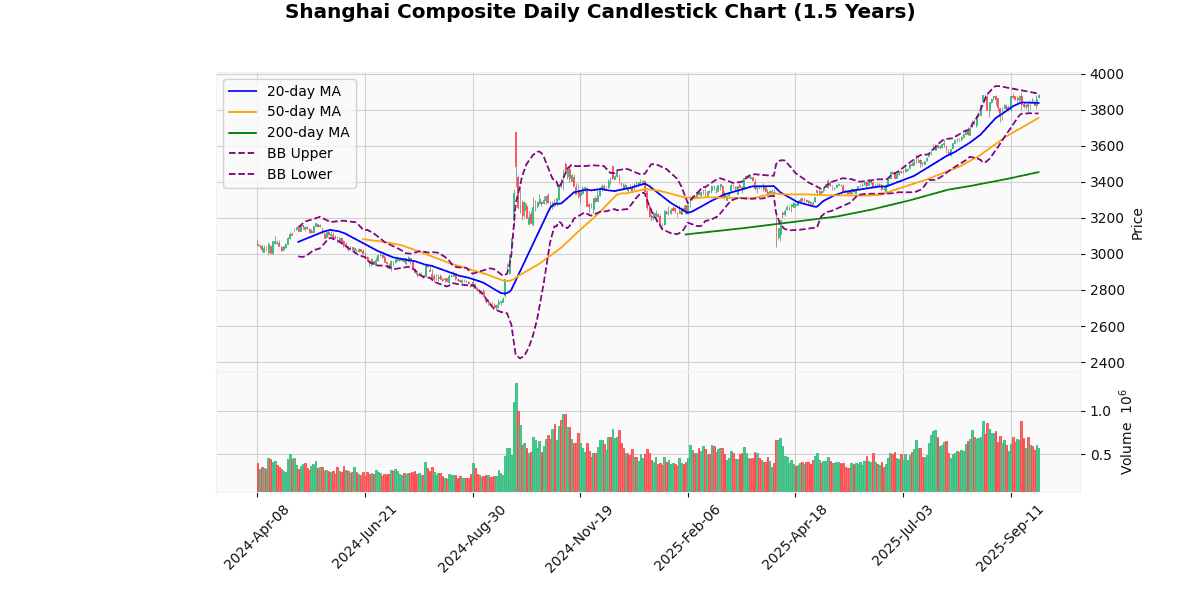
The Shanghai Composite Index is currently priced at 3882.78, showing a modest increase of 0.52% today. This movement places the index near its 52-week and year-to-date high of 3899.96, indicating a strong upward momentum in recent times.
Analyzing the moving averages, the index is positioned above its 20-day (3838.27), 50-day (3755.59), and 200-day (3454.41) moving averages. This alignment suggests a robust bullish trend over short, medium, and long-term periods. The price being above all these averages by 1.16%, 3.39%, and 12.4% respectively, reinforces the strength of the current uptrend.
The Bollinger Bands show the index trading near the upper band (3896.71), with today’s price only 0.36% below this level. This proximity to the upper band, combined with a Bollinger Band width of 116.88 (difference between upper and lower bands), suggests moderate volatility. The index’s position near the upper band typically signals high price levels relative to recent history, which could indicate potential resistance or a forthcoming consolidation.
The Relative Strength Index (RSI) at 61.35 is in the upper range but not yet in the overbought territory (typically considered overbought above 70). This suggests that while the market is strong, there is still room for upward movement before becoming excessively bought.
The Moving Average Convergence Divergence (MACD) value at 27.04 below its signal line at 31.83 indicates a recent bearish crossover, which could suggest a potential slowdown or reversal in the upward momentum. However, the positive values for both indicate overall bullish momentum is still in play.
The index’s Average True Range (ATR) of 44.41 points to a relatively stable volatility level, consistent with the moderate Bollinger Band width observed.
In summary, the Shanghai Composite Index shows strong bullish signals across most metrics, but the proximity to significant highs and the recent MACD crossover warrant caution for potential consolidation or pullback in the near term. Investors should watch for any sustained movement beyond the 52-week high or a reversal signaled by key metrics like the MACD and RSI for further direction.
Technical Metrics
| Metric | Value |
|---|---|
| Current Price | 3882.78 |
| Today’s Change (%) | 0.52 |
| 20-day MA | 3838.27 |
| % from 20-day MA | 1.16 |
| 50-day MA | 3755.59 |
| % from 50-day MA | 3.39 |
| 200-day MA | 3454.41 |
| % from 200-day MA | 12.40 |
| Bollinger Upper | 3896.71 |
| % from BB Upper | -0.36 |
| Bollinger Lower | 3779.83 |
| % from BB Lower | 2.72 |
| RSI (14) | 61.35 |
| MACD | 27.04 |
| MACD Signal | 31.83 |
| 3-day High | 3887.57 |
| % from 3-day High | -0.12 |
| 3-day Low | 3809.53 |
| % from 3-day Low | 1.92 |
| 52-week High | 3899.96 |
| % from 52-week High | -0.44 |
| 52-week Low | 2697.78 |
| % from 52-week Low | 43.93 |
| YTD High | 3899.96 |
| % from YTD High | -0.44 |
| YTD Low | 3040.69 |
| % from YTD Low | 27.69 |
| ATR (14) | 44.41 |
The Shanghai Composite Index currently displays a bullish technical posture, trading above its key moving averages (20-day, 50-day, and 200-day), which are positioned at 3838.27, 3755.59, and 3454.41 respectively. This indicates a strong upward trend over both short and long-term periods. The index’s proximity to the upper Bollinger Band (3896.71) suggests it is approaching a potential resistance area, while the lower band at 3779.83 could serve as near-term support.
The Relative Strength Index (RSI) at 61.35 points to a moderately bullish momentum without being overbought, which could support further gains if sustained. However, the Moving Average Convergence Divergence (MACD) at 27.04, currently below its signal line (31.83), hints at a possible slowdown in the upward momentum or a consolidation phase.
Volatility, as measured by the Average True Range (ATR) of 44.41, indicates moderate daily price movement, which aligns with the index’s recent activity near its 52-week and year-to-date highs. The index is just shy of these levels, suggesting a testing of resistance near the 3899.96 mark.
Overall, market sentiment appears positive, supported by the index’s performance above significant moving averages and near historical highs. Investors should watch for potential resistance near the upper Bollinger Band and the 52-week high, with key support likely around the 20-day moving average and the lower Bollinger Band. The technical indicators suggest cautious optimism with a watchful eye on MACD signals for any changes in momentum.
Hang Seng Technical Analysis
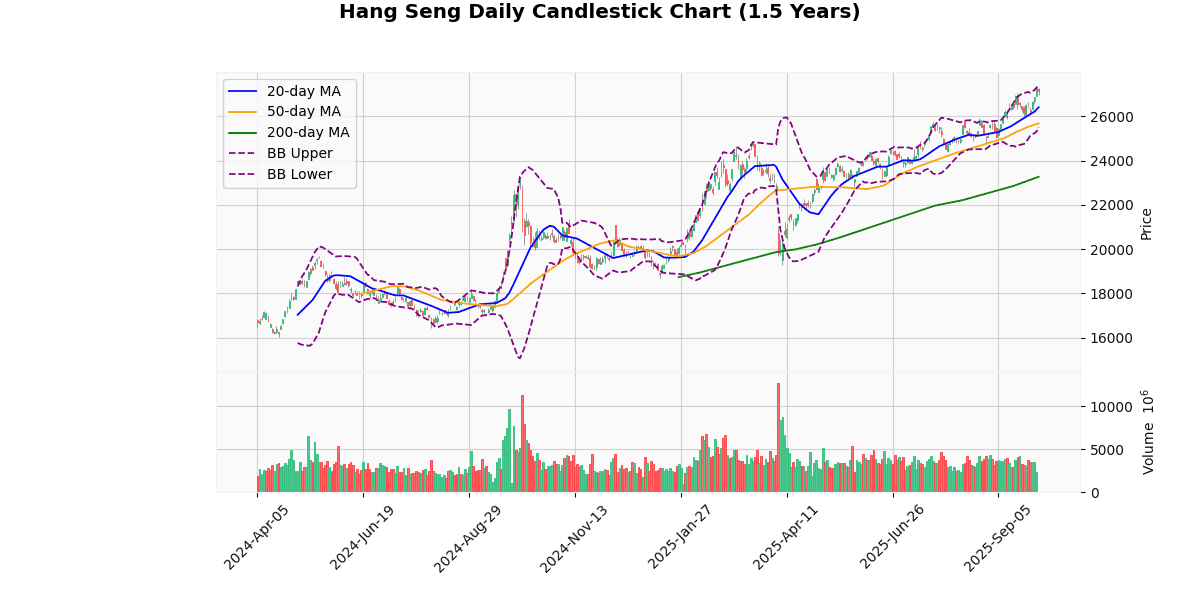
The Hang Seng Index currently stands at 27,120.7, reflecting a slight decrease of 0.61% today. This movement places the index just below its upper Bollinger Band (27,289.66), indicating a potential resistance level. The index is currently trading above all its key moving averages (20-day at 26,403.46, 50-day at 25,676.54, and 200-day at 23,265.73), suggesting a strong bullish trend over the short, medium, and long term.
The Relative Strength Index (RSI) of 63.88 suggests the market is approaching overbought territory but is not there yet, indicating there might still be some momentum left for upward movement. The Moving Average Convergence Divergence (MACD) at 384.4, with a signal line at 341.12, shows a bullish crossover, further supporting the upward trend.
The index’s proximity to its 52-week and year-to-date high (27,381.84), with a minimal percentage difference of -0.95%, suggests that it is testing crucial resistance levels. If it breaks these levels, there could be significant bullish momentum ahead. Conversely, a failure to break could lead to a pullback.
The Average True Range (ATR) at 395.63 indicates moderate volatility, which aligns with the current price fluctuations near critical resistance points.
In summary, the Hang Seng Index exhibits a strong bullish trend with potential resistance near its recent highs. The technical indicators suggest continued upward movement, but caution is warranted near these high levels due to possible pullbacks if resistance holds. Investors should watch for either a consolidation above the current levels or a retraction if upward momentum wanes.
Technical Metrics
| Metric | Value |
|---|---|
| Current Price | 27120.70 |
| Today’s Change (%) | -0.61 |
| 20-day MA | 26403.46 |
| % from 20-day MA | 2.72 |
| 50-day MA | 25676.54 |
| % from 50-day MA | 5.62 |
| 200-day MA | 23265.73 |
| % from 200-day MA | 16.57 |
| Bollinger Upper | 27289.66 |
| % from BB Upper | -0.62 |
| Bollinger Lower | 25517.26 |
| % from BB Lower | 6.28 |
| RSI (14) | 63.88 |
| MACD | 384.40 |
| MACD Signal | 341.12 |
| 3-day High | 27381.84 |
| % from 3-day High | -0.95 |
| 3-day Low | 26558.28 |
| % from 3-day Low | 2.12 |
| 52-week High | 27381.84 |
| % from 52-week High | -0.95 |
| 52-week Low | 18671.49 |
| % from 52-week Low | 45.25 |
| YTD High | 27381.84 |
| % from YTD High | -0.95 |
| YTD Low | 18671.49 |
| % from YTD Low | 45.25 |
| ATR (14) | 395.63 |
The technical outlook for the Hang Seng Index suggests a bullish trend, as indicated by its current price of 27120.7, which is above all key moving averages (MA20 at 26403.46, MA50 at 25676.54, and MA200 at 23265.73). This positioning reflects strong upward momentum over short, medium, and long-term periods.
The index is trading near the upper Bollinger Band (27289.66), suggesting that it is approaching overbought territory, though it has not yet breached this level. The Relative Strength Index (RSI) at 63.88 supports this, indicating high buying momentum but still below the typical overbought threshold of 70. The MACD value at 384.4, above its signal line at 341.12, further confirms the bullish momentum.
Volatility, as measured by the Average True Range (ATR) of 395.63, remains relatively high, reflecting ongoing market fluctuations and potential for significant price movements.
Key resistance is near the recent 52-week and year-to-date high at 27381.84, while support might be found around the 3-day low of 26558.28 and further down at the lower Bollinger Band at 25517.26. Given the current market sentiment and technical indicators, the Hang Seng Index may continue to test its recent highs, though traders should watch for any signs of reversal or increased volatility that could impact this trajectory.
Nikkei 225 Technical Analysis
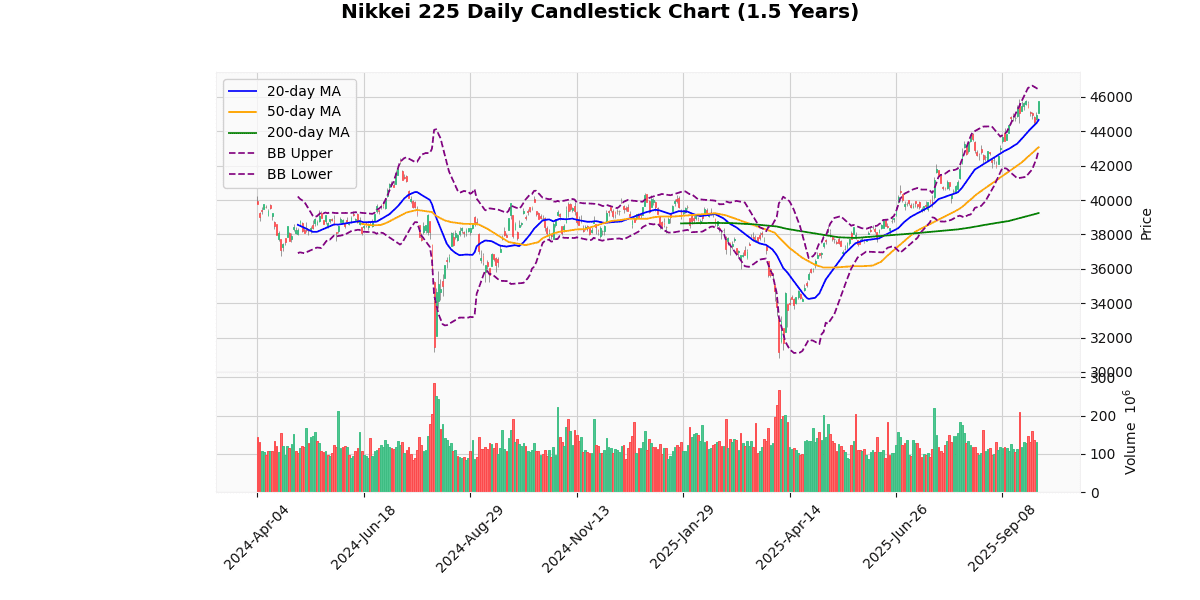
The Nikkei 225 index is currently priced at 45,769.5, reflecting a significant uptrend with today’s increase of 1.85%. The index is trading above all its major moving averages (20-day at 44,659.48, 50-day at 43,069.52, and 200-day at 39,239.55), indicating a strong bullish trend over short, medium, and long-term periods. The distances from these averages (2.49% from the 20-day, 6.27% from the 50-day, and 16.64% from the 200-day) further emphasize the ongoing upward momentum.
The Bollinger Bands show the current price nearing the upper band (46,434.98), suggesting that the index is approaching overbought territory. This is supported by the Relative Strength Index (RSI) at 66.21, nearing the overbought threshold of 70, which might signal a potential pullback or stabilization in the near term.
The Moving Average Convergence Divergence (MACD) at 697.47 is currently below its signal line at 766.95, indicating a bearish crossover. This could suggest a potential slowdown in the bullish momentum or a forthcoming correction.
The index is very close to its 52-week and year-to-date high of 45,852.75, marked by a mere 0.18% difference, showing that it is testing critical resistance levels. The Average True Range (ATR) at 582.81 points to high volatility, which is typical in scenarios where indices reach new highs.
Considering the proximity to the upper Bollinger Band, the near-overbought RSI, and the bearish MACD crossover, traders should watch for potential volatility or price corrections. However, the strong position above all key moving averages suggests any pullback might be short-lived, serving more as a consolidation phase in a continuing bullish trend.
Technical Metrics
| Metric | Value |
|---|---|
| Current Price | 45769.50 |
| Today’s Change (%) | 1.85 |
| 20-day MA | 44659.48 |
| % from 20-day MA | 2.49 |
| 50-day MA | 43069.52 |
| % from 50-day MA | 6.27 |
| 200-day MA | 39239.55 |
| % from 200-day MA | 16.64 |
| Bollinger Upper | 46434.98 |
| % from BB Upper | -1.43 |
| Bollinger Lower | 42883.99 |
| % from BB Lower | 6.73 |
| RSI (14) | 66.21 |
| MACD | 697.47 |
| MACD Signal | 766.95 |
| 3-day High | 45778.66 |
| % from 3-day High | -0.02 |
| 3-day Low | 44357.65 |
| % from 3-day Low | 3.18 |
| 52-week High | 45852.75 |
| % from 52-week High | -0.18 |
| 52-week Low | 30792.74 |
| % from 52-week Low | 48.64 |
| YTD High | 45852.75 |
| % from YTD High | -0.18 |
| YTD Low | 30792.74 |
| % from YTD Low | 48.64 |
| ATR (14) | 582.81 |
The technical outlook for the Nikkei 225 index suggests a bullish trend, as indicated by its current price of 45,769.5, which is above all key moving averages (MA20, MA50, MA200). This positioning above the moving averages, with significant percentage differences (MA200 at 16.64%, MA50 at 6.27%, MA20 at 2.49%), highlights a strong upward momentum over short, medium, and long-term periods.
The index is trading near its upper Bollinger Band and close to its 52-week and year-to-date highs, suggesting some level of resistance around these areas. The proximity to the upper Bollinger Band (only -1.43% below the upper band) and the 52-week high (-0.18% below) might indicate potential for a pullback or consolidation in the short term unless it breaks these levels to establish new highs.
The Relative Strength Index (RSI) at 66.21 is nearing overbought territory but does not yet signal a reversal, supporting the continuation of the current trend. However, the MACD below its signal line (697.47 vs. 766.95) suggests some caution as it may indicate a slowing momentum.
Volatility, as measured by the Average True Range (ATR) of 582.81, remains relatively high, which could mean larger price swings and thus opportunities for traders.
Support might be found at the lower Bollinger Band (42,883.99) and resistance at the recent 3-day and 52-week highs (45,778.66 and 45,852.75, respectively). Market sentiment appears positive, but traders should watch for any signs of reversal or consolidation given the index’s current levels and technical indicators.
KOSPI Composite Technical Analysis
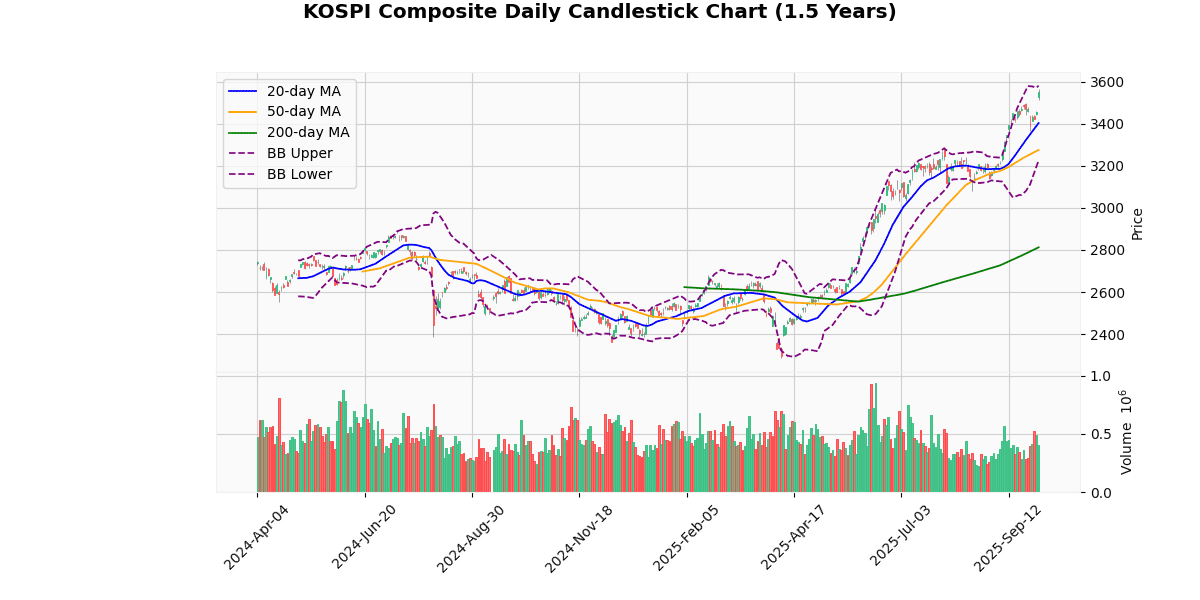
The KOSPI Composite index is currently priced at 3549.21, marking a modest increase of 2.7 points today. Analyzing its performance relative to various technical indicators provides insights into its current market position and potential future movements.
**Moving Averages:** The index is trading above all key moving averages (20-day at 3403.04, 50-day at 3275.27, and 200-day at 2812.33), indicating a strong bullish trend over short, medium, and long-term periods. The significant gaps between the current price and these averages highlight sustained positive momentum.
**Bollinger Bands:** The current price is nearing the upper Bollinger Band (3581.05), suggesting that the index is approaching overbought territory. The middle band (3403.04) aligns with the 20-day MA, reinforcing support at this level.
**RSI and MACD:** The Relative Strength Index (RSI) at 70.61 is near the overbought threshold of 70, which could indicate a potential pullback or consolidation in the near term. The Moving Average Convergence Divergence (MACD) value of 66.14 above its signal line (65.16) supports the ongoing bullish trend but warrants caution for a possible reversal if it crosses below the signal line.
**Highs/Lows and ATR:** The index is just below its 3-day and 52-week high at 3565.96, showing it is testing resistance levels. The Average True Range (ATR) of 46.54 points to moderate daily volatility, suggesting that any significant price movements are within expected ranges.
**Conclusion:** The KOSPI Composite is exhibiting strong bullish behavior, supported by its performance above moving averages and a positive MACD. However, the proximity to the upper Bollinger Band and a high RSI level suggest that the index might soon face resistance or a brief correction. Investors should monitor for any potential MACD crossovers or RSI movements beyond the overbought zone, which could signal a short-term reversal or consolidation.
Technical Metrics
| Metric | Value |
|---|---|
| Current Price | 3549.21 |
| Today’s Change (%) | 2.70 |
| 20-day MA | 3403.04 |
| % from 20-day MA | 4.30 |
| 50-day MA | 3275.27 |
| % from 50-day MA | 8.36 |
| 200-day MA | 2812.33 |
| % from 200-day MA | 26.20 |
| Bollinger Upper | 3581.05 |
| % from BB Upper | -0.89 |
| Bollinger Lower | 3225.04 |
| % from BB Lower | 10.05 |
| RSI (14) | 70.61 |
| MACD | 66.14 |
| MACD Signal | 65.16 |
| 3-day High | 3565.96 |
| % from 3-day High | -0.47 |
| 3-day Low | 3421.89 |
| % from 3-day Low | 3.72 |
| 52-week High | 3565.96 |
| % from 52-week High | -0.47 |
| 52-week Low | 2284.72 |
| % from 52-week Low | 55.35 |
| YTD High | 3565.96 |
| % from YTD High | -0.47 |
| YTD Low | 2284.72 |
| % from YTD Low | 55.35 |
| ATR (14) | 46.54 |
The technical outlook for the KOSPI Composite Index suggests a strong bullish trend, as evidenced by its current price of 3549.21, which is significantly above its 20-day, 50-day, and 200-day moving averages. This indicates sustained upward momentum over short, medium, and long-term periods. The index is trading near its upper Bollinger Band and just shy of its 52-week and year-to-date highs, suggesting some level of resistance around the 3565.96 area. However, the proximity to the upper Bollinger Band also signals that the market might be slightly overextended in the short term.
The Relative Strength Index (RSI) at 70.61 is on the brink of the overbought territory, which could hint at a potential pullback or consolidation in the near future. Meanwhile, the MACD is above its signal line, supporting the continuation of the bullish trend. The Average True Range (ATR) of 46.54 points to a moderately high level of market volatility, which could lead to significant price movements either way.
Potential support can be found around the middle Bollinger Band at 3403.04, aligning closely with the recent low of 3421.89. If a pullback occurs, these levels could serve as robust support zones. Overall, market sentiment appears positive, but traders should be cautious of potential volatility and the possibility of a short-term correction given the proximity to key resistance levels and overbought RSI readings.
STI Technical Analysis
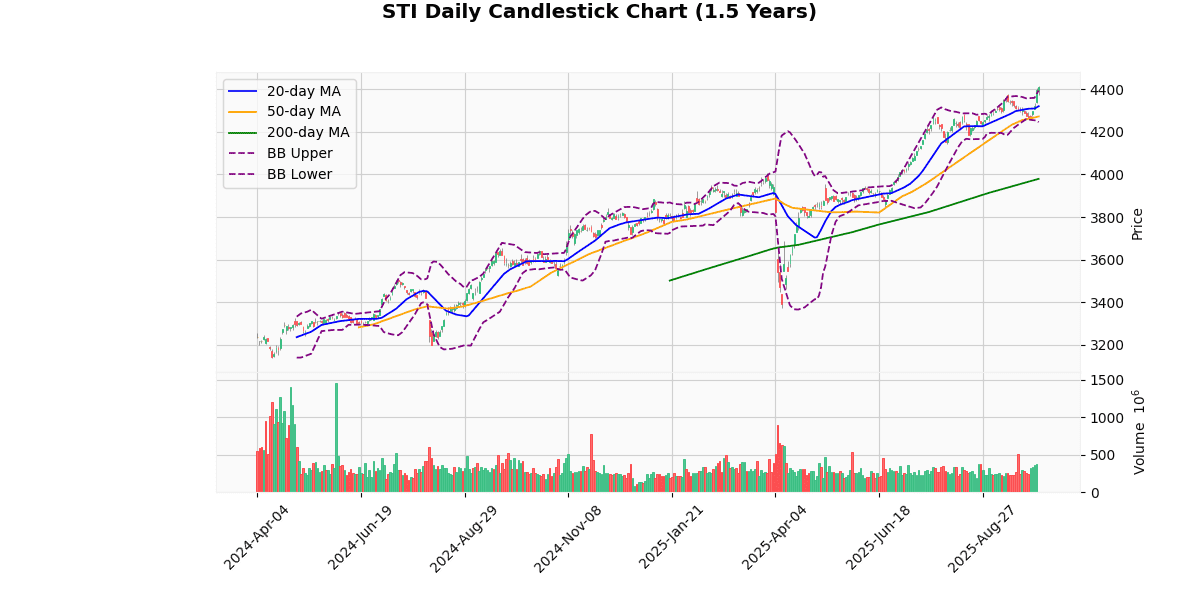
The STI index is currently priced at 4410.83, marking a modest increase of 0.36% today. This price is notably above its 20-day (4319.87), 50-day (4272.08), and 200-day (3979.3) moving averages, indicating a strong bullish trend over short, medium, and long-term periods. The index’s price is slightly above the upper Bollinger Band (4394.4), which typically suggests that the index might be in the overbought territory.
The Relative Strength Index (RSI) at 73.22 further supports this, as it is above the typical overbought threshold of 70, suggesting potential for a pullback or consolidation in the near term. The Moving Average Convergence Divergence (MACD) at 23.04, above its signal line at 16.97, confirms the ongoing bullish momentum but also warrants caution for a potential reversal if the index begins to diverge negatively.
The index’s current price is just shy of its 3-day high (4416.9) and significantly above its 3-day low (4307.76), indicating recent upward movement. The proximity to the 52-week and year-to-date high (both at 4416.9) suggests that the index is testing critical resistance levels.
The Average True Range (ATR) of 31.58 reflects moderate volatility, which, combined with the current Bollinger Band width, suggests that while the market is active, it is not experiencing extreme volatility.
In summary, the STI index shows strong bullish signals across several indicators, but the proximity to key resistance levels and overbought conditions as indicated by the RSI and Bollinger Bands suggest that investors should be cautious of potential reversals or consolidations. A watchful eye on MACD for any bearish crossovers and RSI for sustained movements above 70 will be crucial in the coming days.
Technical Metrics
| Metric | Value |
|---|---|
| Current Price | 4410.83 |
| Today’s Change (%) | 0.36 |
| 20-day MA | 4319.87 |
| % from 20-day MA | 2.11 |
| 50-day MA | 4272.08 |
| % from 50-day MA | 3.25 |
| 200-day MA | 3979.30 |
| % from 200-day MA | 10.84 |
| Bollinger Upper | 4394.40 |
| % from BB Upper | 0.37 |
| Bollinger Lower | 4245.34 |
| % from BB Lower | 3.90 |
| RSI (14) | 73.22 |
| MACD | 23.04 |
| MACD Signal | 16.97 |
| 3-day High | 4416.90 |
| % from 3-day High | -0.14 |
| 3-day Low | 4307.76 |
| % from 3-day Low | 2.39 |
| 52-week High | 4416.90 |
| % from 52-week High | -0.14 |
| 52-week Low | 3372.38 |
| % from 52-week Low | 30.79 |
| YTD High | 4416.90 |
| % from YTD High | -0.14 |
| YTD Low | 3372.38 |
| % from YTD Low | 30.79 |
| ATR (14) | 31.58 |
The technical outlook for the STI index presents a bullish scenario as evidenced by several key indicators. The current price of 4410.83 is above all major moving averages (20-day, 50-day, and 200-day), indicating a strong upward trend. The price is also slightly above the upper Bollinger Band, suggesting that the index might be in an overbought territory, which is corroborated by a high RSI of 73.22. This could signal a potential short-term pullback or consolidation.
The MACD value at 23.04 above its signal line at 16.97 supports the momentum in the upward direction. However, traders should be cautious as the proximity to the 52-week high of 4416.9 and the YTD high indicates potential resistance near these levels.
The Average True Range (ATR) of 31.58 points to moderate volatility, giving room for price swings that should be monitored closely by traders. Immediate support is likely around the 20-day moving average of 4319.87, while resistance could be tested again at the 52-week and YTD highs.
Overall, market sentiment appears positive, but with the index trading near historical highs and indicators suggesting overbought conditions, investors might witness some price stabilization or correction in the near term before any further upward movement.


