Top 10 Performers
Vertex Pharmaceuticals Inc (VRTX) (1.98%)
Recent News (Last 24 Hours)
In light of recent concerns regarding the imposition of tariffs, investors are seeking refuge in safe haven stocks. A recent article by Motley Fool, dated October 7, 2025, highlights two stocks that are considered resilient during economic uncertainties caused by such trade barriers. The article suggests that these stocks represent a prudent investment opportunity, particularly for those looking to invest a modest sum of $500 during market dips influenced by tariff news.
The potential impact on the stock market from this advice could be an increased investor interest in the identified safe haven stocks, possibly leading to a rise in their share prices as more investors buy in during the dip. This strategy not only aims to safeguard the investment from tariff-induced volatility but also capitalizes on the lower stock prices to yield better returns once the market stabilizes. Investors and analysts will likely monitor these stocks closely, assessing their performance and stability in the face of ongoing and future economic uncertainties.
Technical Analysis
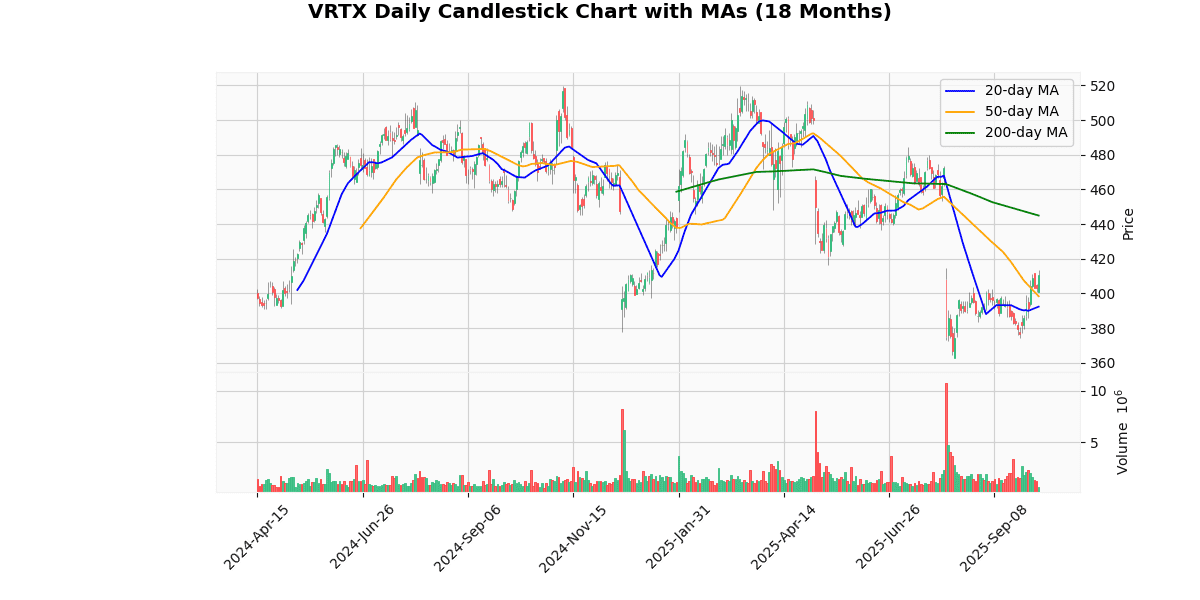
The current price of the asset at $411.09 indicates a recent uptrend, as it stands above both the 20-day moving average (MA20) of $392.34 and the 50-day moving average (MA50) of $398.36. This positioning suggests a short-term bullish sentiment in the market, as the price has moved above recent averages. However, the price remains below the 200-day moving average (MA200) of $444.93, indicating that the longer-term trend might still be bearish. The discrepancy between the short-term gains and the lower position relative to the MA200 could suggest potential resistance near the MA200 level. Investors might view the current rise as a corrective rally within a broader bearish trend, unless the price can sustainably break above the MA200, which would signal a more definitive shift in market sentiment.
Recent Ratings
| Date | Status | Outer | Rating | Price |
|---|---|---|---|---|
| 2025-09-25 00:00:00 | Upgrade | Leerink Partners | Market Perform → Outperform | $456 |
| 2025-09-03 00:00:00 | Initiated | Raymond James | Mkt Perform | |
| 2025-08-06 00:00:00 | Upgrade | Wells Fargo | Equal Weight → Overweight | $460 |
| 2025-05-07 00:00:00 | Downgrade | Wolfe Research | Outperform → Peer Perform |
T-Mobile US Inc (TMUS) (1.32%)
Recent News (Last 24 Hours)
In recent financial news, the telecommunications sector is showing significant activity with implications for stock movements. T-Mobile is poised to release its Q3 2025 earnings, an event closely watched by investors to gauge the company’s performance and strategic direction amid competitive and economic pressures. The anticipation surrounding these earnings could potentially influence T-Mobile’s stock, depending on whether the results meet, exceed, or fall short of market expectations. The specifics of what to expect from these earnings have been detailed in a recent article on Barchart, which could provide insights into potential market reactions.
Simultaneously, Verizon has notably impacted investor sentiment across the wireless sector with a statement encapsulated by “four words” that have raised concerns among stakeholders. As reported by MarketWatch, this development has led to apprehension about Verizon’s immediate financial health and strategic positioning, potentially affecting its stock price and having broader implications for the market. Investors and analysts will likely monitor these developments closely, assessing the potential long-term impacts on the stocks of Verizon and its competitors within the industry.
Technical Analysis
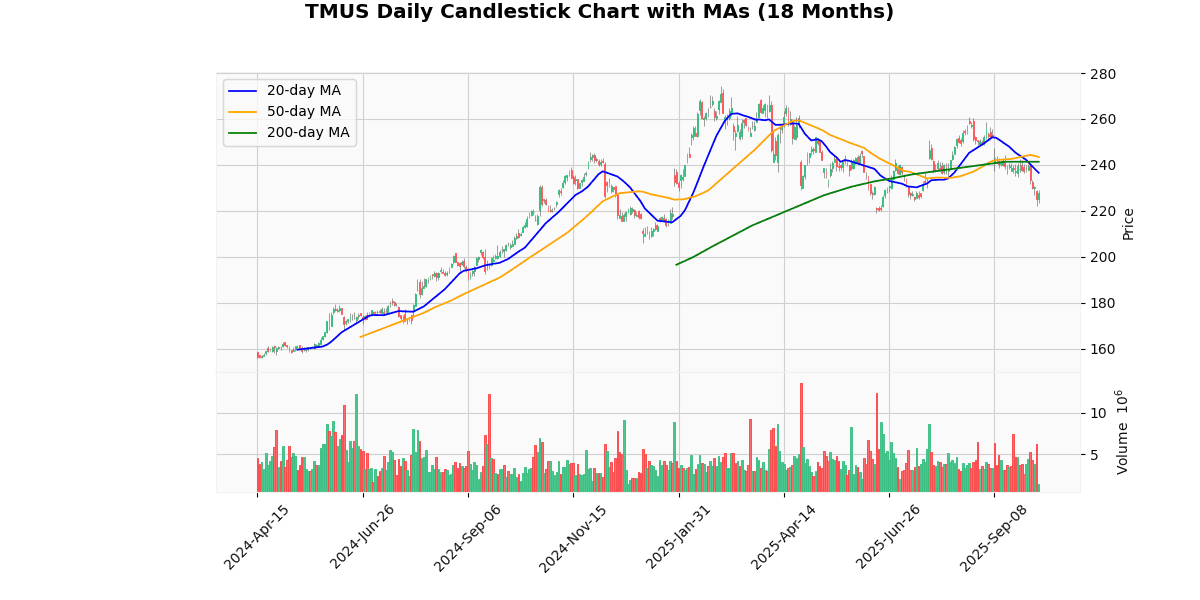
The current price of the asset at $228.01 is positioned below all key moving averages: the 20-day ($236.6), 50-day ($243.42), and 200-day ($241.37). This positioning indicates a bearish trend in the short to medium term, as the price is consistently underperforming relative to historical averages. The fact that the 20-day moving average is below the 50-day and 200-day averages further confirms a downward momentum, suggesting that recent trading sessions have been particularly weak. Investors might view this as a potential signal for a continued bearish outlook, as the asset shows no immediate signs of recovery above these critical levels. This could potentially deter short-term buyers, while long-term investors might await stabilization or a positive shift in fundamentals before increasing positions.
Recent Ratings
| Date | Status | Outer | Rating | Price |
|---|---|---|---|---|
| 2025-09-02 00:00:00 | Resumed | Goldman | Buy | $286 |
| 2025-07-09 00:00:00 | Downgrade | KeyBanc Capital Markets | Sector Weight → Underweight | $200 |
| 2025-07-07 00:00:00 | Upgrade | Rothschild & Co Redburn | Sell → Neutral | $228 |
| 2025-07-07 00:00:00 | Resumed | BofA Securities | Neutral | $255 |
Arm Holdings plc. ADR (ARM) (0.62%)
Technical Analysis
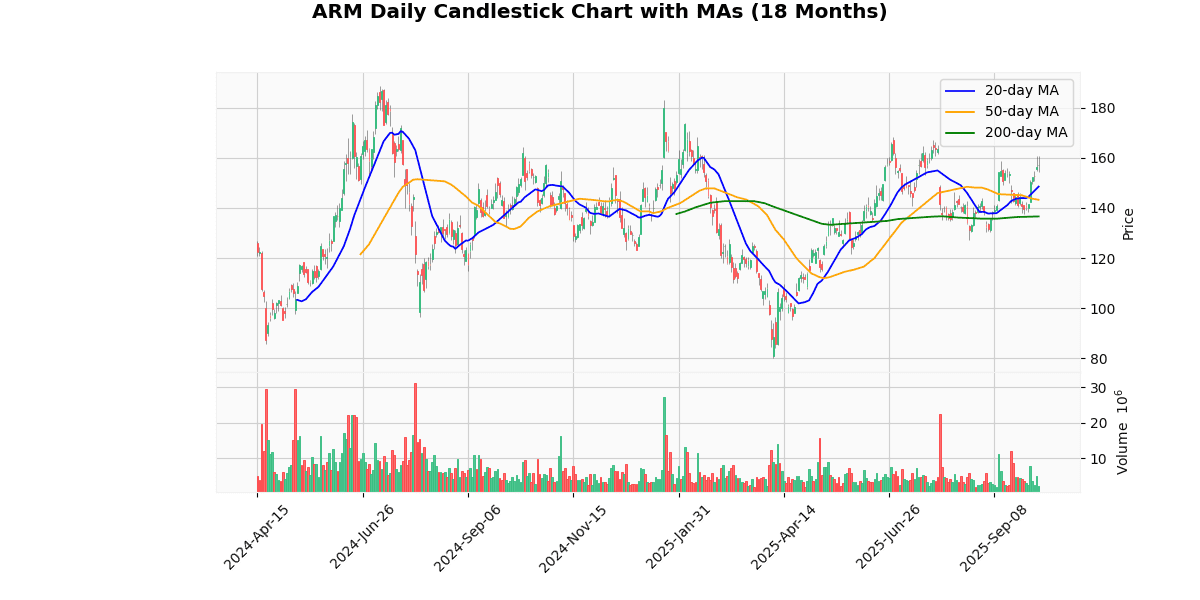
The current price of the asset at $157.44 exhibits a robust upward trajectory when analyzed against its moving averages (MAs) across different time frames. Specifically, the price is significantly above the 20-day moving average (MA20) of $148.51, the 50-day moving average (MA50) of $143.24, and well above the 200-day moving average (MA200) of $136.6. This positioning indicates a strong bullish trend in the short, medium, and long term. The considerable gap between the current price and these MAs suggests that the asset has been gaining momentum and might continue to do so if the market conditions remain favorable. Investors might view these indicators as a sign of sustained strength, potentially leading to increased buying interest in the market. However, vigilance is advised as such steep inclines could also lead to volatility or price corrections.
Recent Ratings
| Date | Status | Outer | Rating | Price |
|---|---|---|---|---|
| 2025-08-11 00:00:00 | Initiated | Seaport Research Partners | Buy | $150 |
| 2025-07-31 00:00:00 | Reiterated | TD Cowen | Buy | $155 → $175 |
| 2025-07-16 00:00:00 | Upgrade | BNP Paribas Exane | Neutral → Outperform | $210 |
| 2025-07-10 00:00:00 | Initiated | Goldman | Neutral | $160 |
Automatic Data Processing Inc (ADP) (0.56%)
Recent News (Last 24 Hours)
In a recent analysis dated October 6, 2025, ADP’s (NASDAQ:ADP) second-quarter earnings were scrutinized in comparison to its peers within the data and business process services sector. The detailed review, published by StockStory, highlights ADP’s financial performance and strategic positioning amidst industry-wide trends and economic factors influencing the sector.
ADP’s earnings report could potentially impact its stock price and investor sentiment. Typically, a strong earnings performance compared to peers can bolster investor confidence, driving up stock prices, while underperformance might trigger a sell-off. Investors and stakeholders will likely scrutinize ADP’s operational efficiency, revenue growth, and profit margins in relation to its competitors to gauge the company’s market position and potential for future growth.
This analysis is crucial for investors considering the broader economic pressures facing the industry, including technological advancements and regulatory changes, which could significantly impact operational dynamics and profitability across the sector.
Technical Analysis
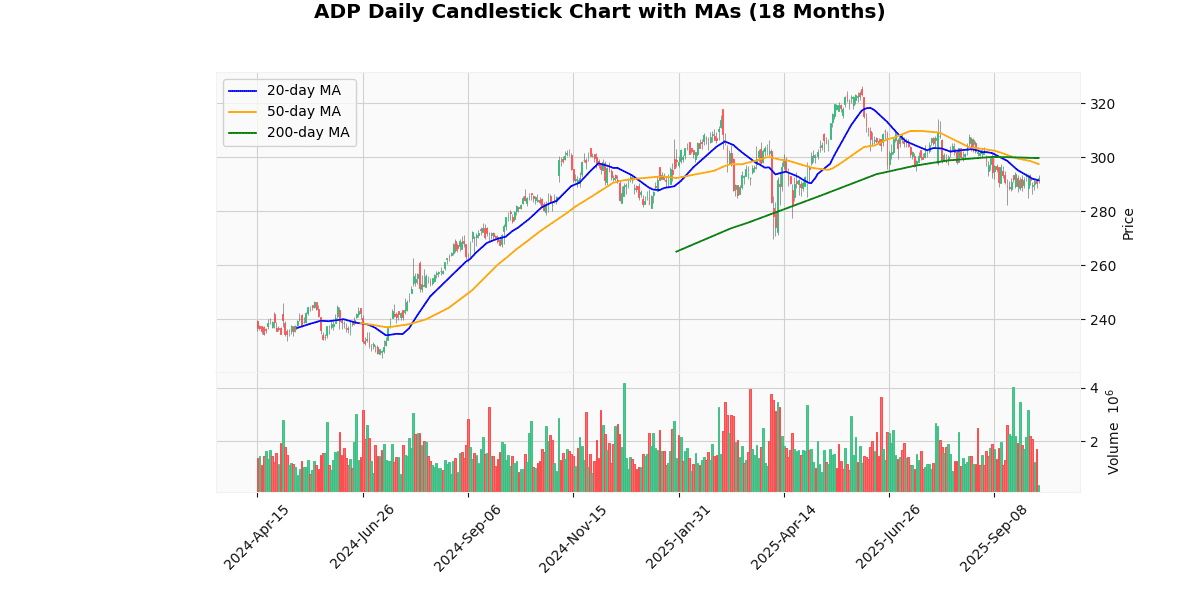
The current price of the asset at $292.17 is slightly above the 20-day moving average (MA20) of $291.43, indicating a potential short-term upward trend or stabilization after recent fluctuations. However, it remains below both the 50-day ($297.52) and 200-day ($299.74) moving averages, suggesting a longer-term bearish trend. The positioning below the MA50 and MA200 could signal that the market sentiment has been negative over the medium to long term, potentially due to underlying economic factors or sector-specific headwinds. Investors might view the recent price near the MA20 as a critical pivot point for determining future movements. If the price can sustain above the MA20, it might attract short-term buyers, but overcoming the resistance posed by the higher moving averages will be crucial for a more definitive bullish reversal.
Recent Ratings
| Date | Status | Outer | Rating | Price |
|---|---|---|---|---|
| 2024-01-17 00:00:00 | Upgrade | BofA Securities | Underperform → Neutral | $217 → $243 |
| 2024-01-04 00:00:00 | Upgrade | Wolfe Research | Underperform → Peer Perform | |
| 2023-11-07 00:00:00 | Initiated | UBS | Neutral | $235 |
| 2023-09-05 00:00:00 | Initiated | RBC Capital Mkts | Sector Perform | $267 |
Costco Wholesale Corp (COST) (0.31%)
Recent News (Last 24 Hours)
Recent news surrounding Costco Wholesale Corporation (NASDAQ: COST) presents a mixed but generally positive outlook that could influence the company’s stock performance. Following the release of its Q4 earnings, analysts at Zacks have raised the question of whether it’s a prudent time to buy Costco stock. This suggests that the earnings results were potentially better than expected, or at least strong enough to warrant investor consideration.
Additionally, broader consumer trends could impact Costco’s business model and stock. Reports from Moneywise highlight a shift in consumer behavior, with younger Americans increasingly turning to warehouse clubs like Costco to manage rising food costs by buying in bulk. This demographic shift could signal a sustained or growing revenue stream for Costco, supporting long-term stock stability and growth.
However, there is some debate about the stock’s valuation, as highlighted by a Motley Fool article questioning if Costco’s stock is too expensive or worth the investment. This indicates a potential concern about overvaluation among investors, which could temper bullish sentiment.
Overall, the combination of strong quarterly results and favorable consumer trends might bolster investor confidence in Costco’s stock, although concerns about valuation suggest a need for careful analysis. Investors should consider both the growth potential through demographic shifts and the current stock valuation to make informed decisions.
Technical Analysis
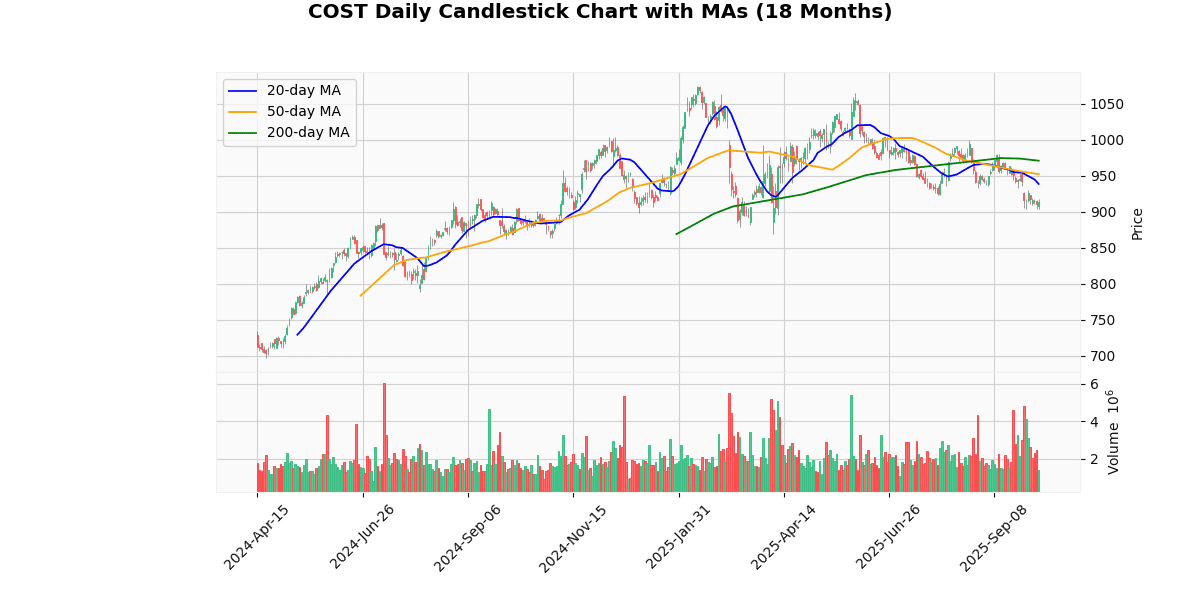
The current price of $914.59 reflects a downward trend as it sits below the 20-day, 50-day, and 200-day moving averages (MAs) of $938.81, $952.43, and $971.01, respectively. This positioning indicates a bearish sentiment in the market over both short and long-term periods. The consistent decrease across these MAs suggests that the asset has been experiencing sustained selling pressure, leading to a gradual decline in its valuation. The significant gap between the current price and the 200-day MA further underscores a potential long-term downtrend. Investors might view this as a cautionary signal, indicating that the asset could face further declines unless a reversal pattern emerges. Market participants should monitor upcoming trading sessions for any signs of stabilization or a potential shift in momentum.
Recent Ratings
| Date | Status | Outer | Rating | Price |
|---|---|---|---|---|
| 2025-09-18 00:00:00 | Resumed | Wolfe Research | Peer Perform | |
| 2025-08-05 00:00:00 | Downgrade | Erste Group | Buy → Hold | |
| 2025-04-11 00:00:00 | Initiated | Mizuho | Neutral | $975 |
| 2024-12-05 00:00:00 | Reiterated | Telsey Advisory Group | Outperform | $1000 → $1050 |
Amazon.com Inc (AMZN) (0.19%)
Recent News (Last 24 Hours)
PayPal’s recent initiative to transform small retailers into advertising platforms akin to Amazon has positively impacted its stock, indicating a strategic expansion in its business model that could diversify revenue streams and enhance shareholder value. Concurrently, Amazon’s resilience against tariff pressures, as noted by Maxim Group’s Tom Forte, suggests a robust operational stance that could reassure investors of its capability to manage external economic challenges effectively.
In the broader tech sector, significant movements include OpenAI’s landmark computing deals surpassing $1 trillion, which underscores the escalating value and influence of AI technologies in global markets. This development could potentially reshape investment landscapes and drive investor interest towards AI-centric companies and technologies.
IBM’s record stock high, following its partnership with Anthropic in AI, signals strong market approval of its strategic direction, potentially increasing its competitive edge in the burgeoning AI sector. This aligns with broader market trends where AI innovations continue to play pivotal roles in shaping investment priorities and stock valuations.
Overall, these developments reflect a dynamic interplay of innovation, strategic corporate actions, and market adaptations that are likely to influence investor decisions and stock performances in the tech and financial sectors.
Technical Analysis
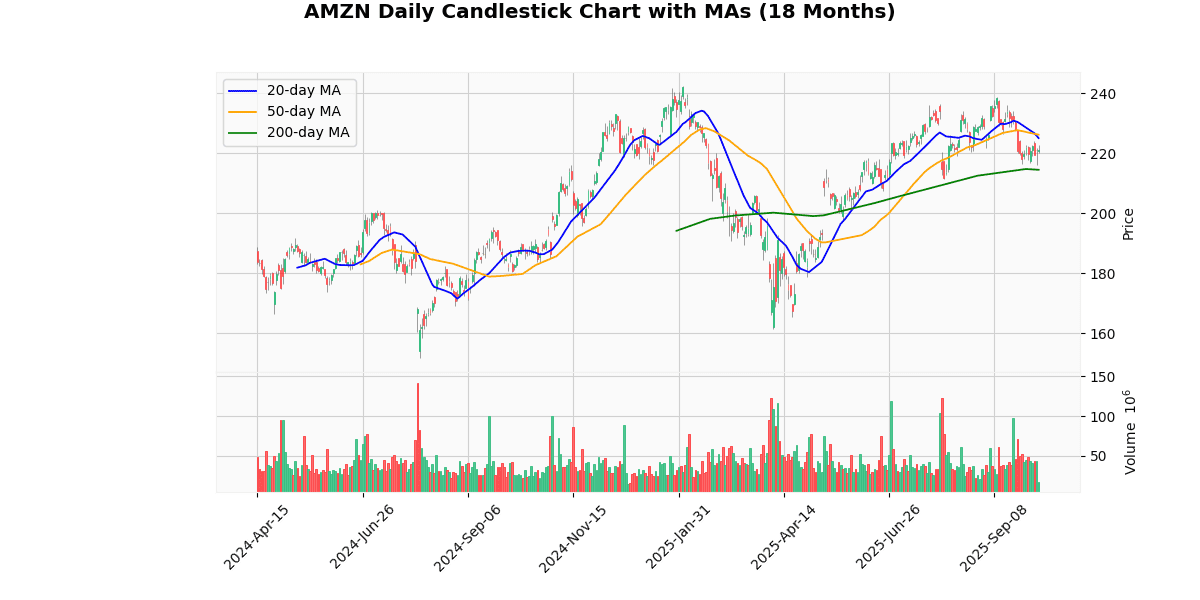
The current price of the asset at $220.79 is positioned below both the 20-day moving average (MA20) of $225.03 and the 50-day moving average (MA50) of $226.15, indicating a short-term bearish trend. This suggests that the asset has been experiencing recent downward pressure, as it trades below the key short-term benchmarks. However, it’s noteworthy that the current price remains above the 200-day moving average (MA200) of $214.47, which signals that the longer-term trend is still bullish. This juxtaposition of short-term decline against a backdrop of long-term growth may point to potential volatility or a period of price consolidation. Investors should monitor if the price will revert to the mean of the longer MA200 or if the short-term downtrend will persist, impacting the longer-term bullish outlook.
Recent Ratings
| Date | Status | Outer | Rating | Price |
|---|---|---|---|---|
| 2025-10-03 00:00:00 | Reiterated | Goldman | Buy | $240 → $275 |
| 2025-09-30 00:00:00 | Initiated | Mizuho | Outperform | $300 |
| 2025-09-24 00:00:00 | Upgrade | Wells Fargo | Equal Weight → Overweight | $280 |
| 2025-09-16 00:00:00 | Reiterated | Truist | Buy | $250 → $270 |
Linde Plc (LIN) (0.11%)
Technical Analysis
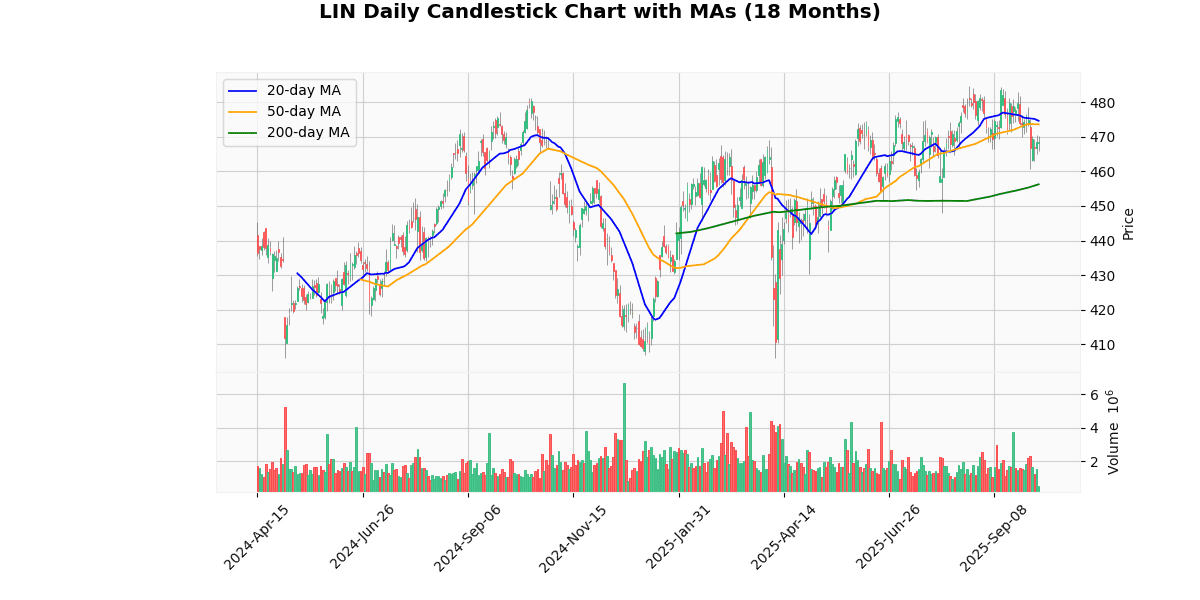
The current price of the asset at $468.43 is positioned below both the 20-day and 50-day moving averages (MA20 at $474.65 and MA50 at $473.61, respectively), indicating a short-term bearish trend as the price has recently declined relative to these averages. However, the price remains above the 200-day moving average (MA200 at $456.25), suggesting that the longer-term trend is still bullish. This positioning reflects a potential consolidation phase or a pullback within a broader uptrend. Investors might view the current dip as a buying opportunity, assuming the price will realign with the longer-term upward trajectory indicated by the MA200. However, caution is warranted as the proximity of the MA20 and MA50 could signal increased volatility or a possible trend reversal if downward pressure continues.
Recent Ratings
| Date | Status | Outer | Rating | Price |
|---|---|---|---|---|
| 2025-06-30 00:00:00 | Upgrade | Citigroup | Neutral → Buy | $535 |
| 2025-06-13 00:00:00 | Initiated | RBC Capital Mkts | Outperform | $576 |
| 2025-01-13 00:00:00 | Upgrade | TD Cowen | Hold → Buy | |
| 2024-04-18 00:00:00 | Upgrade | Mizuho | Neutral → Buy | $510 |
AMGEN Inc (AMGN) (0.08%)
Technical Analysis
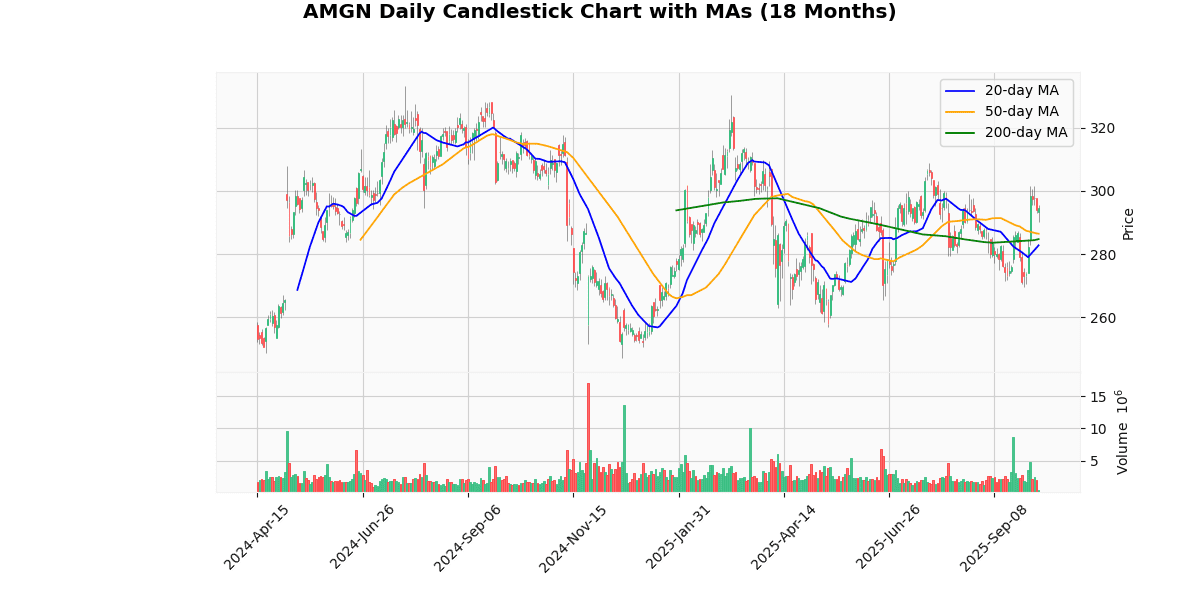
The current price of the asset at $294.33 shows a strong upward trend when compared to its moving averages (MAs) across different time frames. It is trading above the 20-day MA of $282.78, the 50-day MA of $286.48, and the 200-day MA of $284.78. This positioning indicates a bullish momentum in the short, medium, and long term. The fact that the current price exceeds all three MAs suggests that the asset has been consistently gaining value and could be experiencing a robust buying interest from the market. The difference between the MAs and the current price also highlights a potential overextension from recent averages, which might attract traders looking for a continuation of the trend or preparing for a possible reversion if the price adjusts to align more closely with its historical averages.
Recent Ratings
| Date | Status | Outer | Rating | Price |
|---|---|---|---|---|
| 2025-09-03 00:00:00 | Resumed | Raymond James | Mkt Perform | |
| 2025-05-20 00:00:00 | Resumed | Guggenheim | Neutral | $288 |
| 2025-04-22 00:00:00 | Resumed | Cantor Fitzgerald | Neutral | $305 |
| 2024-12-10 00:00:00 | Resumed | BofA Securities | Underperform | $256 |
Verisk Analytics Inc (VRSK) (0.03%)
Recent News (Last 24 Hours)
Jopari Solutions, a leader in electronic healthcare payment and information solutions, has announced a strategic collaboration with Verisk, a data analytics and risk assessment firm, to modernize the medical claims processing system. This partnership, as reported on October 7, 2025, aims to enhance the efficiency and accuracy of medical claims processing through advanced data analytics and technology integration.
The collaboration is expected to positively impact the stock performance of both companies by potentially increasing their market share in the healthcare technology sector. Investors should anticipate possible improvements in revenue streams from new and enhanced service offerings, which could lead to an increase in shareholder value. Additionally, the modernization of claims processing could lead to cost reductions and improved operational efficiencies for healthcare providers, further driving the demand for Jopari and Verisk’s services in the market.
Technical Analysis
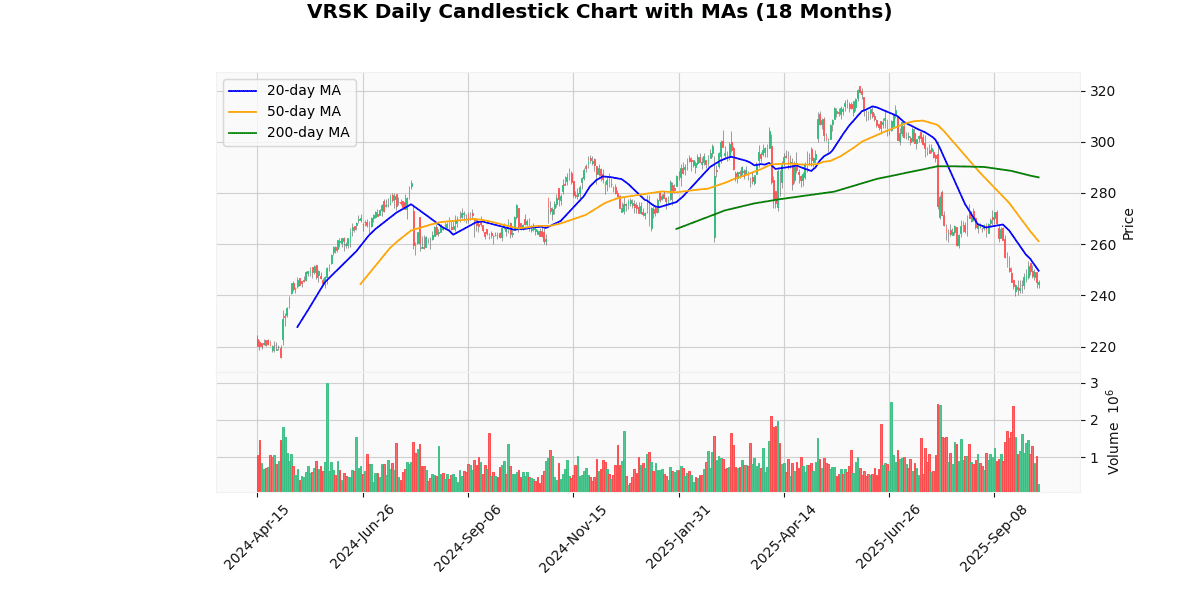
The current price of the asset, at $245.32, is exhibiting a downward trend when analyzed against its moving averages (MAs) across different time frames. Specifically, the price is below the 20-day MA of $249.63, the 50-day MA of $261.13, and significantly below the 200-day MA of $286.07. This positioning suggests a bearish sentiment in the market over both short and long-term periods. The consistent decrease across these MAs indicates that the asset has been losing value steadily, and there has not been a recent reversal strong enough to break this trend. Investors might view these indicators as a signal for potential continued bearish behavior, warranting caution for those considering long positions. Conversely, this could be an opportunity for short sellers or those looking for entry points for a potential rebound, should other market conditions suggest an upcoming change in momentum.
Recent Ratings
| Date | Status | Outer | Rating | Price |
|---|---|---|---|---|
| 2025-10-01 00:00:00 | Initiated | Seaport Research Partners | Buy | $280 |
| 2025-09-03 00:00:00 | Initiated | Wolfe Research | Outperform | $320 |
| 2025-04-10 00:00:00 | Resumed | BofA Securities | Underperform | $280 |
| 2025-01-10 00:00:00 | Downgrade | Barclays | Overweight → Equal Weight | $310 |
Electronic Arts Inc (EA) (-0.09%)
Recent News (Last 24 Hours)
Electronic Arts (EA) has announced a strategic partnership with The Athletic, as detailed in a recent press release on Business Wire dated October 7, 2025. This collaboration aims to leverage The Athletic’s robust journalistic capabilities and EA SPORTS’ extensive gaming technology to captivate and expand their shared audience base, particularly targeting the next generation of sports fans. This partnership is expected to enhance user engagement through integrated content offerings, potentially increasing user retention and attracting new subscribers. For EA, this move is strategically aligned with its efforts to deepen user engagement and expand its market reach within the sports gaming segment. The market may react positively to this news, as the collaboration could drive synergies between content and gaming, potentially boosting EA’s revenue streams and strengthening its position in the competitive sports gaming market. Investors should monitor the early outcomes of this partnership for signs of impact on EA’s financial performance.
Technical Analysis
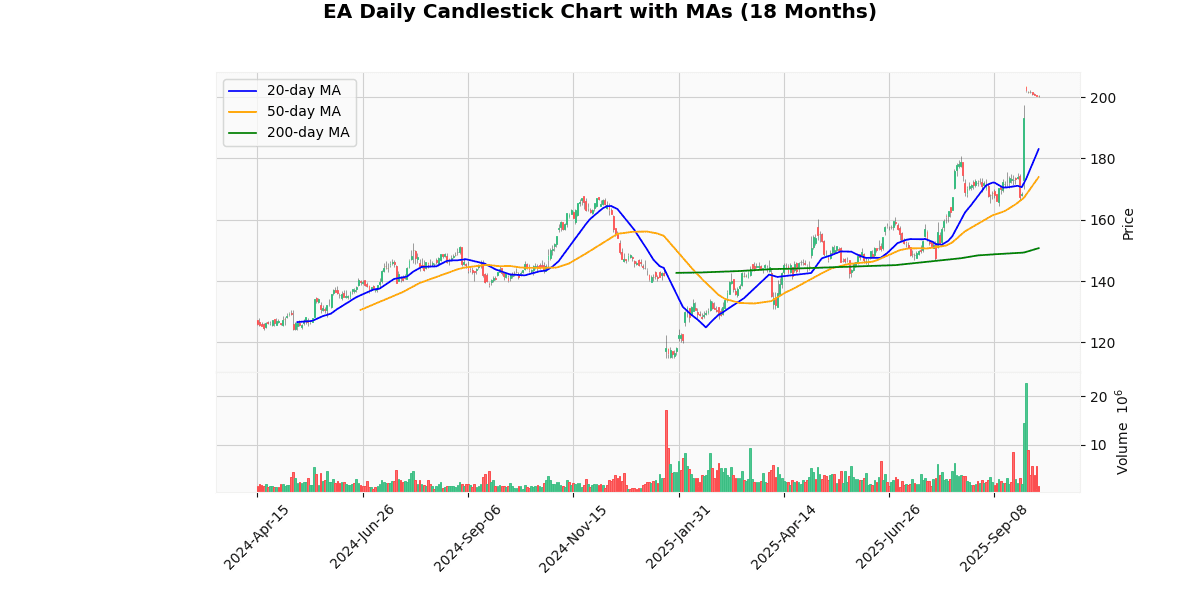
The current price of the asset at $200.25 indicates a robust upward trend when analyzed against its moving averages (MAs). The 20-day MA at $183.03 and the 50-day MA at $173.90 both sit significantly below the current price, suggesting a strong short-term bullish momentum. This is further supported by the 200-day MA at $150.72, which underscores a solid long-term uptrend. The considerable gap between the current price and all three MAs not only highlights the recent price appreciation but also may signal overextension, potentially leading to a pullback or consolidation phase as the market absorbs gains. Investors should monitor for any reversion towards these MAs, which could act as support levels in a corrective phase. Overall, the asset’s market positioning is currently strong, but vigilance is advised given the rapid ascent in price.
Recent Ratings
| Date | Status | Outer | Rating | Price |
|---|---|---|---|---|
| 2025-09-29 00:00:00 | Downgrade | Wedbush | Outperform → Neutral | $200 |
| 2025-08-05 00:00:00 | Upgrade | Arete | Neutral → Buy | $192 |
| 2025-07-28 00:00:00 | Initiated | Wells Fargo | Equal Weight | $168 |
| 2025-06-24 00:00:00 | Upgrade | Roth Capital | Neutral → Buy | $185 |
Worst 10 Performers
KLA Corp (KLAC) (-4.05%)
Recent News (Last 24 Hours)
Recent analyses from Zacks and StockStory have spotlighted KLA Corporation (NASDAQ: KLAC) within the semiconductor equipment sector. Zacks’ latest comparison between Applied Materials (AMAT) and KLA Corporation (KLAC) delves into which stock currently holds a competitive edge in the semiconductor equipment space. This analysis could influence investor sentiment by highlighting key financial metrics, technological advancements, or market share comparisons that may favor one company over the other.
Additionally, a retrospective look by StockStory at the Q2 earnings within the same industry positions KLA Corporation in context with its peers. This review provides investors with a detailed performance benchmark, potentially impacting KLAC’s stock by either reaffirming its market position or highlighting areas of concern relative to competitors.
Both pieces are crucial for investors as they offer insights into KLA Corporation’s standing and performance in a highly competitive sector, potentially affecting its stock’s attractiveness to both current and prospective investors.
Technical Analysis
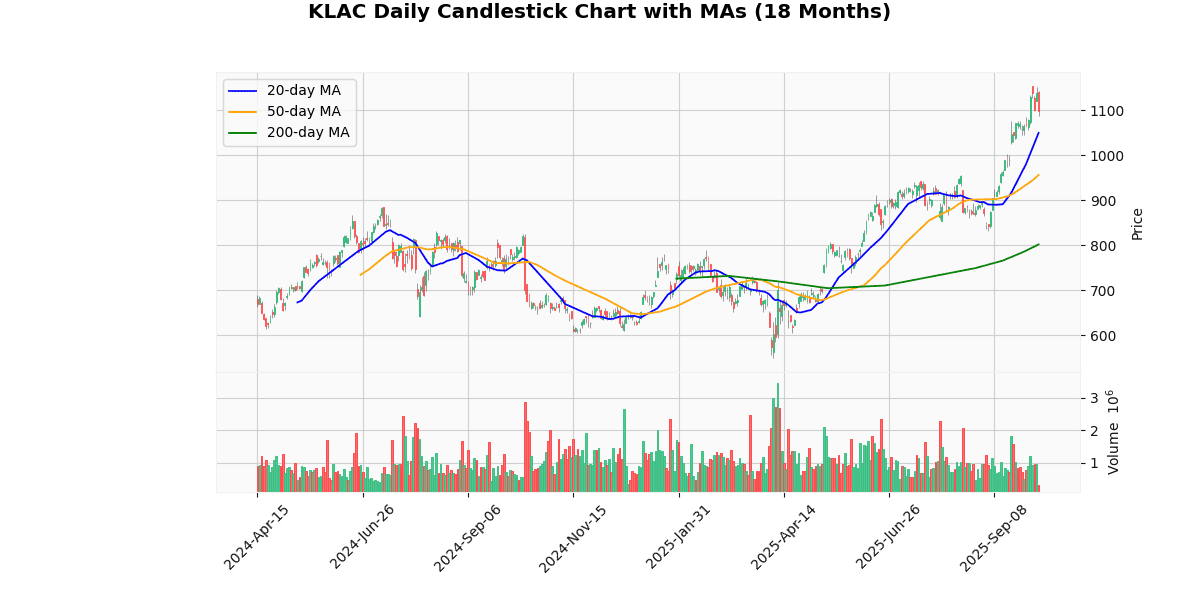
The current price of the asset at $1094.14 indicates a robust upward trend when analyzed against its moving averages (MAs). The 20-day MA at $1049.88, 50-day MA at $956.30, and 200-day MA at $801.99 all suggest a consistent bullish momentum over short, medium, and long-term periods. The significant gap between the current price and these MAs, especially the 200-day MA, highlights strong buyer dominance in recent periods. This positioning above all three key MAs not only reinforces the strength of the current uptrend but also suggests that the asset has substantial support at lower price levels, reducing the risk of a sharp pullback. Investors might view these indicators as a confirmation of continuing market confidence and potential for further price appreciation, barring any major market disruptions.
Recent Ratings
| Date | Status | Outer | Rating | Price |
|---|---|---|---|---|
| 2025-09-22 00:00:00 | Downgrade | Morgan Stanley | Overweight → Equal-Weight | $1093 |
| 2025-08-01 00:00:00 | Reiterated | TD Cowen | Hold | $800 → $900 |
| 2025-07-10 00:00:00 | Initiated | Goldman | Neutral | $980 |
| 2025-07-08 00:00:00 | Downgrade | Wells Fargo | Overweight → Equal Weight | $920 |
Booking Holdings Inc (BKNG) (-3.20%)
Technical Analysis
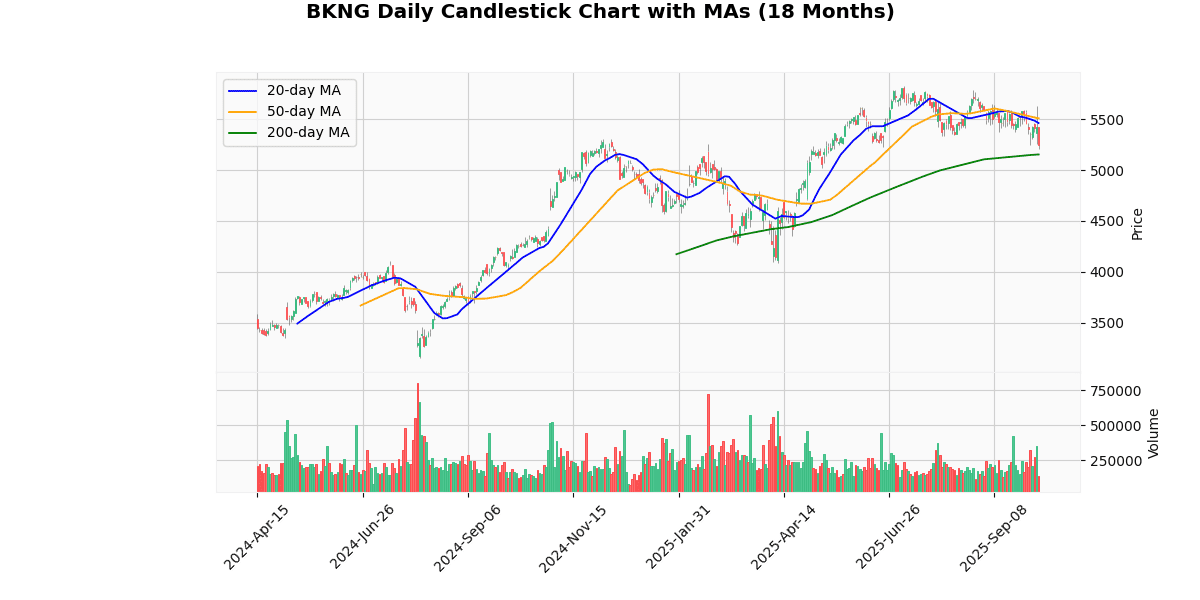
The current price of the asset stands at 5239.01, which is positioned below both the 20-day and 50-day moving averages (MA20 at 5461.43 and MA50 at 5507.43, respectively). This indicates a short-term bearish trend as the price is trading under the levels that represent the average prices over the last 20 and 50 days. However, the asset shows a slightly bullish signal in the longer term, as it is trading above the 200-day moving average (MA200 at 5152.81). This suggests that while the asset has experienced recent downward pressure, its longer-term trajectory over the past several months still shows strength above the 200-day benchmark. Investors might view this as a potential consolidation phase, with the possibility of a rebound if it sustains above the MA200, keeping an eye on resistance near the MA20 and MA50 for future bullish momentum.
Recent Ratings
| Date | Status | Outer | Rating | Price |
|---|---|---|---|---|
| 2025-09-30 00:00:00 | Initiated | Mizuho | Neutral | $5975 |
| 2025-08-05 00:00:00 | Upgrade | Erste Group | Hold → Buy | |
| 2025-07-30 00:00:00 | Downgrade | Wedbush | Outperform → Neutral | $5900 |
| 2025-04-04 00:00:00 | Upgrade | BTIG Research | Neutral → Buy | $5500 |
Autodesk Inc (ADSK) (-2.76%)
Technical Analysis
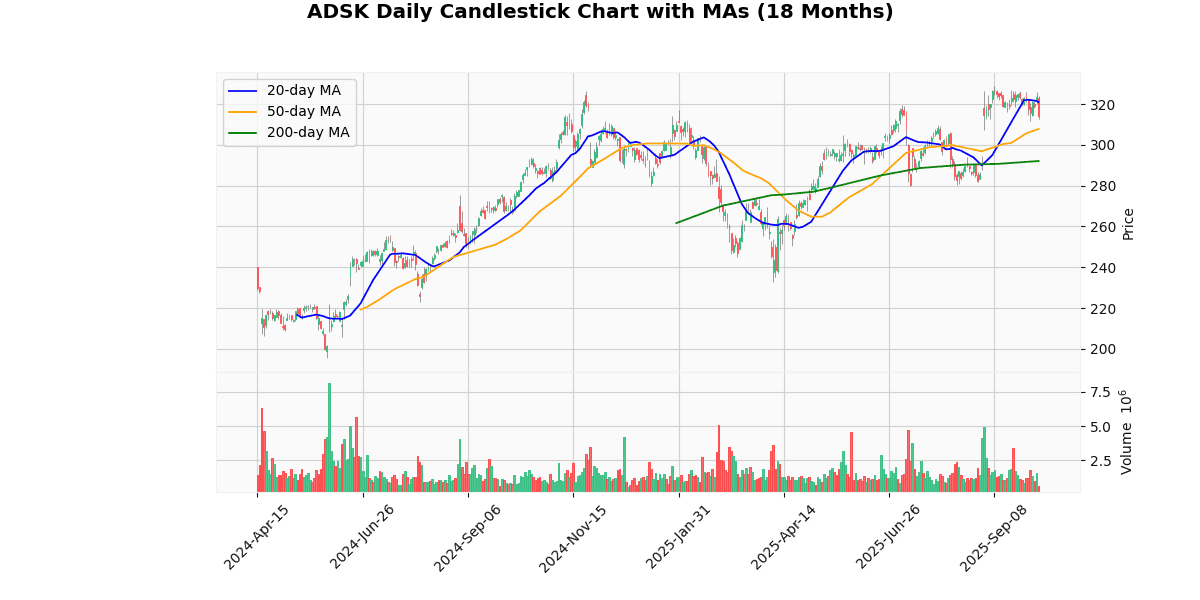
The current price of the asset at 314.2 is positioned below the 20-day moving average (MA20) of 321.03 but above both the 50-day (MA50) and 200-day (MA200) moving averages, which are 307.74 and 292.12, respectively. This indicates a mixed sentiment in the short-term, as the price is experiencing recent downward pressure by trading below the MA20. However, the positioning above the MA50 and MA200 suggests a stronger underlying bullish trend in the medium to long term. The fact that the MA50 is also above the MA200 reinforces this positive outlook, indicating that the longer-term trend has been gaining momentum. Investors might view the current dip as a corrective phase within an overall upward trend, potentially presenting a buying opportunity if the price stabilizes or rebounds above the MA20.
Recent Ratings
| Date | Status | Outer | Rating | Price |
|---|---|---|---|---|
| 2025-10-01 00:00:00 | Upgrade | HSBC Securities | Hold → Buy | $343 |
| 2025-07-21 00:00:00 | Initiated | Loop Capital | Hold | $320 |
| 2025-07-07 00:00:00 | Upgrade | DA Davidson | Neutral → Buy | $375 |
| 2025-06-27 00:00:00 | Upgrade | Berenberg | Hold → Buy | $365 |
Cadence Design Systems Inc (CDNS) (-2.69%)
Recent News (Last 24 Hours)
Sony Corporation has partnered with Smart Eye to develop advanced RGB-IR sensors aimed at enhancing in-vehicle safety systems. This collaboration, announced on October 7, 2025, marks a significant step in integrating sophisticated sensory technology into automotive safety applications. The RGB-IR sensors are expected to improve the functionality and reliability of driver monitoring systems, a critical component in both current and future autonomous vehicles.
The partnership could potentially open up new revenue streams for Sony, leveraging its expertise in sensor technology alongside Smart Eye’s specialized knowledge in automotive applications. This move is likely to enhance Sony’s positioning in the automotive sector, a market with growing demand for advanced safety features driven by increasing regulatory requirements and consumer safety expectations.
Investors should monitor Sony’s stock as this collaboration may lead to increased market share and potentially higher financial returns in the automotive technology segment, reflecting positively on Sony’s overall financial health and stock performance.
Technical Analysis
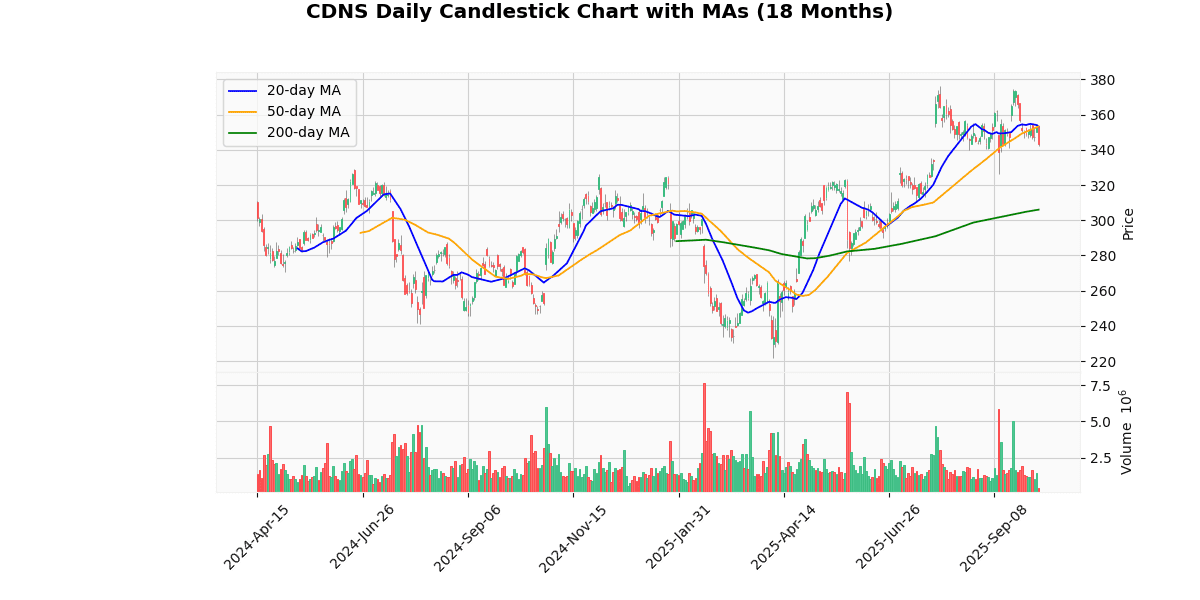
The current price of the asset at $343.42 is trading below both the 20-day and 50-day moving averages (MA), which are nearly identical at $353.18 and $353.29, respectively. This alignment suggests a recent downturn in price, as the asset has slipped below these short-term benchmarks, indicating a potential bearish sentiment in the near term. However, the price remains well above the 200-day MA of $306.02, highlighting a longer-term upward trend despite recent pullbacks. The proximity of the 20-day and 50-day MAs could signal consolidation, but their positioning above the current price points to possible resistance levels that might challenge upward movements. Investors should monitor if the price can reclaim positions above these MAs to confirm any reversal of the current bearish trend.
Recent Ratings
| Date | Status | Outer | Rating | Price |
|---|---|---|---|---|
| 2025-10-02 00:00:00 | Initiated | BNP Paribas Exane | Outperform | $400 |
| 2025-07-29 00:00:00 | Downgrade | Piper Sandler | Overweight → Neutral | $355 |
| 2025-07-10 00:00:00 | Initiated | Goldman | Buy | $380 |
| 2025-04-24 00:00:00 | Upgrade | JP Morgan | Neutral → Overweight | $325 |
DoorDash Inc (DASH) (-2.60%)
Recent News (Last 24 Hours)
In recent financial news, there are several developments that could influence investor sentiment and stock performance. LYFT’s current valuation, described as cheap, poses a question for investors about whether it’s a compelling buy, as reported by Zacks. This could indicate a potential undervaluation, attracting interest if investors believe in the company’s recovery and growth prospects.
Cathie Wood’s recent investment moves, highlighted by Motley Fool, include purchasing shares in three rising stocks. Her track record of identifying high-growth tech stocks could sway market perceptions and drive interest in these stocks, potentially boosting their prices.
Zacks also reported on the performance of computer and technology stocks, specifically questioning if they are lagging behind F5 Networks this year. This could suggest sector-specific challenges or opportunities, influencing related stock movements.
Additionally, a new multi-year partnership between Criteo and DoorDash, as detailed by TipRanks, might impact both companies positively by enhancing operational synergies and market reach, potentially increasing their stock values.
Lastly, TheStreet noted significant movements in stocks including Uber and DoorDash. Such activity often reflects broader market trends or company-specific news that could affect investor decisions.
Overall, these developments provide a mixed outlook, with potential for both positive impacts based on strategic partnerships and investments, and challenges as indicated in sector performance comparisons. Investors should consider these factors in their portfolio decisions.
Technical Analysis
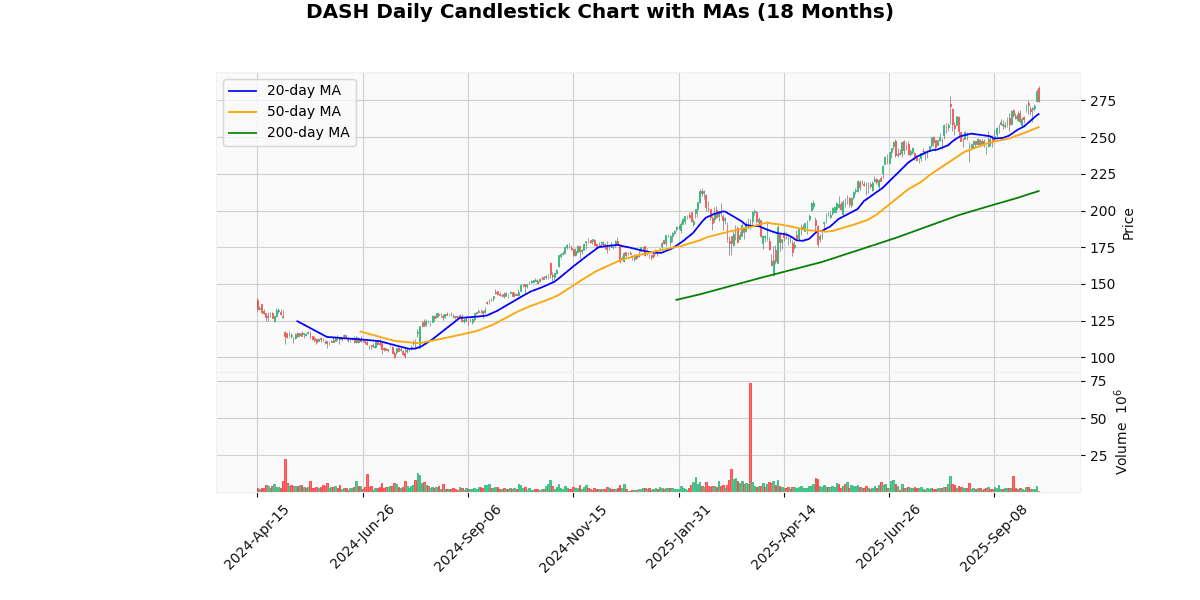
The current price of the asset at $273.86 indicates a robust upward trend when analyzed against its moving averages (MAs). The 20-day MA at $265.61, the 50-day MA at $256.79, and the 200-day MA at $213.30 all reflect a consistent bullish pattern, with the current price positioned well above these key indicators. This suggests a strong short-term, medium-term, and long-term upward momentum. The significant gap between the current price and the 200-day MA underscores a potentially overheated market, hinting at investor optimism that may have driven prices to potentially overvalued territories. Traders might view the divergence from the 200-day MA as a signal for possible corrections or pullbacks, although the market sentiment remains decisively positive. Investors should monitor for any signs of reversal that could follow such steep ascents.
Recent Ratings
| Date | Status | Outer | Rating | Price |
|---|---|---|---|---|
| 2025-09-30 00:00:00 | Initiated | Mizuho | Outperform | $350 |
| 2025-07-15 00:00:00 | Downgrade | Jefferies | Buy → Hold | $250 |
| 2025-07-01 00:00:00 | Reiterated | BTIG Research | Buy | $225 → $265 |
| 2025-06-23 00:00:00 | Upgrade | Raymond James | Outperform → Strong Buy | $260 |
ASML Holding NV (ASML) (-2.48%)
Recent News (Last 24 Hours)
In a recent article published by Motley Fool on October 7, 2025, titled “3 Stocks to Buy as Washington Stalls,” investors are provided with insights into potential stock opportunities amidst legislative gridlock in the U.S. capital. The article identifies three specific stocks that are poised to benefit or remain resilient despite the current political stalemate. This situation often leads to uncertainty in the market, affecting investor sentiment and stock performance. However, the stocks highlighted are considered to have strong fundamentals or are in sectors less susceptible to regulatory changes, making them attractive during times of political indecision. Investors should consider these stocks as potentially stable investments in a volatile environment. The analysis could influence market movements as investors look for safe havens or opportunities to capitalize on the legislative impasse. This recommendation may lead to increased trading volumes and potentially positive price action for the mentioned stocks.
Technical Analysis
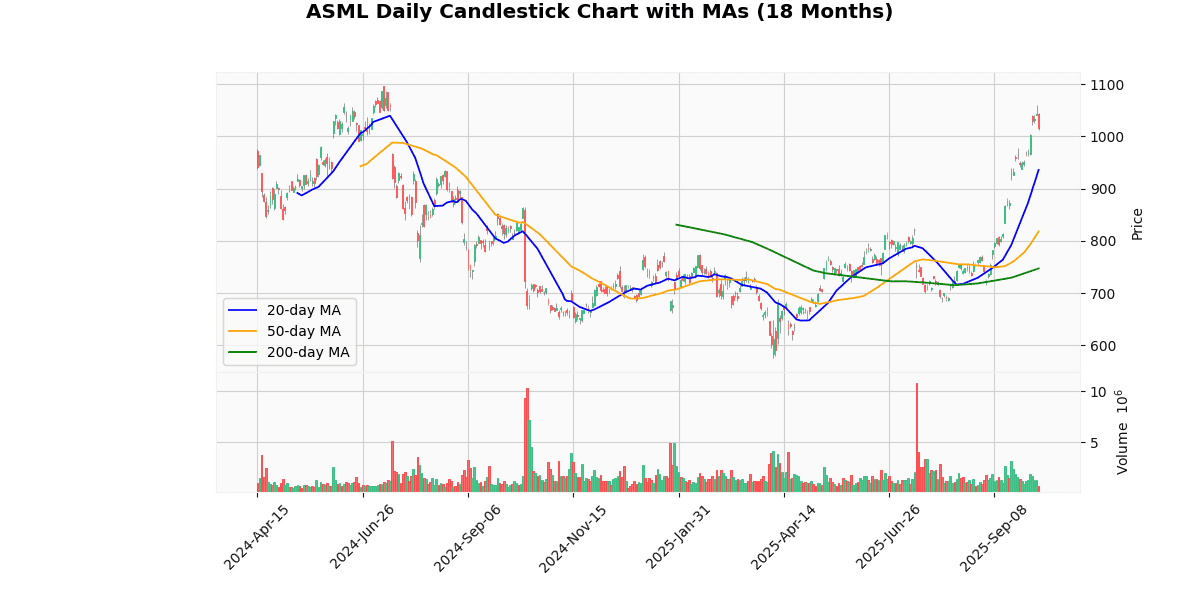
The current price of the asset at $1014.73 exhibits a significant uptrend when analyzed against its moving averages (MAs). The 20-day moving average (MA20) at $935.64, 50-day moving average (MA50) at $817.85, and the 200-day moving average (MA200) at $747.25 all indicate a bullish momentum, with the current price positioned well above these key indicators. This configuration suggests that the asset has been consistently gaining value over the short, medium, and long term. The substantial gap between the current price and the MAs, particularly the MA200, highlights strong buyer confidence and potential market optimism surrounding the asset. Investors might view these trends as robust signals for continued upward movement, although vigilance for any signs of reversal would be prudent due to the accelerated growth.
Recent Ratings
| Date | Status | Outer | Rating | Price |
|---|---|---|---|---|
| 2025-10-06 00:00:00 | Downgrade | New Street | Buy → Neutral | |
| 2025-09-29 00:00:00 | Upgrade | Mizuho | Neutral → Outperform | |
| 2025-09-22 00:00:00 | Upgrade | Morgan Stanley | Equal-Weight → Overweight | |
| 2025-09-22 00:00:00 | Upgrade | Erste Group | Hold → Buy |
Intuit Inc (INTU) (-1.83%)
Technical Analysis
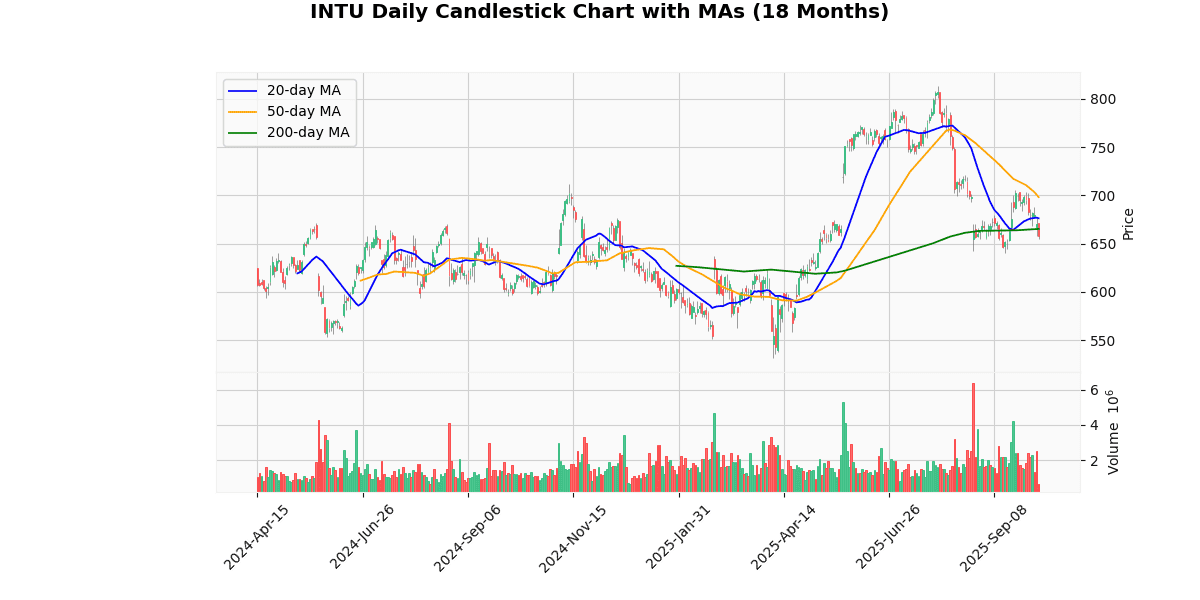
The current price of $657.67 shows a bearish trend when analyzed against the backdrop of the 20-day, 50-day, and 200-day moving averages (MAs). Specifically, the price is trading below all three key MAs: the 20-day MA at $676.23, the 50-day MA at $698.19, and slightly below the 200-day MA at $665.18. This positioning indicates a negative sentiment in the short to medium term, as the price is not only below the shorter duration MAs but also approaching a critical test of the 200-day MA, which is often considered a benchmark for long-term market direction. If the price fails to reclaim higher levels above the 200-day MA, it could reinforce a longer-term downtrend, suggesting a cautious or bearish outlook for the asset.
Recent Ratings
| Date | Status | Outer | Rating | Price |
|---|---|---|---|---|
| 2025-06-26 00:00:00 | Initiated | CLSA | Outperform | $900 |
| 2025-04-23 00:00:00 | Upgrade | HSBC Securities | Hold → Buy | $699 |
| 2025-04-17 00:00:00 | Upgrade | Scotiabank | Sector Perform → Sector Outperform | $700 |
| 2025-03-05 00:00:00 | Upgrade | JP Morgan | Neutral → Overweight | $640 → $660 |
Marriott International Inc (MAR) (-1.79%)
Technical Analysis
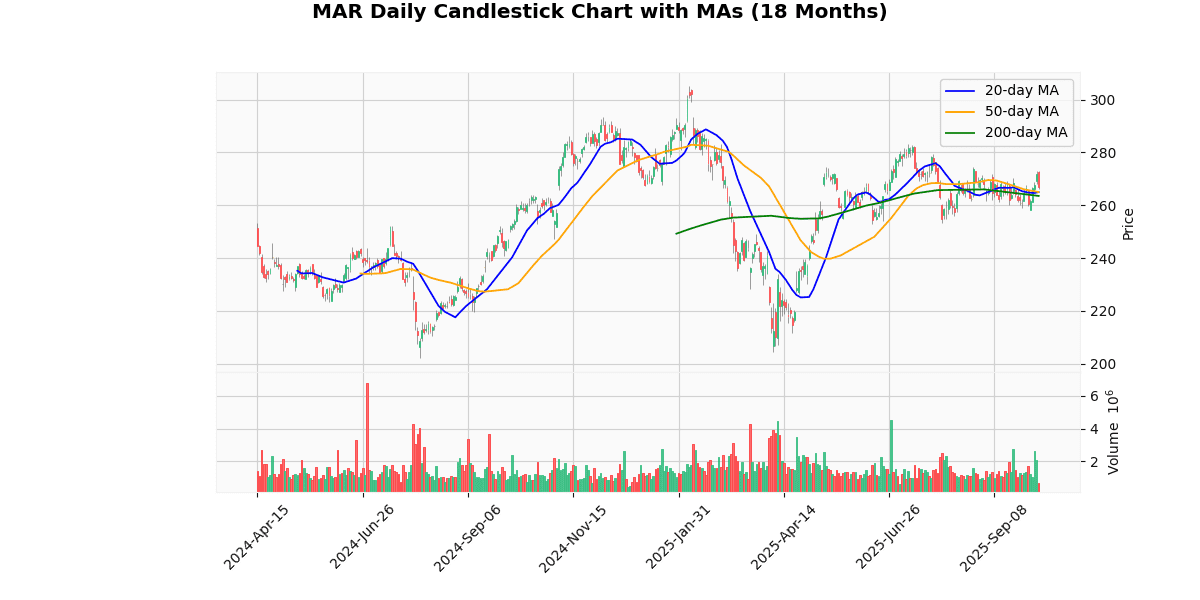
The current price of the asset, standing at $266.67, exhibits a modest uptrend when analyzed against its moving averages (MAs). It is positioned slightly above the 20-day and 50-day MAs, which are nearly identical at $264.96 and $264.98, respectively. This indicates a short-term stabilization in price after recent fluctuations. More significantly, the current price surpasses the 200-day MA of $263.52, suggesting a longer-term bullish sentiment in the market. The proximity of the 20-day and 50-day MAs also points to a potential consolidation phase, where the asset might oscillate around these levels before establishing a clearer direction. Investors should monitor these MAs closely, as a sustained movement above these levels could reinforce further bullish trends, while any dip below might signal a bearish shift.
Recent Ratings
| Date | Status | Outer | Rating | Price |
|---|---|---|---|---|
| 2025-06-23 00:00:00 | Initiated | JP Morgan | Neutral | $284 |
| 2025-05-12 00:00:00 | Upgrade | Jefferies | Hold → Buy | $303 |
| 2025-04-14 00:00:00 | Downgrade | Goldman | Buy → Neutral | $245 |
| 2025-02-04 00:00:00 | Upgrade | Evercore ISI | In-line → Outperform | $330 |
Constellation Energy Corporation (CEG) (-1.74%)
Recent News (Last 24 Hours)
Constellation Energy Corporation (CEG) has been the focus of significant investor interest recently, as highlighted in recent articles by Zacks. The first article, published on October 7, 2025, indicates a surge in searches by investors, suggesting heightened awareness or potential shifts in investor sentiment towards CEG. This could imply an upcoming volatility in stock prices as investors reassess their positions based on new information or market trends.
Furthermore, another article from the same day explores CEG’s strategic expansion into smart EV charging solutions. This move represents a pivotal growth avenue for Constellation Energy, potentially enhancing its market position in the renewable energy sector and aligning with global shifts towards electric vehicles. The focus on innovative technologies in EV charging could drive long-term growth, improve competitive edge, and attract sustainability-focused investments.
Both pieces of news could influence CEG’s stock by potentially increasing investor interest and confidence in the company’s strategic initiatives and market expansion plans.
Technical Analysis
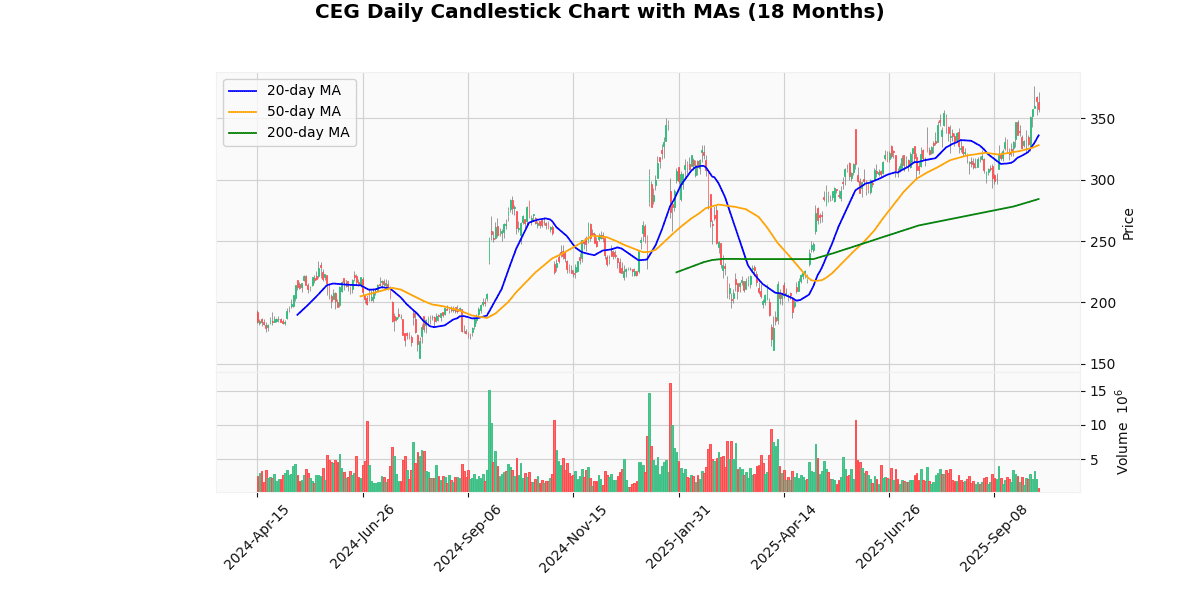
The current price of the asset at $356.93 indicates a robust upward trend when analyzed against its moving averages (MA) across different time frames. The 20-day MA of $336.15 and the 50-day MA of $328.21 both sit significantly below the current price, suggesting a strong short-term bullish momentum. This is further reinforced by the 200-day MA of $284.29, which underscores a solid long-term uptrend. The consistent increase across these MAs indicates that the asset has been performing well over an extended period, and the current price above all three averages suggests that the market sentiment remains positive. Investors might view these metrics as a signal of continued bullish behavior, potentially leading to higher market positioning in anticipation of sustained upward movement.
Recent Ratings
| Date | Status | Outer | Rating | Price |
|---|---|---|---|---|
| 2025-09-22 00:00:00 | Initiated | Scotiabank | Sector Outperform | $401 |
| 2025-08-20 00:00:00 | Initiated | Melius | Buy | $462 |
| 2025-06-13 00:00:00 | Initiated | Raymond James | Outperform | $326 |
| 2025-06-04 00:00:00 | Downgrade | Citigroup | Buy → Neutral | $318 |
Old Dominion Freight Line Inc (ODFL) (-1.55%)
Recent News (Last 24 Hours)
Recent news highlights Old Dominion Freight Line’s continued excellence in the logistics sector, as it has been named the #1 National LTL (Less-Than-Truckload) Carrier for Quality for the 16th consecutive year, according to a report from Business Wire dated October 7, 2025. This accolade underscores the company’s sustained leadership and operational efficiency in a competitive industry. Additionally, a broader survey of LTL carriers, reported by FreightWaves on the same day, positions Old Dominion prominently among top performers in 2025.
The recognition of Old Dominion Freight Line not only enhances its reputation but also likely bolsters investor confidence in its operational capabilities and management’s execution. Such consistent industry leadership is indicative of robust operational frameworks and customer service excellence, potentially translating into sustained revenue growth and profitability. This could positively impact the stock as investors might view the company’s market position and stability as a favorable investment opportunity amidst a volatile economic landscape.
Technical Analysis
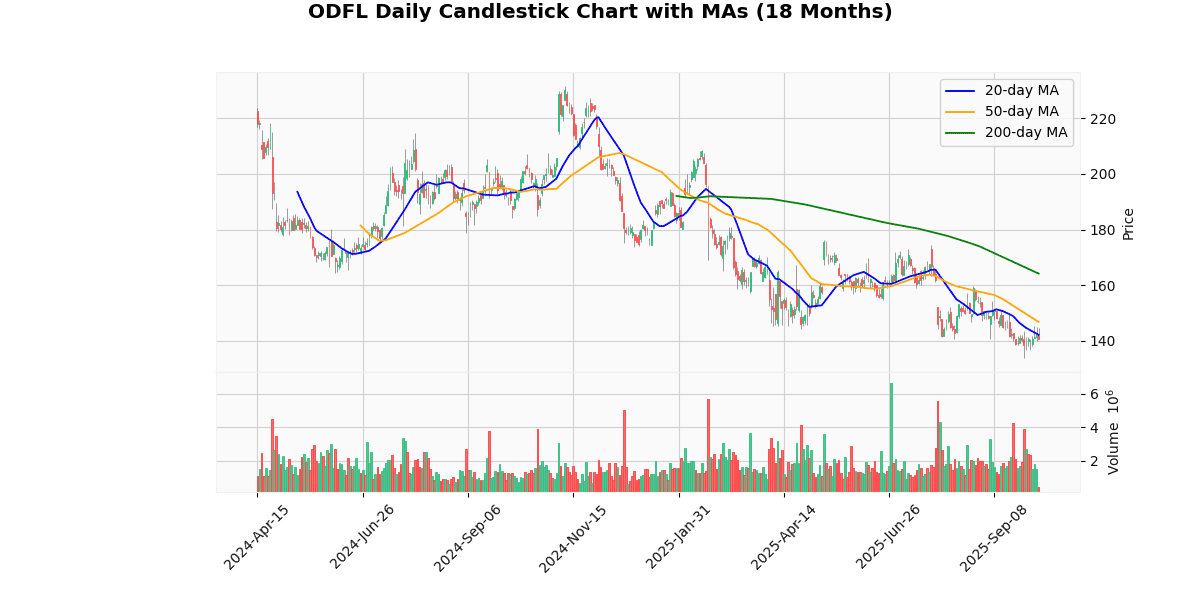
The current price of the asset at $140.62 indicates a downward trend when analyzed against its moving averages (MAs). Specifically, the price is below the 20-day MA of $142.13, the 50-day MA of $146.8, and significantly lower than the 200-day MA of $164.18. This positioning suggests a bearish sentiment in the short to medium term, as the price is not only below the short-term MA but also the longer-term 200-day MA, indicating sustained negative momentum. The gap between the current price and the 200-day MA is particularly notable, underscoring a potentially deeper correction or a longer-term downtrend. Investors might view this as a signal to exercise caution, considering potential further declines or waiting for signs of stabilization before entering positions.
Recent Ratings
| Date | Status | Outer | Rating | Price |
|---|---|---|---|---|
| 2025-07-31 00:00:00 | Upgrade | Vertical Research | Hold → Buy | $170 |
| 2025-07-31 00:00:00 | Reiterated | TD Cowen | Hold | $166 → $159 |
| 2025-07-01 00:00:00 | Resumed | Robert W. Baird | Neutral | $164 |
| 2025-06-02 00:00:00 | Upgrade | Goldman | Neutral → Buy | $200 |
Disclaimer
The content on MarketsFN.com is provided for educational and informational purposes only. It does not constitute financial advice, investment recommendations, or trading guidance. All investments involve risks, and past performance does not guarantee future results. You are solely responsible for your investment decisions and should conduct independent research and consult a qualified financial advisor before acting. MarketsFN.com and its authors are not liable for any losses or damages arising from your use of this information.


