US Indices Rise, NASDAQ100 Leads Gains
DJIA Technical Analysis
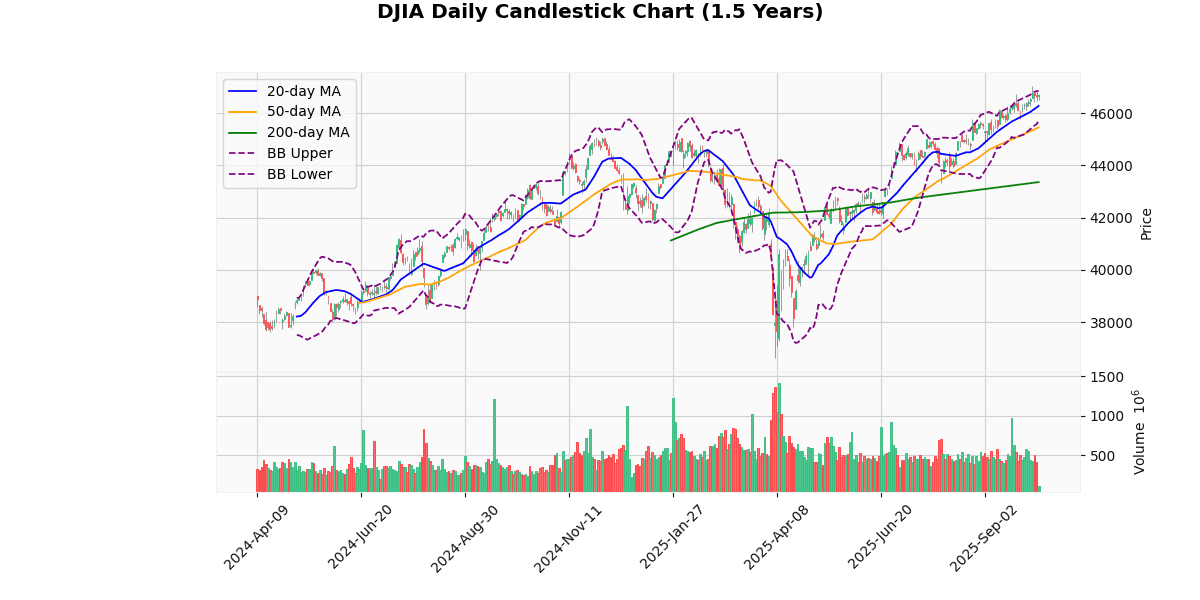
The DJIA is currently priced at 46,701.65, showing a modest increase of 0.21% today. This performance places the index above its 20-day (46,274.12), 50-day (45,448.86), and 200-day (43,358.38) moving averages, indicating a strong bullish trend over the short, medium, and long term. The price is near the upper Bollinger Band (46,852.95), suggesting that the index is approaching a potential resistance level.
The Relative Strength Index (RSI) at 65.43 indicates that the index is nearing overbought territory but is not there yet, suggesting there might still be some room for upward movement before any significant pullback. The Moving Average Convergence Divergence (MACD) at 339.87 with a signal line at 337.34 shows a recent bullish crossover, reinforcing the current upward momentum.
The index is currently trading close to its 3-day high of 46,868.49 and significantly above its 3-day low of 46,426.96. This indicates sustained buying interest in the market. The proximity to the 52-week and year-to-date high of 47,049.64 (only 0.74% away) suggests that the index is testing critical resistance levels.
The Average True Range (ATR) of 369.68 points to moderate daily volatility, which is consistent with the index’s recent movements and the broader market environment.
In summary, the DJIA exhibits a strong bullish trend with potential resistance near the upper Bollinger Band and the 52-week high. The MACD indicates continued bullish momentum, while the RSI suggests careful monitoring as it approaches overbought levels. Investors should watch for potential pullbacks or consolidations if the index reaches or surpasses its recent highs.
Technical Metrics
| Metric | Value |
|---|---|
| Current Price | 46701.65 |
| Today’s Change (%) | 0.21 |
| 20-day MA | 46274.12 |
| % from 20-day MA | 0.92 |
| 50-day MA | 45448.86 |
| % from 50-day MA | 2.76 |
| 200-day MA | 43358.38 |
| % from 200-day MA | 7.71 |
| Bollinger Upper | 46852.95 |
| % from BB Upper | -0.32 |
| Bollinger Lower | 45695.30 |
| % from BB Lower | 2.20 |
| RSI (14) | 65.43 |
| MACD | 339.87 |
| MACD Signal | 337.34 |
| 3-day High | 46868.49 |
| % from 3-day High | -0.36 |
| 3-day Low | 46426.96 |
| % from 3-day Low | 0.59 |
| 52-week High | 47049.64 |
| % from 52-week High | -0.74 |
| 52-week Low | 36611.78 |
| % from 52-week Low | 27.56 |
| YTD High | 47049.64 |
| % from YTD High | -0.74 |
| YTD Low | 36611.78 |
| % from YTD Low | 27.56 |
| ATR (14) | 369.68 |
The technical outlook for the DJIA presents a generally bullish sentiment as evidenced by its current position relative to key indicators. The index is trading above its 20-day, 50-day, and 200-day moving averages, indicating a strong upward trend over both short and long-term periods. The current price is near the upper Bollinger Band, suggesting that the market is in a higher trading range, though it is slightly below the recent 3-day and 52-week highs, indicating some resistance near these levels.
The Relative Strength Index (RSI) at 65.43 points towards a somewhat overbought condition but does not yet signal a major reversal, allowing room for potential further gains. The MACD is above its signal line, reinforcing the bullish momentum. The Average True Range (ATR) reflects moderate volatility, supporting the possibility of continued price movements within the current trend.
Key support and resistance levels to watch are the recent 3-day low at 46426.96 and the 52-week high at 47049.64, respectively. The proximity to these levels suggests that the index might consolidate before attempting to break the recent highs. Overall, market sentiment appears optimistic, with technical indicators supporting the likelihood of sustained upward movement, albeit with caution around potential volatility and slight overbought conditions.
S&P500 Technical Analysis
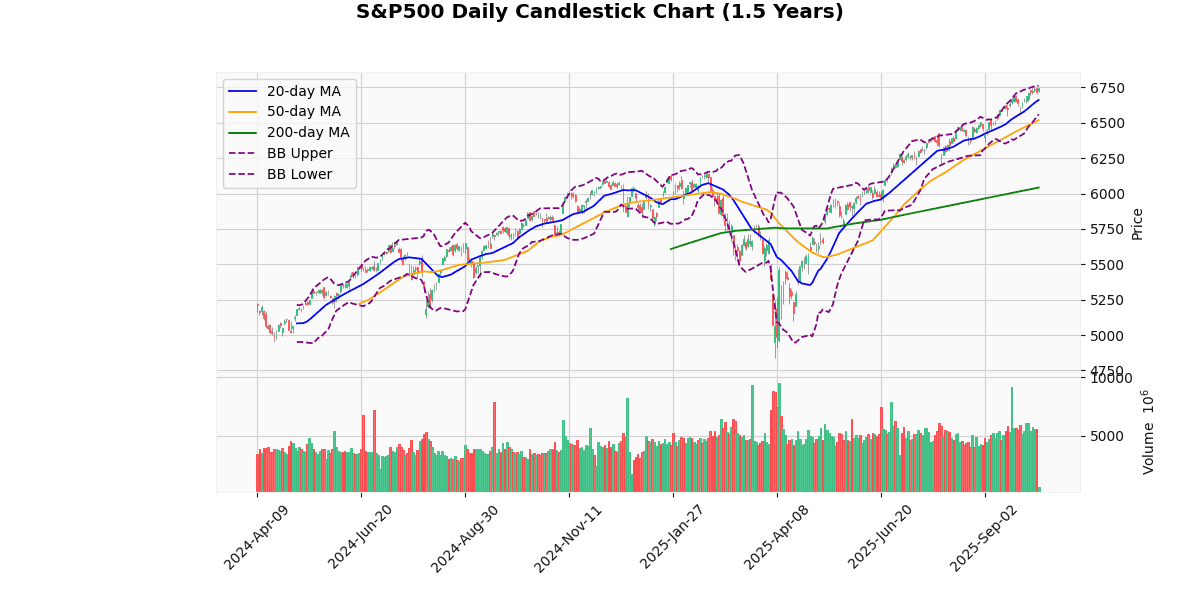
The S&P 500 is currently priced at 6744.51, marking a modest increase of 0.45% today. This movement places the index near its 52-week and year-to-date high of 6754.49, indicating strong recent performance.
Analyzing the moving averages, the index is positioned above all key averages: 20-day (6660.95), 50-day (6517.93), and 200-day (6042.01). This configuration suggests a robust upward trend, with the index showing a significant 11.63% increase over the 200-day moving average, highlighting a bullish long-term sentiment.
The Bollinger Bands reveal the current price is nearing the upper band (6762.24), which typically signals high price levels relative to recent volatility. The proximity to the upper band, combined with an RSI of 69, suggests the index might be approaching overbought territory, although it is not yet beyond the typical overbought threshold of 70.
The MACD value of 63.6, slightly above its signal line at 63.11, supports the momentum seen in the upward price movement. This slight divergence indicates continued bullish momentum but warrants monitoring for potential pullbacks if the MACD starts to converge with its signal line.
The Average True Range (ATR) at 47.46 points to a relatively stable volatility level, consistent with the narrow range between the 3-day high (6754.49) and low (6699.96).
In summary, the S&P 500 shows strong bullish signals with its price above all major moving averages and near the upper Bollinger Band. However, investors should be cautious of potential overbought conditions as indicated by the high RSI and the proximity to the 52-week high. The near-term outlook remains positive, but vigilance is advised for signs of reversal, especially if the RSI crosses above 70 or the MACD converges with its signal line.
Technical Metrics
| Metric | Value |
|---|---|
| Current Price | 6744.51 |
| Today’s Change (%) | 0.45 |
| 20-day MA | 6660.95 |
| % from 20-day MA | 1.25 |
| 50-day MA | 6517.93 |
| % from 50-day MA | 3.48 |
| 200-day MA | 6042.01 |
| % from 200-day MA | 11.63 |
| Bollinger Upper | 6762.24 |
| % from BB Upper | -0.26 |
| Bollinger Lower | 6559.65 |
| % from BB Lower | 2.82 |
| RSI (14) | 69.00 |
| MACD | 63.60 |
| MACD Signal | 63.11 |
| 3-day High | 6754.49 |
| % from 3-day High | -0.15 |
| 3-day Low | 6699.96 |
| % from 3-day Low | 0.66 |
| 52-week High | 6754.49 |
| % from 52-week High | -0.15 |
| 52-week Low | 4835.04 |
| % from 52-week Low | 39.49 |
| YTD High | 6754.49 |
| % from YTD High | -0.15 |
| YTD Low | 4835.04 |
| % from YTD Low | 39.49 |
| ATR (14) | 47.46 |
The S&P 500 index exhibits a bullish technical outlook as it currently trades above all key moving averages (20-day, 50-day, and 200-day), suggesting a strong upward trend over short, medium, and long-term periods. The index’s current price is slightly below the upper Bollinger Band, indicating it is approaching potentially overbought territory but has not yet exceeded typical volatility boundaries. This is further supported by the Relative Strength Index (RSI) at 69, nearing the overbought threshold of 70, which could signal a pause or pullback in the near term.
The MACD value is above its signal line, reinforcing the bullish momentum, although the proximity of the two values suggests that momentum might be stabilizing rather than accelerating. The Average True Range (ATR) of 47.46 points to moderate current volatility, aligning with the index’s recent price fluctuations.
Key resistance is near the recent 52-week and year-to-date high at 6754.49, while support may be found at the lower Bollinger Band around 6559.65, and further at the 20-day moving average of 6660.95. Given the proximity to all-time highs and strong performance relative to moving averages, market sentiment appears optimistic, though caution is warranted near resistance levels due to potential overbought conditions.
NASDAQ100 Technical Analysis
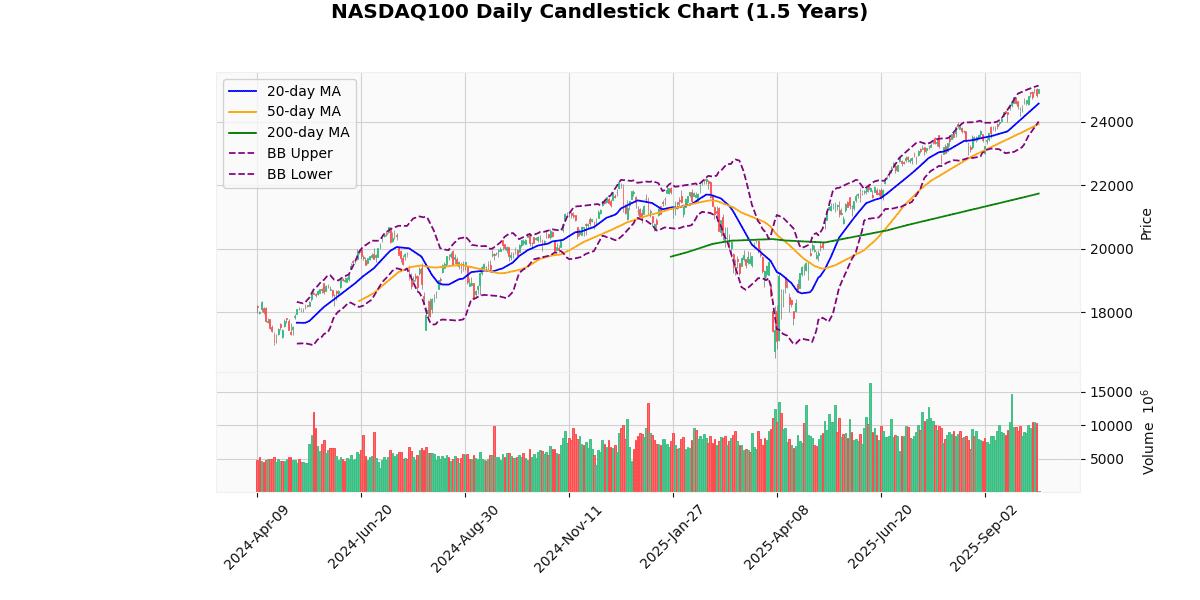
The NASDAQ100 index currently stands at 25,015.03, marking a 0.7% increase today. This performance is underscored by its position relative to several key moving averages, indicating a strong bullish trend. The index is trading above its 20-day (24,565.39), 50-day (23,918.49), and 200-day (21,731.26) moving averages, with respective percentage differences of 1.83%, 4.58%, and 15.11%. This suggests sustained upward momentum over short, medium, and long-term periods.
The Bollinger Bands provide additional insights, with the current price nearing the upper band at 25,129.73, which often acts as a resistance level. The proximity to the upper band, combined with a relatively high RSI of 68.37, hints at a potentially overbought condition, signaling caution for possible pullbacks or consolidation in the near term.
The MACD value of 312.05, positioned above its signal line at 304.03, supports the bullish momentum, indicating that the upward trend is still in place. However, the closeness of these two values suggests that the momentum might be slowing, and traders should watch for a potential bearish crossover as a signal for a trend reversal.
The index’s recent trading range is defined by a 3-day high of 25,062.96 and a 3-day low of 24,783.95, with the current price slightly below the 3-day high by 0.19%. This proximity to its 52-week and YTD highs also at 25,062.96 underscores the index’s strong performance this year, rallying significantly from its YTD low of 16,542.2.
Lastly, the Average True Range (ATR) of 236.44 points to a relatively high level of volatility, which could mean larger price swings and thus opportunities for traders. In summary, while the NASDAQ100 shows strong bullish signs, indicators like the RSI and the proximity to the upper Bollinger Band suggest vigilance for signs of overbought conditions or potential trend reversals.
Technical Metrics
| Metric | Value |
|---|---|
| Current Price | 25015.03 |
| Today’s Change (%) | 0.70 |
| 20-day MA | 24565.39 |
| % from 20-day MA | 1.83 |
| 50-day MA | 23918.49 |
| % from 50-day MA | 4.58 |
| 200-day MA | 21731.26 |
| % from 200-day MA | 15.11 |
| Bollinger Upper | 25129.73 |
| % from BB Upper | -0.46 |
| Bollinger Lower | 24001.06 |
| % from BB Lower | 4.22 |
| RSI (14) | 68.37 |
| MACD | 312.05 |
| MACD Signal | 304.03 |
| 3-day High | 25062.96 |
| % from 3-day High | -0.19 |
| 3-day Low | 24783.95 |
| % from 3-day Low | 0.93 |
| 52-week High | 25062.96 |
| % from 52-week High | -0.19 |
| 52-week Low | 16542.20 |
| % from 52-week Low | 51.22 |
| YTD High | 25062.96 |
| % from YTD High | -0.19 |
| YTD Low | 16542.20 |
| % from YTD Low | 51.22 |
| ATR (14) | 236.44 |
The NASDAQ100 index shows a robust technical outlook as it trades above all key moving averages (MA20, MA50, MA200), indicating a strong bullish trend over short, medium, and long-term periods. The current price of 25015.03 is near the upper Bollinger Band and just below the 52-week and year-to-date highs, suggesting a potential resistance level around 25062.96. The proximity to this high could signal a consolidation or minor pullback in the near term.
The Relative Strength Index (RSI) at 68.37 is approaching overbought territory, which might caution bullish investors about potential price stabilization or reversal. However, the MACD value above its signal line supports the continuation of the upward momentum.
Volatility, as measured by the Average True Range (ATR), remains relatively high, indicating that significant price movements are still possible. This could lead to increased trading opportunities but also higher risk.
Support levels might be found near the lower Bollinger Band at 24001.06 and further down at the MA20 at 24565.39. Given the index’s performance and current metrics, market sentiment appears optimistic, but traders should remain vigilant for signs of reversal, especially with the RSI nearing overbought levels.
RUSSELL2000 Technical Analysis
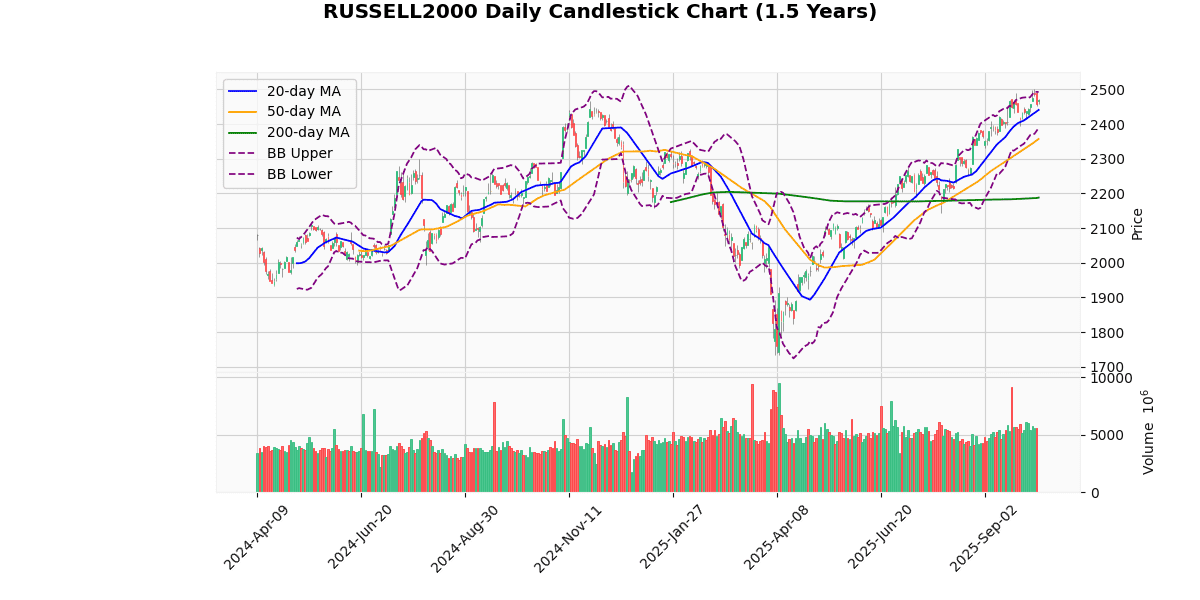
The Russell 2000 index is currently priced at 2469.35, reflecting a modest increase of 0.44% today. This performance is indicative of a positive short-term trend as the index is trading above its 20-day (2440.73), 50-day (2357.02), and 200-day (2187.94) moving averages, suggesting sustained upward momentum over these periods.
The index’s proximity to its upper Bollinger Band (2492.61) and a recent 3-day high of 2501.92, which also aligns with the 52-week and YTD high, indicates that the index is testing resistance levels. The Bollinger Bands show a normal width, which suggests moderate volatility.
The Relative Strength Index (RSI) at 61.79 is leaning towards the upper end of the neutral range, nearing overbought territory but not yet signaling a strong reversal risk. This is supported by the Moving Average Convergence Divergence (MACD) at 30.07, which is slightly below its signal line at 31.89, indicating a potential slowdown in the bullish momentum or a consolidation phase.
The Average True Range (ATR) of 29.71 points to a relatively stable volatility level consistent with recent price movements. The index’s performance above its moving averages, particularly the significant 12.86% above the 200-day moving average, underscores a robust longer-term bullish trend.
In summary, the Russell 2000 is exhibiting strong bullish signals across several time frames, though approaching resistance levels and a potential MACD crossover suggest investors should watch for signs of consolidation or mild pullbacks. The current setup may offer opportunities for tactical entries, especially if the index retraces to lower Bollinger Band or moving average support levels.
Technical Metrics
| Metric | Value |
|---|---|
| Current Price | 2469.35 |
| Today’s Change (%) | 0.44 |
| 20-day MA | 2440.73 |
| % from 20-day MA | 1.17 |
| 50-day MA | 2357.02 |
| % from 50-day MA | 4.77 |
| 200-day MA | 2187.94 |
| % from 200-day MA | 12.86 |
| Bollinger Upper | 2492.61 |
| % from BB Upper | -0.93 |
| Bollinger Lower | 2388.85 |
| % from BB Lower | 3.37 |
| RSI (14) | 61.79 |
| MACD | 30.07 |
| MACD Signal | 31.89 |
| 3-day High | 2501.92 |
| % from 3-day High | -1.30 |
| 3-day Low | 2451.31 |
| % from 3-day Low | 0.74 |
| 52-week High | 2501.92 |
| % from 52-week High | -1.30 |
| 52-week Low | 1732.99 |
| % from 52-week Low | 42.49 |
| YTD High | 2501.92 |
| % from YTD High | -1.30 |
| YTD Low | 1732.99 |
| % from YTD Low | 42.49 |
| ATR (14) | 29.71 |
The technical outlook for the Russell 2000 index suggests a bullish trend, as indicated by its current price of 2469.35, which is above all key moving averages (MA20 at 2440.73, MA50 at 2357.02, and MA200 at 2187.94). This positioning above the moving averages underscores a strong upward momentum over short, medium, and long-term periods.
The index is trading near the upper Bollinger Band (2492.61), suggesting that it is approaching overbought territory, although it has not breached this level yet. The Relative Strength Index (RSI) at 61.79 further supports this, indicating a moderately strong buying momentum without yet reaching overextended levels. The MACD (30.07) is slightly below its signal line (31.89), hinting at a potential slowdown in the bullish momentum or a consolidation phase.
Volatility, as measured by the Average True Range (ATR), stands at 29.71, which is relatively high, reflecting ongoing market fluctuations and uncertainty.
Key support and resistance levels to watch include the recent 3-day low at 2451.31 and the 52-week high at 2501.92, respectively. The proximity to the 52-week high suggests that breaking this level could lead to new highs, while a drop below recent support levels might indicate a short-term pullback.
Overall, market sentiment appears positive, but traders should be cautious of potential volatility and signs of reversal as the index tests critical resistance levels.


