Asian Indices Rise
Shanghai Composite Technical Analysis
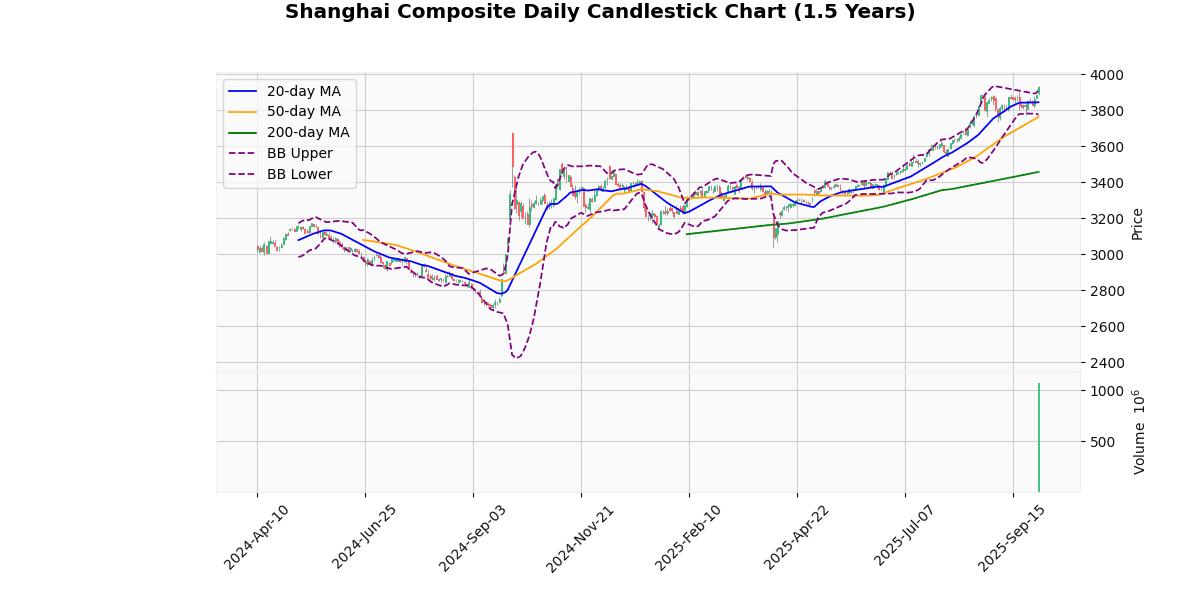
The Shanghai Composite Index currently stands at 3930.24, marking a 1.22% increase today. This level is notably close to its 52-week and year-to-date high of 3936.58, indicating a strong upward momentum.
Analyzing the moving averages, the index is performing well above its 20-day (3844.11), 50-day (3762.55), and 200-day (3457.05) moving averages. These figures suggest a robust bullish trend over short, medium, and long-term periods. The gaps between the current price and these averages (2.24%, 4.46%, and 13.69% respectively) further reinforce the strength of the current uptrend.
The Bollinger Bands show the index just above the upper band (3913.73), which typically signals an overextended market condition that might prompt a short-term pullback or consolidation. However, the width between the upper and lower bands (3774.48) suggests volatility is relatively high, supporting potential continued price movements.
The Relative Strength Index (RSI) at 66.89 is approaching the overbought threshold of 70, which could indicate a slowing of the upward momentum or a potential reversal if it crosses above this level. Meanwhile, the MACD at 31.59 is just below its signal line (31.78), suggesting a possible loss of bullish momentum or a forthcoming bearish crossover.
The Average True Range (ATR) of 45.08 points to a moderately volatile environment, which is consistent with the observed price movements and Bollinger Band width.
Considering the proximity to its 52-week and YTD highs, and the current technical indicators, investors should watch for potential resistance near these levels. Any pullback could find support at lower Bollinger Band or moving averages, particularly the 20-day MA. The near-term market direction could hinge on whether the RSI crosses into overbought territory and how the MACD behaves relative to its signal line.
Technical Metrics
| Metric | Value |
|---|---|
| Current Price | 3930.24 |
| Today’s Change (%) | 1.22 |
| 20-day MA | 3844.11 |
| % from 20-day MA | 2.24 |
| 50-day MA | 3762.55 |
| % from 50-day MA | 4.46 |
| 200-day MA | 3457.05 |
| % from 200-day MA | 13.69 |
| Bollinger Upper | 3913.73 |
| % from BB Upper | 0.42 |
| Bollinger Lower | 3774.48 |
| % from BB Lower | 4.13 |
| RSI (14) | 66.89 |
| MACD | 31.59 |
| MACD Signal | 31.78 |
| 3-day High | 3936.58 |
| % from 3-day High | -0.16 |
| 3-day Low | 3809.53 |
| % from 3-day Low | 3.17 |
| 52-week High | 3936.58 |
| % from 52-week High | -0.16 |
| 52-week Low | 2717.95 |
| % from 52-week Low | 44.60 |
| YTD High | 3936.58 |
| % from YTD High | -0.16 |
| YTD Low | 3040.69 |
| % from YTD Low | 29.25 |
| ATR (14) | 45.08 |
The Shanghai Composite Index presents a bullish technical outlook as it trades above all key moving averages (MA20, MA50, MA200), indicating a strong upward trend over short, medium, and long-term periods. The index’s current price of 3930.24 is positioned above the upper Bollinger Band (3913.73), suggesting that it may be entering overbought territory. This is further supported by the Relative Strength Index (RSI) at 66.89, nearing the overbought threshold of 70.
The MACD (31.59) is almost in line with its signal (31.78), indicating a potential leveling off of momentum, which could suggest a consolidation or slight pullback in the near term. The Average True Range (ATR) at 45.08 points to moderate volatility, which is consistent with the recent price movements and the proximity to the 52-week and year-to-date highs.
Immediate support can be identified around the upper Bollinger Band and the recent 3-day low at 3809.53, while resistance may form near the recent highs around 3936.58. Given the index’s performance relative to its moving averages and the Bollinger Bands, along with stable MACD and RSI readings, market sentiment appears positive, but investors should watch for signs of potential overextension or reversal due to the proximity to significant resistance levels.
Hang Seng Technical Analysis
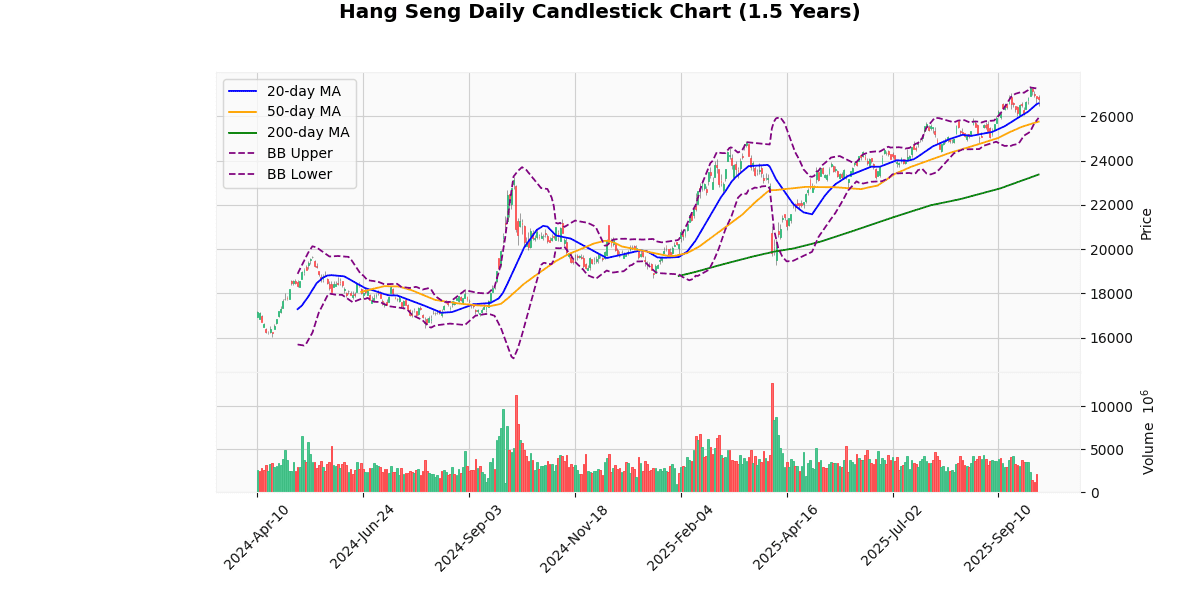
The Hang Seng Index is currently priced at 26,782.46, experiencing a slight decrease of 0.18% today. The index shows a positive trend over its moving averages, positioned above the 20-day (26,583.46), 50-day (25,758.84), and significantly above the 200-day (23,366.06) moving averages. This indicates a strong bullish trend in the medium to long term.
The Bollinger Bands reveal that the current price is closer to the upper band (27,240.83) than the lower band (25,926.08), suggesting that the price is relatively high within its recent range but not excessively so. The proximity to the upper band, however, does not indicate an immediate overbought condition as the RSI is at 57.5, which is neither in the overbought nor oversold territory.
The MACD (344.54) is currently below its signal line (351.27), indicating a potential bearish crossover which could suggest a short-term downward price momentum. This needs to be monitored closely as it could signal the start of a corrective phase if sustained.
The index’s recent price action between the 3-day high (27,145.17) and low (26,480.58) alongside an ATR of 398.27 points to moderate volatility. The current price is closer to the 3-day low, which might indicate a cooling off from recent highs.
Year-to-date and 52-week metrics show that the index has recovered impressively from its lows (18,671.49), marking significant gains. The current price is slightly below the 52-week and YTD high (27,381.84), suggesting the index is testing these upper levels.
In summary, the Hang Seng Index displays a strong bullish trend over the longer term but faces potential short-term retracement risks as indicated by the MACD and proximity to significant highs. Investors should watch for further MACD developments and RSI for stronger signals on the direction in the near term.
Technical Metrics
| Metric | Value |
|---|---|
| Current Price | 26782.46 |
| Today’s Change (%) | -0.18 |
| 20-day MA | 26583.46 |
| % from 20-day MA | 0.75 |
| 50-day MA | 25758.84 |
| % from 50-day MA | 3.97 |
| 200-day MA | 23366.06 |
| % from 200-day MA | 14.62 |
| Bollinger Upper | 27240.83 |
| % from BB Upper | -1.68 |
| Bollinger Lower | 25926.08 |
| % from BB Lower | 3.30 |
| RSI (14) | 57.50 |
| MACD | 344.54 |
| MACD Signal | 351.27 |
| 3-day High | 27145.17 |
| % from 3-day High | -1.34 |
| 3-day Low | 26480.58 |
| % from 3-day Low | 1.14 |
| 52-week High | 27381.84 |
| % from 52-week High | -2.19 |
| 52-week Low | 18671.49 |
| % from 52-week Low | 43.44 |
| YTD High | 27381.84 |
| % from YTD High | -2.19 |
| YTD Low | 18671.49 |
| % from YTD Low | 43.44 |
| ATR (14) | 398.27 |
The Hang Seng Index is currently exhibiting a bullish trend, as indicated by its position above all key moving averages (MA20, MA50, MA200), with current prices at 26782.46. This positioning above the 20-day MA (26583.46), 50-day MA (25758.84), and significantly above the 200-day MA (23366.06) suggests a strong upward momentum over both short and long-term periods.
The Bollinger Bands show the index trading closer to the upper band (27240.83) than the lower band (25926.08), indicating potential near-term resistance but also underlining the prevailing bullish sentiment. The RSI at 57.5 is neither in the overbought nor oversold territory, suggesting moderate momentum without immediate reversal signals. The MACD (344.54) being slightly below its signal line (351.27) could hint at a potential slowdown or consolidation in the near future.
Volatility, as measured by ATR (398.27), remains relatively high, reflecting ongoing market fluctuations that traders should be wary of. Key support and resistance levels are identified at recent three-day low (26480.58) and high (27145.17), respectively, with further psychological resistance possibly near the 52-week high (27381.84).
Overall, the technical outlook for the Hang Seng Index remains positive, but with signs of potential consolidation or minor pullbacks, as suggested by the MACD and proximity to the upper Bollinger Band. Investors should monitor these levels closely, as a break beyond these could signify stronger bullish or bearish trends.
Nikkei 225 Technical Analysis
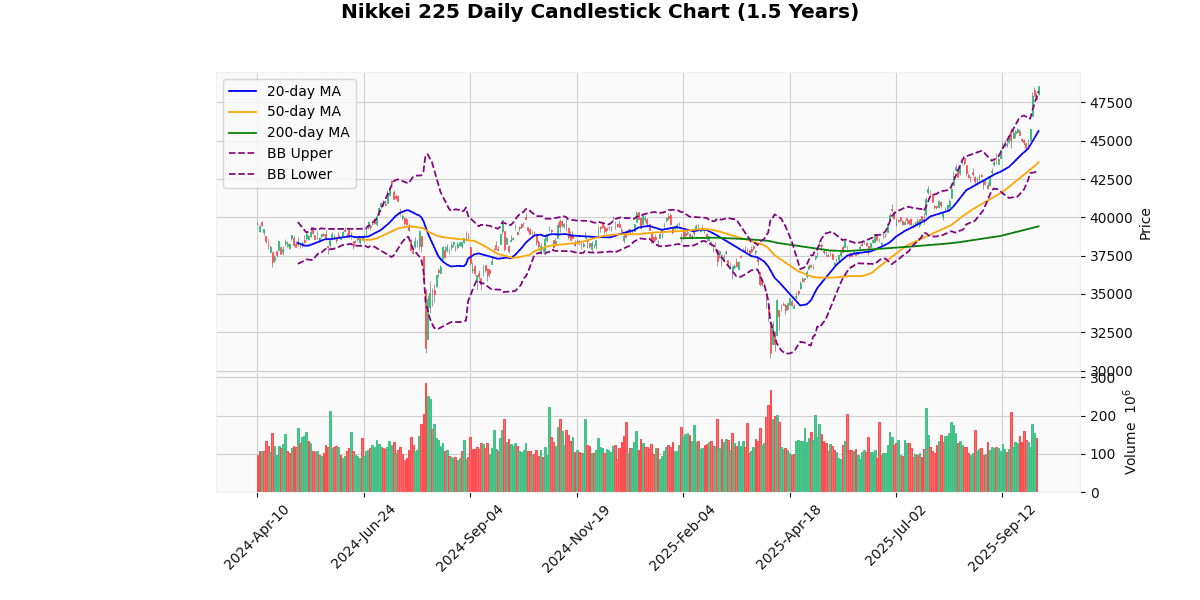
The Nikkei 225 index is currently exhibiting strong bullish signals, with a current price of 48,580.44, marking a 1.77% increase today. This price is significantly above its 20-day (45,634.93), 50-day (43,604.7), and 200-day (39,411.86) moving averages, indicating a robust upward trend over short, medium, and long-term periods.
The index’s price is just below its 52-week and year-to-date high of 48,597.08, suggesting a potential resistance level. The proximity to the 52-week high, with a mere 0.03% difference, highlights the current strength in the market but also raises the possibility of a pullback if the index fails to break this level.
The Bollinger Bands show the price exceeding the upper band (48,231.23), which typically signals an overextended market condition. This is further supported by the Relative Strength Index (RSI) at 77.56, indicating an overbought scenario that could lead to a short-term reversal or consolidation.
The Moving Average Convergence Divergence (MACD) at 1205.94, with a signal line at 950.02, confirms the bullish momentum as the MACD line is well above the signal line, suggesting continued upward movement. However, traders should watch for any potential MACD crossover below the signal line as an early indicator of a trend reversal.
The Average True Range (ATR) at 699.42 points to high volatility, aligning with the significant daily price movements and the index’s approach to critical highs.
In summary, while the Nikkei 225 shows strong bullish trends and momentum, indicators like the RSI and position relative to the Bollinger Bands caution against potential overbought conditions and the need for vigilance near critical resistance levels.
Technical Metrics
| Metric | Value |
|---|---|
| Current Price | 48580.44 |
| Today’s Change (%) | 1.77 |
| 20-day MA | 45634.93 |
| % from 20-day MA | 6.45 |
| 50-day MA | 43604.70 |
| % from 50-day MA | 11.41 |
| 200-day MA | 39411.86 |
| % from 200-day MA | 23.26 |
| Bollinger Upper | 48231.23 |
| % from BB Upper | 0.72 |
| Bollinger Lower | 43038.63 |
| % from BB Lower | 12.88 |
| RSI (14) | 77.56 |
| MACD | 1205.94 |
| MACD Signal | 950.02 |
| 3-day High | 48597.08 |
| % from 3-day High | -0.03 |
| 3-day Low | 47728.27 |
| % from 3-day Low | 1.79 |
| 52-week High | 48597.08 |
| % from 52-week High | -0.03 |
| 52-week Low | 30792.74 |
| % from 52-week Low | 57.77 |
| YTD High | 48597.08 |
| % from YTD High | -0.03 |
| YTD Low | 30792.74 |
| % from YTD Low | 57.77 |
| ATR (14) | 699.42 |
The Nikkei 225 index exhibits a strong bullish trend, as evidenced by its current price of 48,580.44, which is significantly above all key moving averages (MA20, MA50, MA200). This positioning indicates sustained upward momentum over short, medium, and long-term periods. The index is trading just below its upper Bollinger Band and has recently set new 52-week and year-to-date highs, suggesting a potential for ongoing bullish behavior, albeit with the risk of short-term pullbacks due to overextension.
The Relative Strength Index (RSI) at 77.56 points towards an overbought condition, which could signal a forthcoming consolidation or minor correction. Similarly, the MACD value significantly above its signal line supports the strong bullish momentum but also hints at possible overextension.
The Average True Range (ATR) of 699.42 reflects moderate volatility, providing room for significant price movements which should be monitored by traders for potential entry or exit points.
Immediate support and resistance levels are identified at the recent 3-day low of 47,728.27 and the 3-day high of 48,597.08, respectively. Given the proximity to its 52-week high, the index might test this level again; however, any reversal in trend should be closely watched, particularly if the index moves towards the lower Bollinger Band at 43,038.63.
Overall, market sentiment appears strongly positive, but investors should remain cautious of potential volatility and overbought conditions that could prompt price adjustments.
KOSPI Composite Technical Analysis
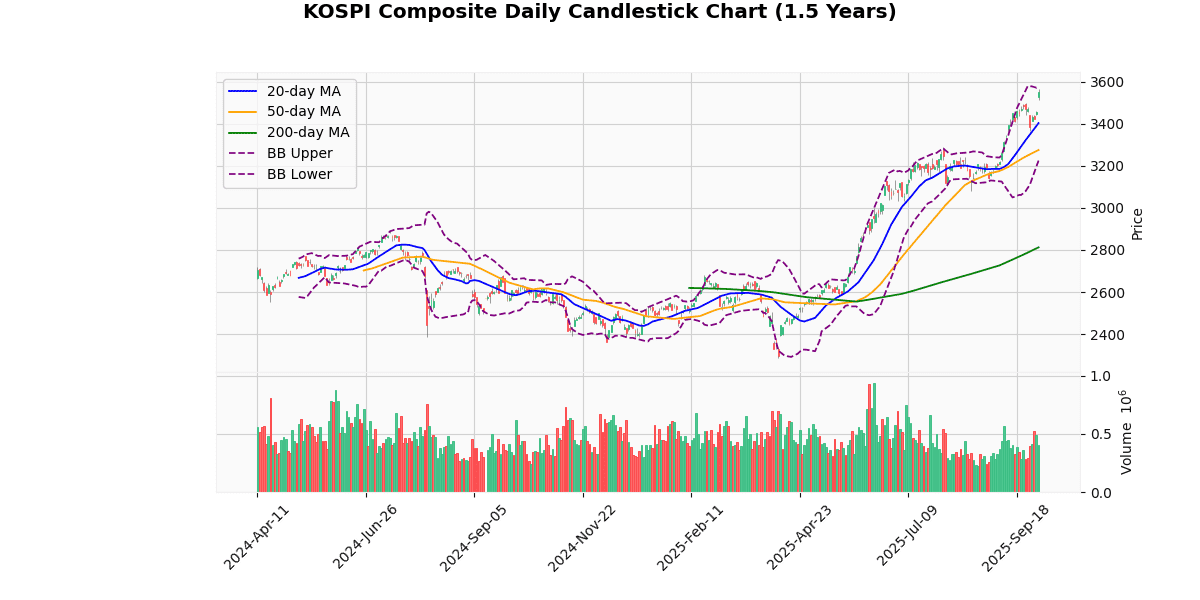
The KOSPI Composite Index is currently priced at 3549.21, showing a modest increase of 2.7% today. This recent price is just shy of its 52-week and year-to-date high of 3565.96, indicating a strong upward trend in the short term.
Analyzing the moving averages, the index is well above its 20-day (3403.04), 50-day (3275.27), and 200-day (2812.33) moving averages, reflecting a bullish trend across different time frames. The significant gap between the current price and these averages, especially the 200-day MA, suggests sustained positive momentum.
The Bollinger Bands show the current price nearing the upper band (3581.05), which typically signals a high price level relative to recent volatility, possibly indicating overbought conditions. This is supported by the Relative Strength Index (RSI) at 70.61, which is at the threshold of the overbought territory (above 70), hinting at potential for a pullback or consolidation.
The Moving Average Convergence Divergence (MACD) at 66.14, above its signal line at 65.16, confirms the ongoing bullish momentum. However, as both values are high, it suggests caution as the market may be approaching overextension.
The index’s Average True Range (ATR) of 46.54 points to a relatively stable volatility level, consistent with the recent price range movements between the 3-day high of 3565.96 and low of 3421.89.
In summary, the KOSPI Composite is exhibiting strong bullish signals across several indicators but is nearing potentially overbought levels, as indicated by the proximity to its upper Bollinger Band and high RSI. Investors should watch for signs of a reversal or consolidation, especially given the narrow gap to the recent highs and the elevated MACD.
Technical Metrics
| Metric | Value |
|---|---|
| Current Price | 3549.21 |
| Today’s Change (%) | 2.70 |
| 20-day MA | 3403.04 |
| % from 20-day MA | 4.30 |
| 50-day MA | 3275.27 |
| % from 50-day MA | 8.36 |
| 200-day MA | 2812.33 |
| % from 200-day MA | 26.20 |
| Bollinger Upper | 3581.05 |
| % from BB Upper | -0.89 |
| Bollinger Lower | 3225.04 |
| % from BB Lower | 10.05 |
| RSI (14) | 70.61 |
| MACD | 66.14 |
| MACD Signal | 65.16 |
| 3-day High | 3565.96 |
| % from 3-day High | -0.47 |
| 3-day Low | 3421.89 |
| % from 3-day Low | 3.72 |
| 52-week High | 3565.96 |
| % from 52-week High | -0.47 |
| 52-week Low | 2284.72 |
| % from 52-week Low | 55.35 |
| YTD High | 3565.96 |
| % from YTD High | -0.47 |
| YTD Low | 2284.72 |
| % from YTD Low | 55.35 |
| ATR (14) | 46.54 |
The technical outlook for the KOSPI Composite Index suggests a strong bullish trend, as indicated by its current price of 3549.21, which is well above its 20-day, 50-day, and 200-day moving averages. This positioning above key moving averages highlights sustained upward momentum. The index’s proximity to its upper Bollinger Band and a recent 52-week high of 3565.96 underscores potential resistance near these levels. However, the slight distance from the upper Bollinger Band (-0.89%) suggests there might be room for a slight upward movement before encountering significant resistance.
The RSI at 70.61 is nearing the overbought territory, which could signal a potential pullback or consolidation in the near term. Similarly, the MACD value of 66.14 above its signal line at 65.16 supports the current bullish sentiment but also warrants caution for a possible reversal if these indicators begin to diverge.
The Average True Range (ATR) of 46.54 indicates moderate volatility, supporting the possibility of continued price fluctuations within the defined range. Immediate support might be found around the lower Bollinger Band at 3225.04, which also aligns with recent lows, providing a cushion against potential downturns.
Overall, market sentiment appears positive with an inclination towards bullishness, supported by strong technical indicators. Investors should watch for any signs of reversal indicated by RSI and MACD, and consider the Bollinger Bands and recent high/low points for making informed decisions on entry or exit points in the market.
STI Technical Analysis
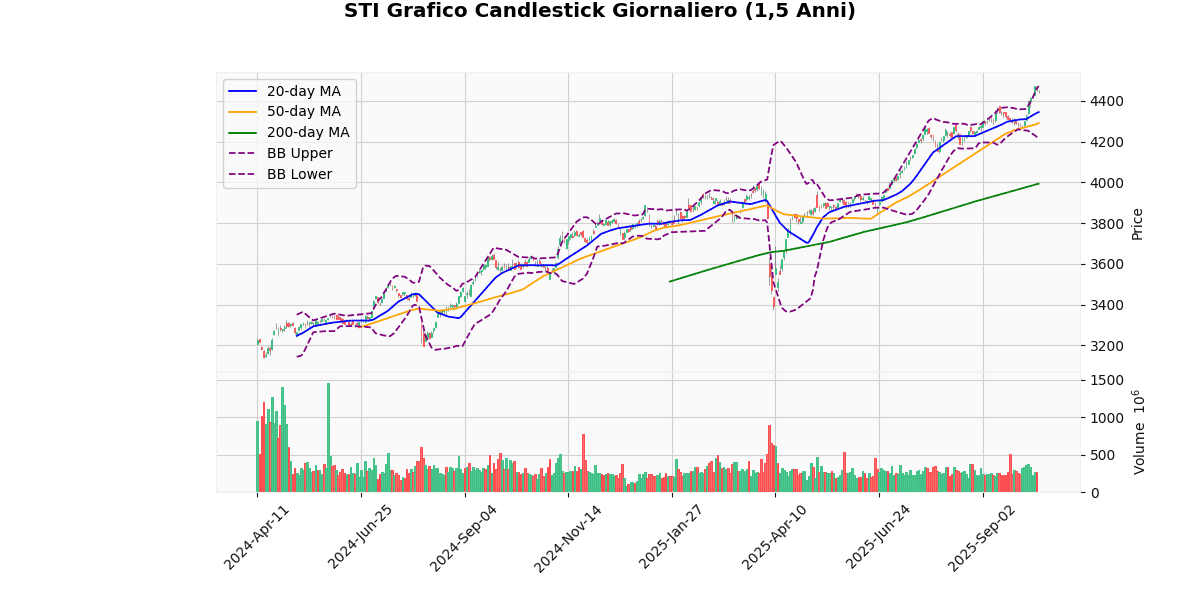
The STI index is currently priced at 4447.75, reflecting a slight decline of 0.19% today. This price is near its 52-week and year-to-date high of 4474.12, indicating a strong upward trend in the recent period.
The index is trading above all key moving averages (20-day at 4344.41, 50-day at 4290.79, and 200-day at 3993.22), which suggests a robust bullish trend over short, medium, and long-term periods. The moving averages also show significant percentage differences, especially the 200-day MA, which is 11.38% below the current price, highlighting the strong gains over the past months.
In terms of Bollinger Bands, the current price is approaching the upper band at 4472.37, but remains within the range, suggesting that the price is at the higher end of its recent volatility range but not excessively so. The bands are relatively wide, indicating continued volatility.
The RSI at 72.03 points to a potentially overbought condition, which could signal a pullback or consolidation in the near term if the index does not push past its recent highs. The MACD at 44.32 with a signal line at 30.2 shows a bullish momentum as the MACD line is above the signal line, reinforcing the current uptrend.
The Average True Range (ATR) of 30.23 indicates a moderate level of volatility, consistent with the movements observed within the Bollinger Bands.
In conclusion, the STI index shows strong bullish signals across most indicators but faces potential short-term resistance near its 52-week and YTD highs. The overbought RSI could suggest a near-term consolidation or pullback, while the MACD indicates continued bullish momentum. Investors should watch for potential MACD crossovers and RSI movements for signs of trend reversals or continuations.
Technical Metrics
| Metric | Value |
|---|---|
| Current Price | 4447.75 |
| Today’s Change (%) | -0.19 |
| 20-day MA | 4344.41 |
| % from 20-day MA | 2.38 |
| 50-day MA | 4290.79 |
| % from 50-day MA | 3.66 |
| 200-day MA | 3993.22 |
| % from 200-day MA | 11.38 |
| Bollinger Upper | 4472.37 |
| % from BB Upper | -0.55 |
| Bollinger Lower | 4216.45 |
| % from BB Lower | 5.49 |
| RSI (14) | 72.03 |
| MACD | 44.32 |
| MACD Signal | 30.20 |
| 3-day High | 4474.12 |
| % from 3-day High | -0.59 |
| 3-day Low | 4425.92 |
| % from 3-day Low | 0.49 |
| 52-week High | 4474.12 |
| % from 52-week High | -0.59 |
| 52-week Low | 3372.38 |
| % from 52-week Low | 31.89 |
| YTD High | 4474.12 |
| % from YTD High | -0.59 |
| YTD Low | 3372.38 |
| % from YTD Low | 31.89 |
| ATR (14) | 30.23 |
The technical outlook for the STI index suggests a strong bullish trend, as indicated by its current price of 4447.75, which is well above the key moving averages (MA20 at 4344.41, MA50 at 4290.79, and MA200 at 3993.22). This positioning above all major moving averages highlights sustained upward momentum over short, medium, and long-term periods.
The index is trading near the upper Bollinger Band (4472.37), suggesting it is approaching overbought territory, which is also supported by the high RSI value of 72.03. This could indicate potential for a pullback or consolidation in the near term. The MACD at 44.32, above its signal line at 30.2, confirms the current bullish sentiment but also points towards the possibility of an overheated market.
Volatility, measured by the ATR at 30.23, remains moderate, suggesting that while there is some price movement, it is not excessively volatile. The index’s proximity to its 52-week and YTD highs (4474.12) further underscores the strong bullish trend but also highlights resistance near these levels.
Potential support can be found at the lower Bollinger Band (4216.45) and further down at MA20 and MA50. Given the current market sentiment and technical indicators, traders should watch for any signs of reversal, particularly if the index fails to breach its recent highs, which could trigger profit-taking and a subsequent pullback.


