Asian Indices Technical Analysis: Kospi Advances and Nikkei Slides
Shanghai Composite Technical Analysis
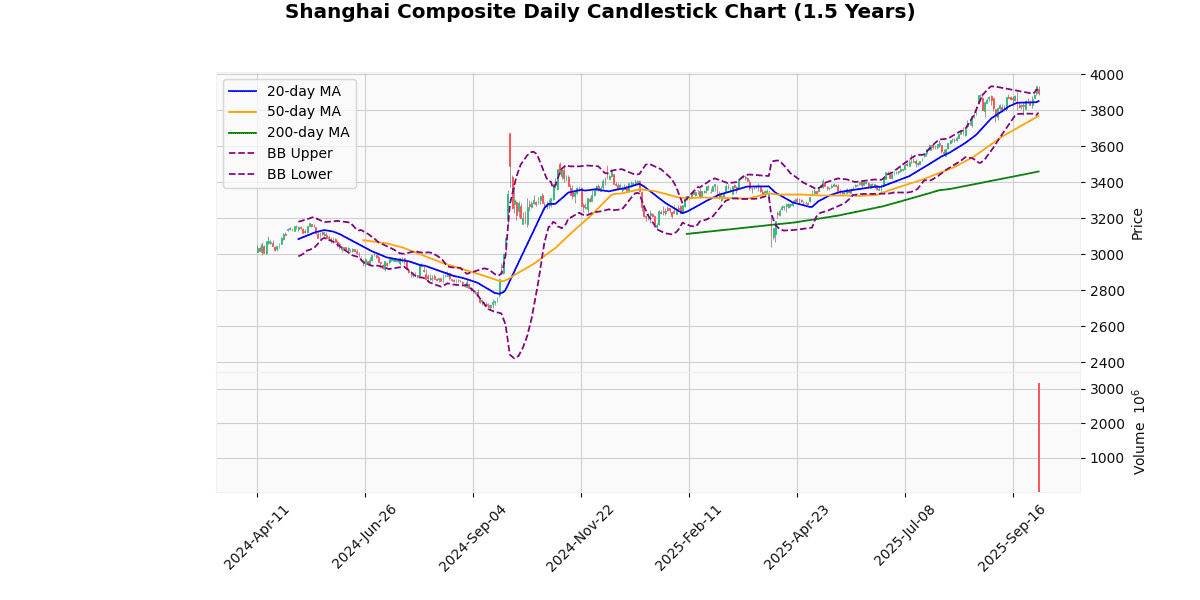
The Shanghai Composite Index is currently priced at 3897.03, reflecting a decrease of 0.94% today. This movement places the index near its upper Bollinger Band (3915.15) and above its 20-day moving average (MA20) of 3850.85, indicating a bullish short-term trend. The index also stands above its 50-day (MA50) and 200-day (MA200) moving averages, at 3768.45 and 3459.44 respectively, suggesting a sustained upward trend over the medium to long term.
The Relative Strength Index (RSI) at 60.11 points towards a slightly overbought condition but not excessively so, indicating there might still be room for upward movement before the market becomes significantly overbought. The Moving Average Convergence Divergence (MACD) at 32.38 with a signal line at 31.95 confirms the bullish momentum as it is above the signal line, though the proximity suggests cautious observation for potential crossover which could indicate a reversal or slowdown in momentum.
The index’s current position just below its recent 3-day high of 3936.58 (also the 52-week and year-to-date high) and above the 3-day low of 3866.28 shows a relatively tight trading range in the short term. The Average True Range (ATR) of 45.26 suggests moderate volatility.
Considering the Bollinger Bands, the index is trading close to the upper band but not beyond it, indicating that while the market is towards the higher end of its recent price range, it is not in extreme territory.
In summary, the Shanghai Composite Index shows a strong bullish trend with its position above all key moving averages and near the upper Bollinger Band. The MACD above its signal line supports this bullish view, but traders should monitor for any potential MACD crossover or an RSI that moves into a more significantly overbought territory, which might suggest a pullback or consolidation in the near term.
Technical Metrics
| Metric | Value |
|---|---|
| Current Price | 3897.03 |
| Today’s Change (%) | -0.94 |
| 20-day MA | 3850.85 |
| % from 20-day MA | 1.20 |
| 50-day MA | 3768.45 |
| % from 50-day MA | 3.41 |
| 200-day MA | 3459.44 |
| % from 200-day MA | 12.65 |
| Bollinger Upper | 3915.15 |
| % from BB Upper | -0.46 |
| Bollinger Lower | 3786.55 |
| % from BB Lower | 2.92 |
| RSI (14) | 60.11 |
| MACD | 32.38 |
| MACD Signal | 31.95 |
| 3-day High | 3936.58 |
| % from 3-day High | -1.00 |
| 3-day Low | 3866.28 |
| % from 3-day Low | 0.80 |
| 52-week High | 3936.58 |
| % from 52-week High | -1.00 |
| 52-week Low | 2731.36 |
| % from 52-week Low | 42.68 |
| YTD High | 3936.58 |
| % from YTD High | -1.00 |
| YTD Low | 3040.69 |
| % from YTD Low | 28.16 |
| ATR (14) | 45.26 |
The Shanghai Composite Index currently exhibits a bullish trend as evidenced by its position relative to its moving averages. The index stands above the 20-day, 50-day, and 200-day moving averages, indicating sustained upward momentum over short, medium, and long-term periods. The proximity of the current price to the upper Bollinger Band, which is just 0.46% below the band’s upper limit, suggests that the index is testing resistance levels that could either lead to a breakout or a pullback if resistance holds.
The Relative Strength Index (RSI) at 60.11 points towards a moderately bullish sentiment, neither overbought nor oversold. The MACD line slightly above its signal line further supports the bullish momentum, although the closeness of these two lines calls for cautious observation of potential shifts in trend.
Volatility, as measured by the Average True Range (ATR), is relatively stable, indicating that the recent price movements are not out of the ordinary for this index. The index’s recent high near its 52-week and year-to-date highs suggests that it is at a critical juncture, facing significant resistance levels.
In terms of support and resistance, the immediate support is likely around the 20-day moving average of 3850.85, with more robust support at the lower Bollinger Band at 3786.55. Resistance is currently being tested near the 52-week high of 3936.58, with potential psychological resistance at the 4000 level if a breakout occurs.
Overall, market sentiment appears cautiously optimistic, with indicators supporting further gains, albeit with close monitoring for signs of reversal or consolidation near these critical levels.
Hang Seng Technical Analysis
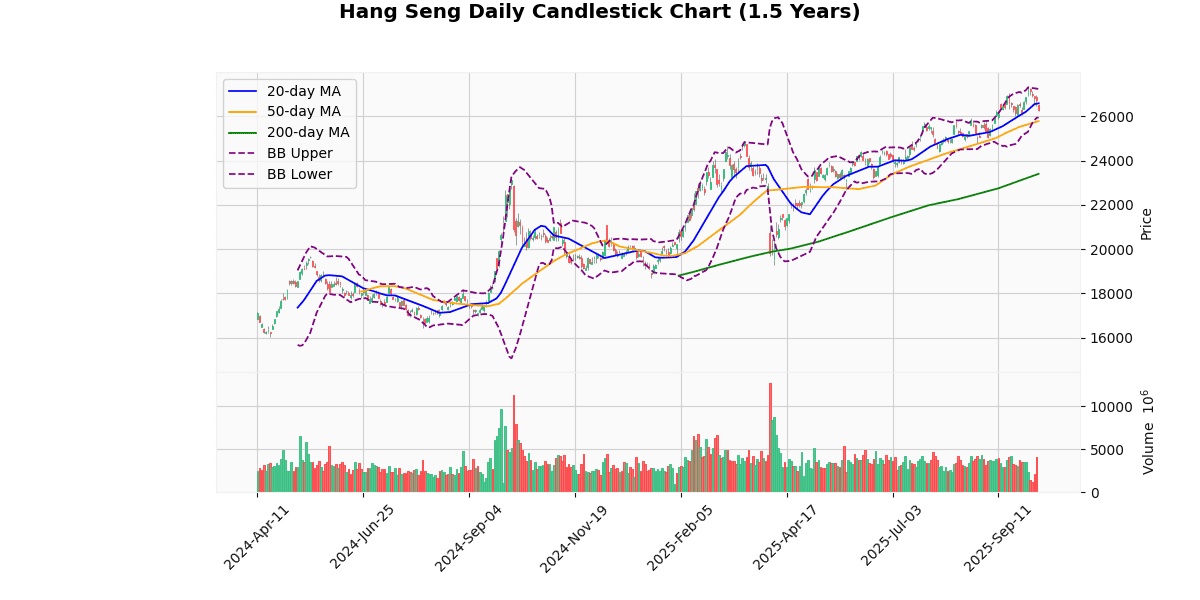
The Hang Seng Index currently stands at 26,289.24, reflecting a decline of 1.73% today. This movement places it below the 20-day moving average (MA20) of 26,586.41 but above the 50-day (MA50) and 200-day (MA200) moving averages, which are 25,780.49 and 23,398.38 respectively. This positioning suggests a short-term bearish sentiment but maintains a bullish outlook over the medium to long term.
The Bollinger Bands indicate a widening volatility with the current price nearing the lower band at 25,940.00, suggesting potential support or a rebound level. The index’s price is closer to the lower band than the upper band at 27,232.82, which might indicate limited upward momentum in the short term.
The Relative Strength Index (RSI) at 49.08 is near the neutral 50 mark, suggesting neither overbought nor oversold conditions, indicating a lack of strong momentum. The Moving Average Convergence Divergence (MACD) at 282.76, being below its signal line at 337.19, confirms the bearish momentum as it represents a bearish crossover.
The index’s price is currently closer to its 3-day low of 26,247.04 than its 3-day high of 26,978.41, further supporting the short-term bearish outlook. The Average True Range (ATR) at 405.93 points to a relatively high volatility, which could mean larger price swings are possible.
Year-to-date and 52-week metrics show the index has recovered significantly from its lows, suggesting a strong upward trend over the longer term despite recent pullbacks. The current price is approximately 4% below the 52-week and YTD high, indicating some room before encountering major resistance.
In summary, the Hang Seng Index shows a bearish trend in the short term with potential support around the lower Bollinger Band and the MA50. The medium to long-term outlook remains bullish, supported by the MA200 and the significant recovery from the yearly lows. Investors should watch for potential rebounds from support levels or a further decline if these levels are breached.
Technical Metrics
| Metric | Value |
|---|---|
| Current Price | 26289.24 |
| Today’s Change (%) | -1.73 |
| 20-day MA | 26586.41 |
| % from 20-day MA | -1.12 |
| 50-day MA | 25780.49 |
| % from 50-day MA | 1.97 |
| 200-day MA | 23398.38 |
| % from 200-day MA | 12.35 |
| Bollinger Upper | 27232.82 |
| % from BB Upper | -3.46 |
| Bollinger Lower | 25940.00 |
| % from BB Lower | 1.35 |
| RSI (14) | 49.08 |
| MACD | 282.76 |
| MACD Signal | 337.19 |
| 3-day High | 26978.41 |
| % from 3-day High | -2.55 |
| 3-day Low | 26247.04 |
| % from 3-day Low | 0.16 |
| 52-week High | 27381.84 |
| % from 52-week High | -3.99 |
| 52-week Low | 18671.49 |
| % from 52-week Low | 40.80 |
| YTD High | 27381.84 |
| % from YTD High | -3.99 |
| YTD Low | 18671.49 |
| % from YTD Low | 40.80 |
| ATR (14) | 405.93 |
The Hang Seng Index is currently positioned below its 20-day moving average (MA20) of 26,586.41 but remains above both its 50-day (MA50) and 200-day (MA200) moving averages, indicating a mixed short-term bearish but longer-term bullish trend. The index is trading near the lower Bollinger Band, suggesting it might be approaching oversold territory, which is somewhat supported by a Relative Strength Index (RSI) of 49.08, indicating a neutral market momentum.
The Moving Average Convergence Divergence (MACD) is currently below its signal line, suggesting bearish momentum in the near term. Additionally, the index’s current price is closer to the lower Bollinger Band than the upper, which could indicate potential for a rebound if other conditions align favorably.
Volatility, as measured by the Average True Range (ATR), is relatively high at 405.93, reflecting the significant price movements that have been occurring.
Key support and resistance levels to watch are the recent 3-day low of 26,247.04 and the 3-day high of 26,978.41, respectively. A break below the support could see further declines, while a move above the resistance might signal a recovery in the index. Overall, market sentiment appears cautious, with investors likely watching for either a consolidation above current support levels or a breakout above short-term resistance to confirm the next directional move.
Nikkei 225 Technical Analysis
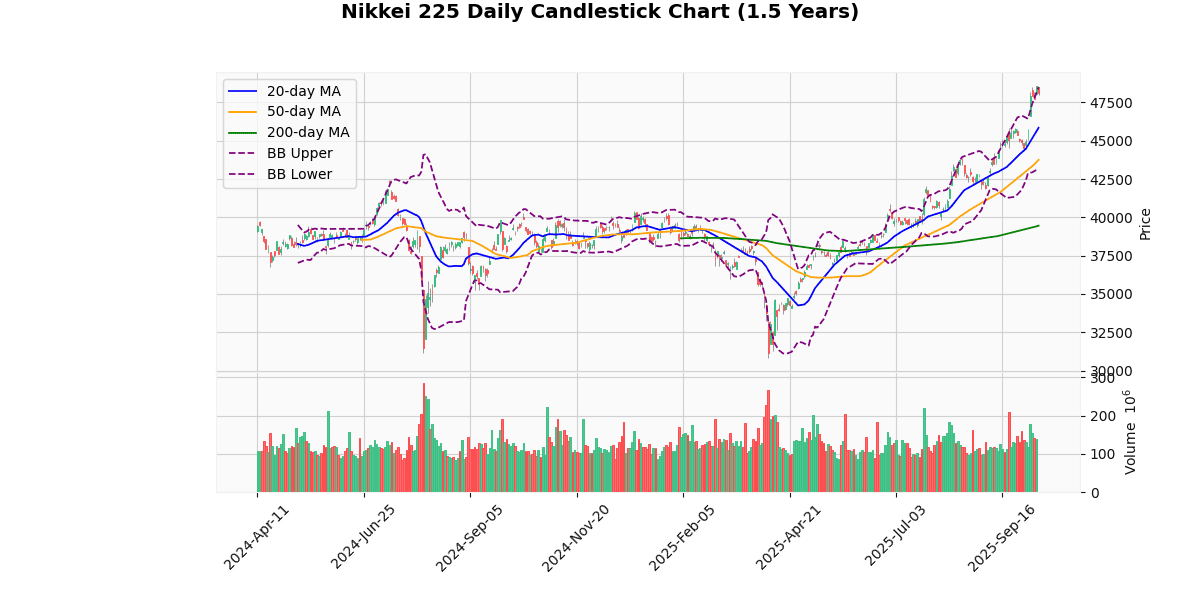
The Nikkei 225 index is currently priced at 48,088.8, reflecting a decrease of 1.01% today. This recent drop places the index slightly below its upper Bollinger Band (48,515.5) and near its recent 3-day and 52-week high of 48,597.08, indicating a potential resistance level around these highs.
The index’s moving averages (MA) show a strong upward trend with the current price significantly above the 20-day MA (45,847.49), 50-day MA (43,752.99), and 200-day MA (39,454.95). This suggests a bullish long-term trend, as the index is performing well above these key averages.
The Relative Strength Index (RSI) at 71.76 signals that the index might be entering overbought territory, which could indicate a potential pullback or consolidation in the near term. Additionally, the MACD value of 1242.9 above its signal line (1008.6) supports the current bullish momentum but also warrants caution for a possible reversal if the index starts to decline.
The Average True Range (ATR) of 693.59 points to a relatively high level of recent volatility, which is consistent with the significant movements between the 3-day high and low (48,597.08 and 47,728.27, respectively).
In summary, while the Nikkei 225 shows robust bullish signals based on its performance above moving averages and a strong MACD, the proximity to its upper Bollinger Band and an elevated RSI suggest that the index might face short-term resistance or a potential reversal. Investors should watch for any signs of decreasing momentum or price corrections, especially if the index starts to consistently trade below its recent highs.
Technical Metrics
| Metric | Value |
|---|---|
| Current Price | 48088.80 |
| Today’s Change (%) | -1.01 |
| 20-day MA | 45847.49 |
| % from 20-day MA | 4.89 |
| 50-day MA | 43752.99 |
| % from 50-day MA | 9.91 |
| 200-day MA | 39454.95 |
| % from 200-day MA | 21.88 |
| Bollinger Upper | 48515.50 |
| % from BB Upper | -0.88 |
| Bollinger Lower | 43179.47 |
| % from BB Lower | 11.37 |
| RSI (14) | 71.76 |
| MACD | 1242.90 |
| MACD Signal | 1008.60 |
| 3-day High | 48597.08 |
| % from 3-day High | -1.05 |
| 3-day Low | 47728.27 |
| % from 3-day Low | 0.76 |
| 52-week High | 48597.08 |
| % from 52-week High | -1.05 |
| 52-week Low | 30792.74 |
| % from 52-week Low | 56.17 |
| YTD High | 48597.08 |
| % from YTD High | -1.05 |
| YTD Low | 30792.74 |
| % from YTD Low | 56.17 |
| ATR (14) | 693.59 |
The technical outlook for the Nikkei 225 index suggests a strong bullish trend, as indicated by its current price of 48,088.8, which is significantly above its 20-day, 50-day, and 200-day moving averages. This positioning highlights sustained upward momentum over short, medium, and long-term periods. The index’s proximity to the upper Bollinger Band, just below the recent 52-week high of 48,597.08, suggests that it is testing resistance levels that could either lead to a breakout or a retracement if the market perceives it as overextended.
The Relative Strength Index (RSI) at 71.76 signals that the market is approaching overbought conditions, which could prompt some investors to take profits, potentially leading to a pullback. Similarly, the MACD value above its signal line supports the strength of the current uptrend but also warrants caution for potential reversal signals if the index starts to decline.
Volatility, as measured by the Average True Range (ATR) of 693.59, remains relatively high, indicating that significant price movements are still possible. Investors should watch for potential support around the lower Bollinger Band at 43,179.47 and resistance near the recent highs around 48,597.08.
Overall, market sentiment appears bullish, but with the index near all-time highs and technical indicators suggesting overbought conditions, there could be increased volatility with possible short-term pullbacks. Investors should consider these factors when planning their market strategies.
KOSPI Composite Technical Analysis
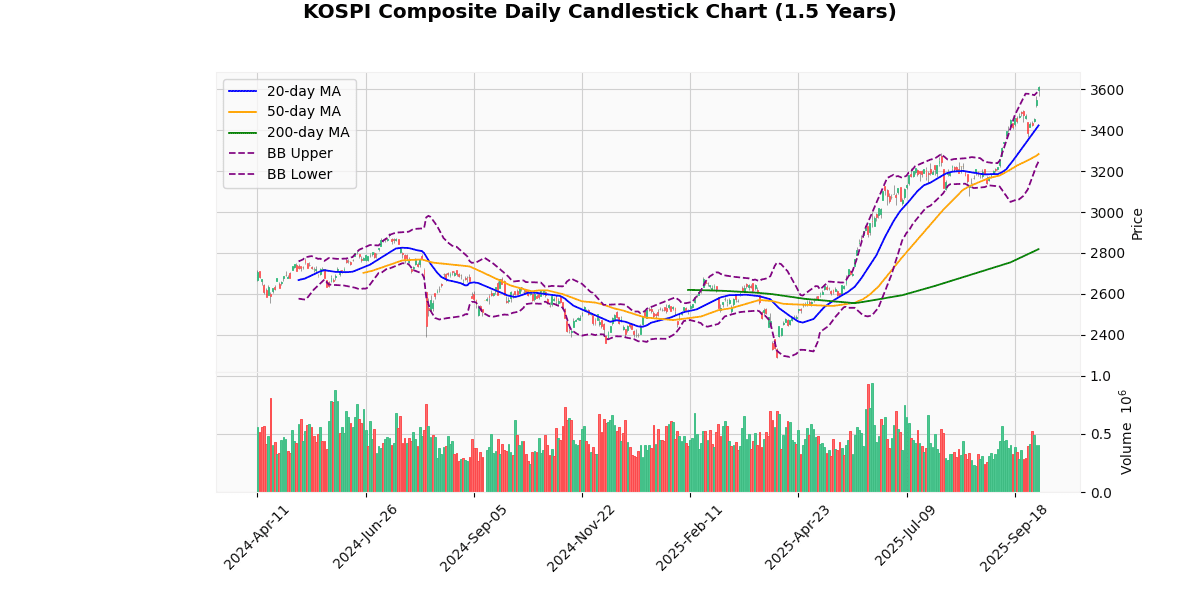
The KOSPI Composite Index currently stands at 3610.6, marking a significant uptrend with today’s increase of 1.73%. Analyzing its moving averages, the index is well above its 20-day (3423.32), 50-day (3283.68), and 200-day (2818.58) moving averages, indicating a strong bullish momentum over short, medium, and long-term periods. The percentage differences from these averages further underscore this growth, with the index up 5.47% from the 20-day MA, 9.96% from the 50-day MA, and a substantial 28.1% from the 200-day MA.
The Bollinger Bands reveal that the current price is slightly above the upper band (3598.88), suggesting that the index might be entering overbought territory. This is supported by the Relative Strength Index (RSI) of 74.28, which is above the typical overbought threshold of 70, indicating potential for a pullback or consolidation in the near term.
The Moving Average Convergence Divergence (MACD) at 74.69 with a signal of 67.06 shows a bullish crossover, reinforcing the strong upward trend. However, caution is warranted as the index is near its 52-week and year-to-date high of 3617.86, showing only a 0.2% difference from the current price.
The Average True Range (ATR) of 48.12 suggests moderate volatility, and the index’s recent performance between its 3-day high (3617.86) and low (3440.42) supports this, indicating fluctuating but generally upward movement.
In summary, while the KOSPI Composite demonstrates robust bullish signals across various indicators, the proximity to its historical highs and overbought RSI levels suggest potential for near-term volatility or correction. Investors should monitor for any signs of reversal, particularly if the index starts to consistently trade below the upper Bollinger Band or if there are bearish MACD crossovers.
Technical Metrics
| Metric | Value |
|---|---|
| Current Price | 3610.60 |
| Today’s Change (%) | 1.73 |
| 20-day MA | 3423.32 |
| % from 20-day MA | 5.47 |
| 50-day MA | 3283.68 |
| % from 50-day MA | 9.96 |
| 200-day MA | 2818.58 |
| % from 200-day MA | 28.10 |
| Bollinger Upper | 3598.88 |
| % from BB Upper | 0.33 |
| Bollinger Lower | 3247.76 |
| % from BB Lower | 11.17 |
| RSI (14) | 74.28 |
| MACD | 74.69 |
| MACD Signal | 67.06 |
| 3-day High | 3617.86 |
| % from 3-day High | -0.20 |
| 3-day Low | 3440.42 |
| % from 3-day Low | 4.95 |
| 52-week High | 3617.86 |
| % from 52-week High | -0.20 |
| 52-week Low | 2284.72 |
| % from 52-week Low | 58.03 |
| YTD High | 3617.86 |
| % from YTD High | -0.20 |
| YTD Low | 2284.72 |
| % from YTD Low | 58.03 |
| ATR (14) | 48.12 |
The technical outlook for the KOSPI Composite Index suggests a strong bullish trend, as evidenced by its current price of 3610.6, which is significantly above all key moving averages (MA20 at 3423.32, MA50 at 3283.68, and MA200 at 2818.58). This indicates sustained upward momentum over short, medium, and long-term periods.
The index is currently trading just above the upper Bollinger Band (3598.88), suggesting that it might be entering overbought territory. This is further supported by a high Relative Strength Index (RSI) of 74.28, typically indicative of overbought conditions which could lead to a potential pullback or consolidation in the near term.
The Moving Average Convergence Divergence (MACD) value of 74.69 above its signal line at 67.06 reinforces the current bullish momentum. However, investors should watch for any signs of divergence that might suggest a slowdown or reversal in trend.
The Average True Range (ATR) of 48.12 points to a relatively high level of recent volatility, which, combined with the index’s proximity to its 52-week and year-to-date high (3617.86), suggests that the market might experience increased price fluctuations.
Potential resistance is likely at the recent high of 3617.86, while support might be found around the lower Bollinger Band at 3247.76 or the 20-day moving average at 3423.32, should a retracement occur. Overall, market sentiment appears bullish, but caution is warranted given the overbought conditions and the possibility of short-term volatility or corrections.
STI Technical Analysis
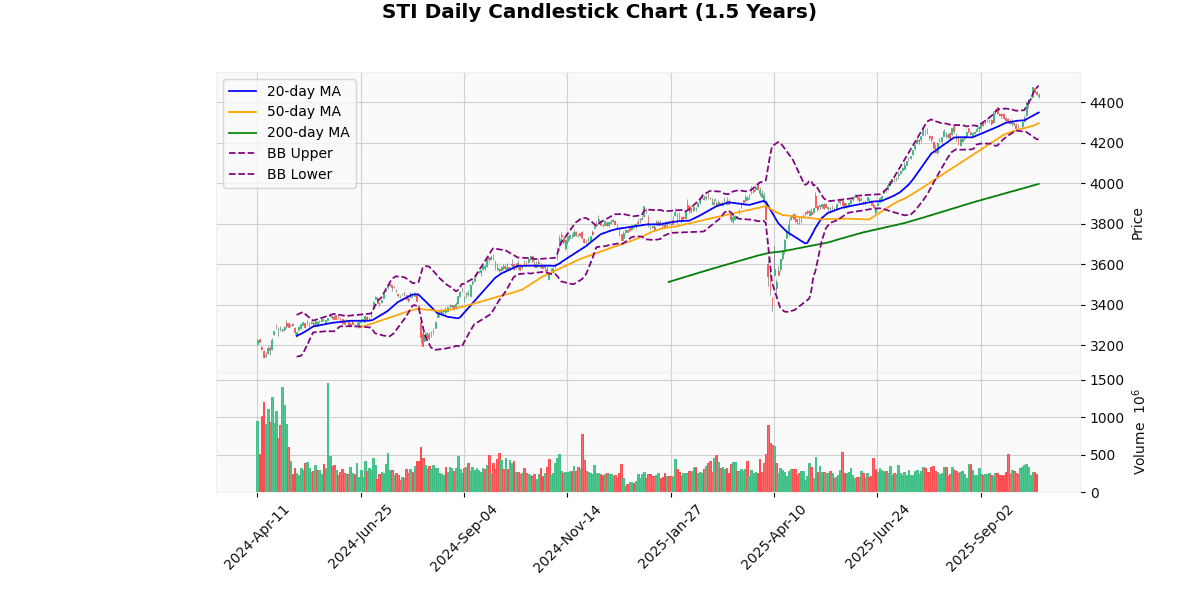
The STI index is currently priced at 4433.03, experiencing a slight decline of 0.17% today. This price is notably above its 20-day (4348.49), 50-day (4296.23), and 200-day (3996.5) moving averages, indicating a robust upward trend over the short, medium, and long term. The index’s current position above all key moving averages by 1.94%, 3.18%, and 10.92% respectively, further underscores this bullish momentum.
Analyzing the Bollinger Bands, the index is trading close to the upper band (4481.11), which suggests that the market might be approaching overbought territory. This is also supported by the Relative Strength Index (RSI) of 68.03, nearing the overbought threshold of 70, indicating potential for a pullback or stabilization in the near term.
The Moving Average Convergence Divergence (MACD) stands at 44.19, with its signal line at 32.91, showing a bullish crossover that supports the ongoing upward trend. However, traders should watch for any signs of divergence that might suggest a weakening in the current trend.
The index’s proximity to its 52-week and year-to-date high (4474.12) at only a 0.92% difference, combined with a recent 3-day high of 4469.92, suggests that the index is testing critical resistance levels. The Average True Range (ATR) of 29.77 points to moderate daily volatility, which could influence the index’s ability to sustain or break past these highs.
In summary, the STI index exhibits strong bullish signals across several indicators, but caution is warranted given the near-overbought RSI levels and the proximity to significant resistance levels. Investors should monitor for potential pullbacks or consolidations, especially if the index fails to breach recent highs.
Technical Metrics
| Metric | Value |
|---|---|
| Current Price | 4433.03 |
| Today’s Change (%) | -0.17 |
| 20-day MA | 4348.49 |
| % from 20-day MA | 1.94 |
| 50-day MA | 4296.23 |
| % from 50-day MA | 3.18 |
| 200-day MA | 3996.50 |
| % from 200-day MA | 10.92 |
| Bollinger Upper | 4481.11 |
| % from BB Upper | -1.07 |
| Bollinger Lower | 4215.87 |
| % from BB Lower | 5.15 |
| RSI (14) | 68.03 |
| MACD | 44.19 |
| MACD Signal | 32.91 |
| 3-day High | 4469.92 |
| % from 3-day High | -0.83 |
| 3-day Low | 4421.89 |
| % from 3-day Low | 0.25 |
| 52-week High | 4474.12 |
| % from 52-week High | -0.92 |
| 52-week Low | 3372.38 |
| % from 52-week Low | 31.45 |
| YTD High | 4474.12 |
| % from YTD High | -0.92 |
| YTD Low | 3372.38 |
| % from YTD Low | 31.45 |
| ATR (14) | 29.77 |
The technical outlook for the STI index suggests a generally bullish sentiment, as indicated by its current price of 4433.03, which is above all key moving averages (MA20 at 4348.49, MA50 at 4296.23, and MA200 at 3996.5). This positioning above the moving averages highlights a strong upward trend over short, medium, and long-term periods.
The index is trading near the upper Bollinger Band (4481.11), suggesting that it is approaching overbought levels, although it has not breached this upper limit. The Relative Strength Index (RSI) at 68.03 supports this, indicating that the market is nearing overbought territory but not excessively so. The MACD value at 44.19, above its signal line at 32.91, further confirms the bullish momentum.
Volatility, as measured by the Average True Range (ATR) of 29.77, points to moderate market fluctuations, which is typical for an index of this nature.
Key support and resistance levels are identified by recent trading ranges and Bollinger Bands. Immediate support can be seen around the lower Bollinger Band at 4215.87, while resistance is near the recent 52-week high at 4474.12. The proximity to the year’s high suggests that breaking this level could lead to new highs, whereas a retreat might find support at the middle Bollinger Band or the 20-day moving average.
Overall, the STI’s technical indicators suggest continued bullishness, but with caution advised as the index approaches historically high levels, potentially prompting consolidation or a mild pullback before further upward movements.
Disclaimer
The content on MarketsFN.com is provided for educational and informational purposes only. It does not constitute financial advice, investment recommendations, or trading guidance. All investments involve risks, and past performance does not guarantee future results. You are solely responsible for your investment decisions and should conduct independent research and consult a qualified financial advisor before acting. MarketsFN.com and its authors are not liable for any losses or damages arising from your use of this information.


