US Indices Rise, Russell2000 Leads Gains
DJIA Technical Analysis

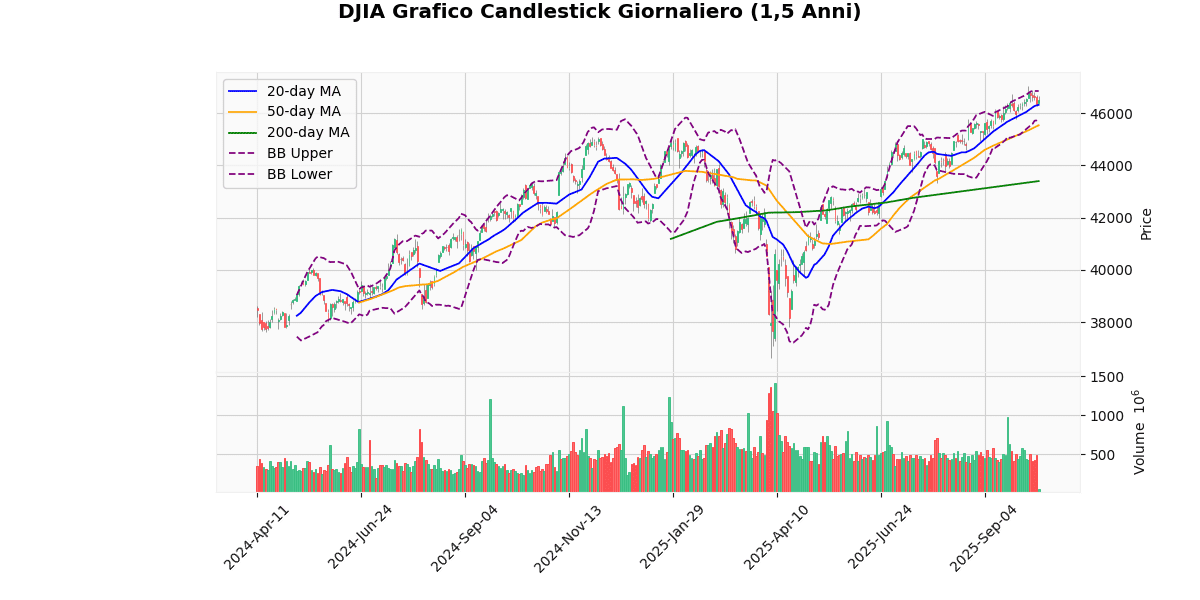
The DJIA is currently priced at 46,495.12, showing a modest increase of 0.29% today. This performance places the index above its 20-day moving average (MA20) of 46,314.7 and significantly above both its 50-day (MA50) at 45,532.09 and 200-day (MA200) moving averages at 43,396.24. The positioning above these key moving averages indicates a strong bullish trend in the medium to long term.
The Bollinger Bands reveal that the current price is nearing the upper band at 46,844.16, suggesting that the market might be approaching overbought territory. However, the price remains within the bands, indicating no immediate signs of extreme volatility. The Relative Strength Index (RSI) at 59.28 supports this, as it is below the typical overbought threshold of 70 but still indicates strong buying momentum.
The Moving Average Convergence Divergence (MACD) at 284.49 with a signal line at 319.96 shows a recent bearish crossover as the MACD falls below the signal line. This could suggest a potential slowdown or reversal in the upward trend, warranting close monitoring for further confirmation.
The index’s proximity to its 52-week and year-to-date high at 47,049.64, with a current shortfall of around 1.18%, combined with a high Average True Range (ATR) of 371.16, points to continued high volatility and potential for significant price movements.
In summary, while the DJIA shows strong bullish signals from its moving averages and RSI, the MACD’s recent bearish crossover and the proximity to the upper Bollinger Band could indicate potential for a pullback or consolidation in the near term. Investors should watch for further MACD developments and any breakout from Bollinger Band levels to adjust their strategies accordingly.
Technical Metrics
| Metric | Value |
|---|---|
| Current Price | 46495.12 |
| Today’s Change (%) | 0.29 |
| 20-day MA | 46314.70 |
| % from 20-day MA | 0.39 |
| 50-day MA | 45532.09 |
| % from 50-day MA | 2.12 |
| 200-day MA | 43396.24 |
| % from 200-day MA | 7.14 |
| Bollinger Upper | 46844.16 |
| % from BB Upper | -0.75 |
| Bollinger Lower | 45785.23 |
| % from BB Lower | 1.55 |
| RSI (14) | 59.28 |
| MACD | 284.49 |
| MACD Signal | 319.96 |
| 3-day High | 46816.28 |
| % from 3-day High | -0.69 |
| 3-day Low | 46271.40 |
| % from 3-day Low | 0.48 |
| 52-week High | 47049.64 |
| % from 52-week High | -1.18 |
| 52-week Low | 36611.78 |
| % from 52-week Low | 26.99 |
| YTD High | 47049.64 |
| % from YTD High | -1.18 |
| YTD Low | 36611.78 |
| % from YTD Low | 26.99 |
| ATR (14) | 371.16 |
The DJIA’s technical outlook indicates a bullish trend as the index is currently trading above its 20-day, 50-day, and 200-day moving averages, suggesting a strong upward momentum over short, medium, and long-term periods. The current price of 46,495.12 is slightly below the upper Bollinger Band and well above the middle and lower bands, indicating that the price is in the higher range but not excessively so, which could suggest a continuation of the upward trend without immediate overbought concerns.
The RSI at 59.28 is near the upper range of the neutral zone, pointing towards more buyers than sellers in the market, but not yet signaling overbought conditions. The MACD is above its signal line but showing a convergence, which might suggest a potential slowdown or reversal in the upward momentum if the trend continues.
The Average True Range (ATR) of 371.16 highlights moderate volatility, supporting the potential for significant price movements which should be monitored by traders for sudden changes.
Key support and resistance levels to watch are the recent 3-day low at 46,271.4 and the 3-day high at 46,816.28, respectively. The proximity to the 52-week high also suggests that breaking past this level could lead to new highs, whereas any pullback might find support at the higher moving averages due to underlying bullish sentiment. Overall, the market sentiment appears positive, with potential for further gains unless key technical indicators such as RSI and MACD show stronger signs of reversal.
S&P500 Technical Analysis

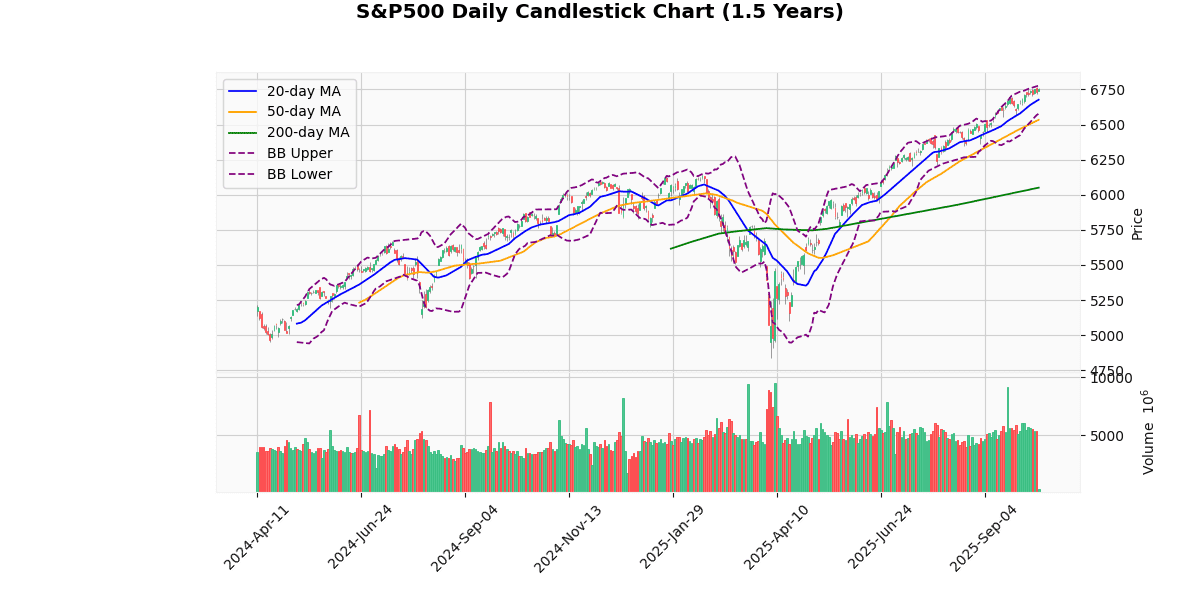
The S&P 500 index is currently priced at 6751.01, marking a modest increase of 0.24% today. This price is near its 52-week and year-to-date high of 6764.58, indicating a strong bullish trend in the recent term. The index is trading above all key moving averages (20-day at 6677.12, 50-day at 6533.79, and 200-day at 6050.5), which supports the ongoing upward momentum. The differences between the current price and these averages (1.11% above the 20-day, 3.32% above the 50-day, and 11.58% above the 200-day) further underscore the strength of this trend.
The Bollinger Bands show the index nearing the upper band at 6777.15, suggesting that the price is in the higher range of its recent volatility, which could indicate a potential for a short-term pullback if the index does not break through the upper band. However, the relatively high RSI of 67.65, though not yet in the overbought territory (typically considered overbought above 70), suggests that there is still some upward momentum.
The MACD (62.39) is slightly below its signal line (63.03), indicating a potential loss of momentum or a consolidation phase might be near. This is further evidenced by the proximity of the current price to the recent three-day high (6764.58) and the minimal percentage difference from the 52-week and YTD highs (-0.2%).
The Average True Range (ATR) of 46.71 points to a moderate level of volatility, consistent with the index’s recent price movements. Given the current metrics, investors might watch for either a consolidation or a slight pullback, especially if the index fails to sustain a break above the recent highs. However, the overall trend remains robustly bullish, supported by the index’s performance above major moving averages and the year’s strong gains.
Technical Metrics
| Metric | Value |
|---|---|
| Current Price | 6751.01 |
| Today’s Change (%) | 0.24 |
| 20-day MA | 6677.12 |
| % from 20-day MA | 1.11 |
| 50-day MA | 6533.79 |
| % from 50-day MA | 3.32 |
| 200-day MA | 6050.50 |
| % from 200-day MA | 11.58 |
| Bollinger Upper | 6777.15 |
| % from BB Upper | -0.39 |
| Bollinger Lower | 6577.09 |
| % from BB Lower | 2.64 |
| RSI (14) | 67.65 |
| MACD | 62.39 |
| MACD Signal | 63.03 |
| 3-day High | 6764.58 |
| % from 3-day High | -0.20 |
| 3-day Low | 6716.17 |
| % from 3-day Low | 0.52 |
| 52-week High | 6764.58 |
| % from 52-week High | -0.20 |
| 52-week Low | 4835.04 |
| % from 52-week Low | 39.63 |
| YTD High | 6764.58 |
| % from YTD High | -0.20 |
| YTD Low | 4835.04 |
| % from YTD Low | 39.63 |
| ATR (14) | 46.71 |
The S&P 500 index currently exhibits a bullish technical outlook, trading above its key moving averages (20-day, 50-day, and 200-day), which indicates a strong upward trend over the short, medium, and long term. The current price of 6751.01 is close to the upper Bollinger Band at 6777.15, suggesting that the index is approaching a potential resistance level. Additionally, the proximity to the recent 52-week and year-to-date high of 6764.58 reinforces this resistance area.
The Relative Strength Index (RSI) at 67.65 is nearing the overbought territory, which could signal a potential pullback or consolidation in the near term. However, the Moving Average Convergence Divergence (MACD) at 62.39, just below its signal line at 63.03, indicates a slight loss of momentum but remains in a generally positive zone.
Volatility, measured by the Average True Range (ATR) of 46.71, suggests moderate daily price movement, which aligns with the index’s recent performance. Key support can be found at the lower Bollinger Band at 6577.09 and further down at the 20-day moving average of 6677.12.
Overall, market sentiment appears positive, supported by the index’s performance above significant moving averages and near historical highs. Investors should watch for potential resistance at the upper Bollinger Band and the recent high, with a cautious eye on RSI levels for signs of overextension in the market’s upward move.
NASDAQ100 Technical Analysis

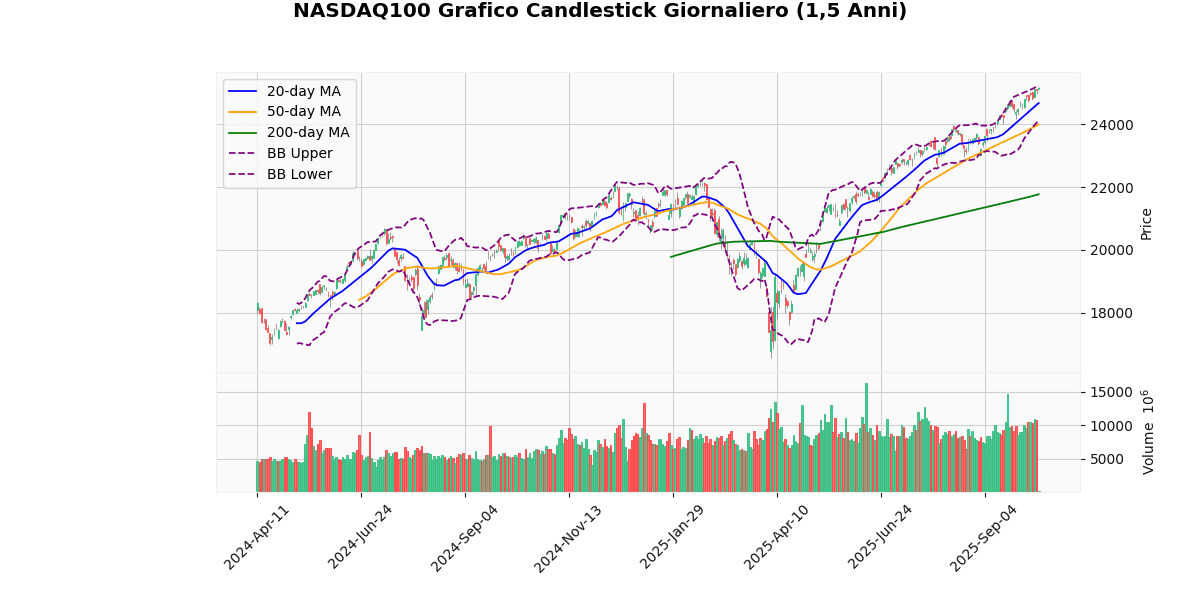
The NASDAQ100 index is currently priced at 25,162.26, showing a modest increase of 0.26% today. This movement places the index just below its upper Bollinger Band (25,235.36) and above its 20-day moving average (MA20) of 24,680.26, indicating a potential near-term resistance level.
The index has been showing a strong upward trend as evidenced by its position relative to its moving averages: it is 1.95% above the MA20, 4.87% above the 50-day moving average (MA50) of 23,994.86, and significantly, 15.58% above the 200-day moving average (MA200) of 21,771.17. This suggests a solid bullish momentum over the medium to long term.
The Relative Strength Index (RSI) at 70.01 is on the threshold of the overbought territory, which could signal a potential pullback or consolidation in the near term if the index does not manage to push past the current levels. The Moving Average Convergence Divergence (MACD) at 330.34, above its signal line at 314.01, supports the ongoing bullish sentiment but also warrants caution for a possible reversal if the index starts to decline.
The index is currently trading near its 52-week and year-to-date high of 25,195.3, marked just recently, indicating strong recent performance but also potential resistance. The Average True Range (ATR) of 229.53 suggests moderate volatility.
In summary, while the NASDAQ100 shows robust bullish signals across several metrics, the proximity to its upper Bollinger Band, an RSI nearing overbought levels, and trading near all-time highs could lead to increased volatility or a short-term correction. Investors should watch for any MACD crossovers or significant moves outside the Bollinger Bands for further directional clues.
Technical Metrics
| Metric | Value |
|---|---|
| Current Price | 25162.26 |
| Today’s Change (%) | 0.26 |
| 20-day MA | 24680.26 |
| % from 20-day MA | 1.95 |
| 50-day MA | 23994.86 |
| % from 50-day MA | 4.87 |
| 200-day MA | 21771.17 |
| % from 200-day MA | 15.58 |
| Bollinger Upper | 25235.36 |
| % from BB Upper | -0.29 |
| Bollinger Lower | 24125.16 |
| % from BB Lower | 4.30 |
| RSI (14) | 70.01 |
| MACD | 330.34 |
| MACD Signal | 314.01 |
| 3-day High | 25195.30 |
| % from 3-day High | -0.13 |
| 3-day Low | 24882.35 |
| % from 3-day Low | 1.12 |
| 52-week High | 25195.30 |
| % from 52-week High | -0.13 |
| 52-week Low | 16542.20 |
| % from 52-week Low | 52.11 |
| YTD High | 25195.30 |
| % from YTD High | -0.13 |
| YTD Low | 16542.20 |
| % from YTD Low | 52.11 |
| ATR (14) | 229.53 |
The NASDAQ100 index exhibits a bullish trend as indicated by its current price of 25,162.26, which is positioned above all key moving averages (MA20, MA50, MA200). This suggests a strong upward momentum over short, medium, and long-term periods. The index is trading near its upper Bollinger Band and slightly below the 52-week and year-to-date highs, indicating potential resistance around the 25,195.3 level.
The Relative Strength Index (RSI) at 70.01 is on the brink of the overbought territory, which could signal a possible pullback or consolidation in the near term. The MACD value of 330.34 above its signal line at 314.01 supports the ongoing bullish sentiment but also warrants caution for potential overextension.
Volatility, as measured by the Average True Range (ATR) of 229.53, remains relatively high, suggesting that significant price movements could still occur. The immediate support and resistance levels are identified at the recent three-day low of 24,882.35 and the upper Bollinger Band at 25,235.36, respectively.
Overall, the technical outlook for NASDAQ100 remains positive, but traders should be mindful of the high volatility and the proximity to overbought conditions, which could lead to increased market sensitivity to new information or broader market shifts.
RUSSELL2000 Technical Analysis

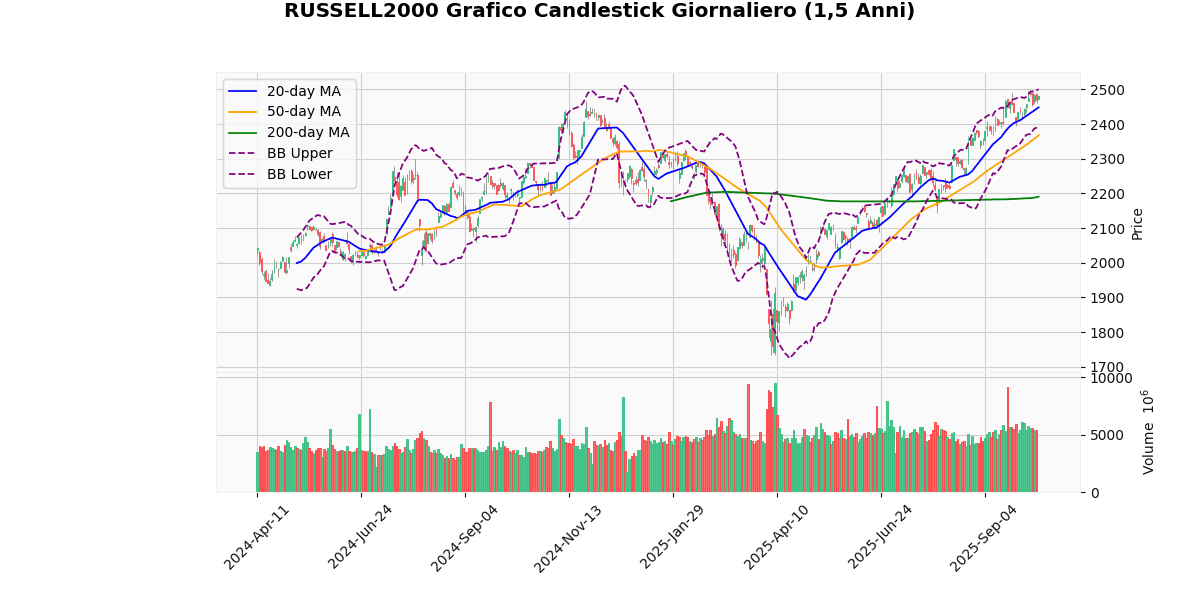
The Russell 2000 index currently stands at 2480.78, marking a modest increase of 0.48% today. This performance is particularly notable as it hovers near its 52-week and year-to-date high of 2501.92, suggesting a strong bullish trend.
Analyzing the moving averages, the index is positioned above all key averages (20-day at 2448.02, 50-day at 2367.43, and 200-day at 2190.44), indicating sustained upward momentum over short, medium, and long-term periods. The distances from these averages (1.34% from the 20-day MA, 4.79% from the 50-day MA, and 13.25% from the 200-day MA) reinforce the strength of the current uptrend.
The Bollinger Bands show the index nearing the upper band (2500.1), which typically suggests a potential resistance area. However, the index’s proximity to this band also underscores the ongoing bullish pressure.
The Relative Strength Index (RSI) at 62.09 is neither in the overbought nor oversold territory, but it leans towards a higher side, indicating a relatively strong buying momentum without immediate concerns of overvaluation.
The Moving Average Convergence Divergence (MACD) at 29.74, with a signal line at 31.32, is showing a slight convergence, which might hint at a potential slowdown or reversal in the bullish momentum if a crossover occurs. This needs to be monitored closely.
The Average True Range (ATR) at 29.51 reflects moderate volatility, aligning with the recent price range fluctuations between the 3-day high of 2490.75 and low of 2458.67.
In summary, the Russell 2000 displays robust bullish signals across several indicators, with the index trading near its peak levels. Investors should watch for potential resistance near the upper Bollinger Band and any MACD crossovers that might suggest a shift in momentum. The proximity to the 52-week high also adds a psychological resistance level that could influence short-term movements.
Technical Metrics
| Metric | Value |
|---|---|
| Current Price | 2480.78 |
| Today’s Change (%) | 0.48 |
| 20-day MA | 2448.02 |
| % from 20-day MA | 1.34 |
| 50-day MA | 2367.43 |
| % from 50-day MA | 4.79 |
| 200-day MA | 2190.44 |
| % from 200-day MA | 13.25 |
| Bollinger Upper | 2500.10 |
| % from BB Upper | -0.77 |
| Bollinger Lower | 2395.93 |
| % from BB Lower | 3.54 |
| RSI (14) | 62.09 |
| MACD | 29.74 |
| MACD Signal | 31.32 |
| 3-day High | 2490.75 |
| % from 3-day High | -0.40 |
| 3-day Low | 2458.67 |
| % from 3-day Low | 0.90 |
| 52-week High | 2501.92 |
| % from 52-week High | -0.84 |
| 52-week Low | 1732.99 |
| % from 52-week Low | 43.15 |
| YTD High | 2501.92 |
| % from YTD High | -0.84 |
| YTD Low | 1732.99 |
| % from YTD Low | 43.15 |
| ATR (14) | 29.51 |
The technical outlook for the Russell 2000 index suggests a positive trend as it trades above its key moving averages (20-day, 50-day, and 200-day), indicating sustained upward momentum. Currently, the index is positioned near the upper Bollinger Band, slightly below its 52-week and year-to-date highs, which could act as a resistance level around 2500.1 to 2501.92. The proximity to these highs, coupled with a Bollinger Band width that suggests moderate market volatility, points to potential consolidation or a minor pullback in the short term.
The RSI at 62.09 reflects neither overbought nor oversold conditions, suggesting that there is still room for upward movement without immediate concerns of a reversal due to overextension. The MACD is slightly below its signal line, indicating a potential slowdown in the bullish momentum, but not a definitive turn.
Support levels might be found near the lower Bollinger Band at 2395.93 and further down at the 20-day moving average of 2448.02. The Average True Range (ATR) of 29.51 indicates that volatility is relatively stable, supporting the likelihood of continued adherence to these technical patterns.
Overall, market sentiment appears bullish with a watchful eye on resistance near the index’s recent highs. Investors should monitor these levels for signs of either a breakout or a rejection, which could dictate the short-term directional bias.


