US Indices Surge, Russell2000 Leads Gains
DJIA Technical Analysis
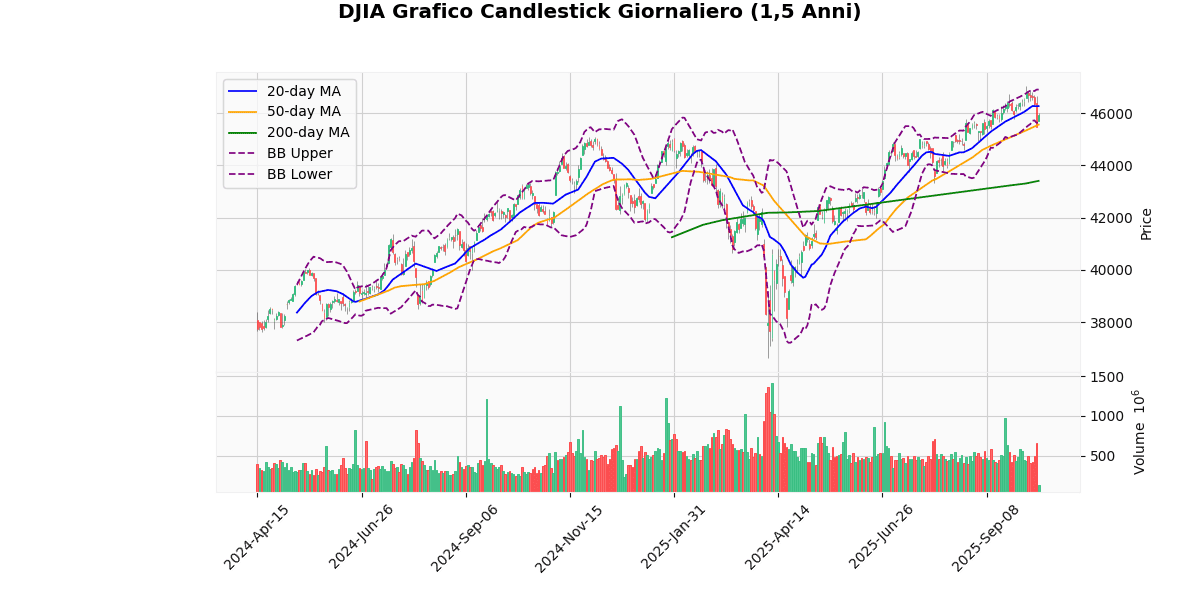
The DJIA is currently positioned at 45972.76, reflecting a modest increase of 1.08% today. Analyzing the moving averages, the index is trading below the 20-day moving average (MA20) of 46268.38 but above the 50-day (MA50) at 45559.46 and significantly above the 200-day (MA200) at 43406.49. This suggests a short-term downward trend but a strong performance in the medium to long term.
The Bollinger Bands indicate the index is trading closer to the lower band (45643.15) than the upper (46893.62), which typically signals a potential increase if it does not breach the lower band. The Relative Strength Index (RSI) at 48.68 is near the neutral 50 mark, indicating neither overbought nor oversold conditions, suggesting a lack of strong momentum in either direction.
The Moving Average Convergence Divergence (MACD) at 164.0 is below its signal line at 275.81, indicating bearish momentum as it represents a negative divergence. This could suggest a potential continuation of the recent downward trend unless a crossover occurs.
The index’s current price is near the lower end of its 3-day range, between 45470.72 and 46684.41, and has seen a significant annual range from 36611.78 to 47049.64. The Average True Range (ATR) of 442.16 points to moderate volatility.
In summary, while the DJIA shows robust gains over the year, recent performance indicates a slight bearish trend with potential for reversal if it respects the lower Bollinger Band and if the MACD reverses upwards. Investors should watch for these signals for potential changes in the trend.
Technical Metrics
| Metric | Value |
|---|---|
| Current Price | 45972.76 |
| Today’s Change (%) | 1.08 |
| 20-day MA | 46268.38 |
| % from 20-day MA | -0.64 |
| 50-day MA | 45559.46 |
| % from 50-day MA | 0.91 |
| 200-day MA | 43406.49 |
| % from 200-day MA | 5.91 |
| Bollinger Upper | 46893.62 |
| % from BB Upper | -1.96 |
| Bollinger Lower | 45643.15 |
| % from BB Lower | 0.72 |
| RSI (14) | 48.68 |
| MACD | 164.00 |
| MACD Signal | 275.81 |
| 3-day High | 46684.41 |
| % from 3-day High | -1.52 |
| 3-day Low | 45470.72 |
| % from 3-day Low | 1.10 |
| 52-week High | 47049.64 |
| % from 52-week High | -2.29 |
| 52-week Low | 36611.78 |
| % from 52-week Low | 25.57 |
| YTD High | 47049.64 |
| % from YTD High | -2.29 |
| YTD Low | 36611.78 |
| % from YTD Low | 25.57 |
| ATR (14) | 442.16 |
The technical outlook for the DJIA indicates a mixed sentiment with a slight bearish inclination in the short term. The index is currently trading at 45972.76, which is below the 20-day moving average (MA20) of 46268.38 and above the 50-day (MA50) and 200-day (MA200) moving averages, suggesting a consolidation phase with potential downside risk. The proximity to MA20 and the middle Bollinger Band (also at 46268.38) indicates potential resistance near these levels.
The Bollinger Bands show the index trading closer to the lower band (45643.15), which could act as a short-term support level. The RSI at 48.68 is near the neutral 50 mark, indicating neither overbought nor oversold conditions, while the MACD below its signal line suggests bearish momentum is currently stronger.
The Average True Range (ATR) of 442.16 points to moderate volatility, supporting the potential for significant price movements. Key support and resistance levels are identified at the recent 3-day low of 45470.72 and the 3-day high of 46684.41, respectively.
Overall, the DJIA’s position relative to its moving averages, alongside the current MACD and RSI readings, suggests cautious trading with a watchful eye on established support and resistance thresholds for clearer directional cues.
S&P500 Technical Analysis
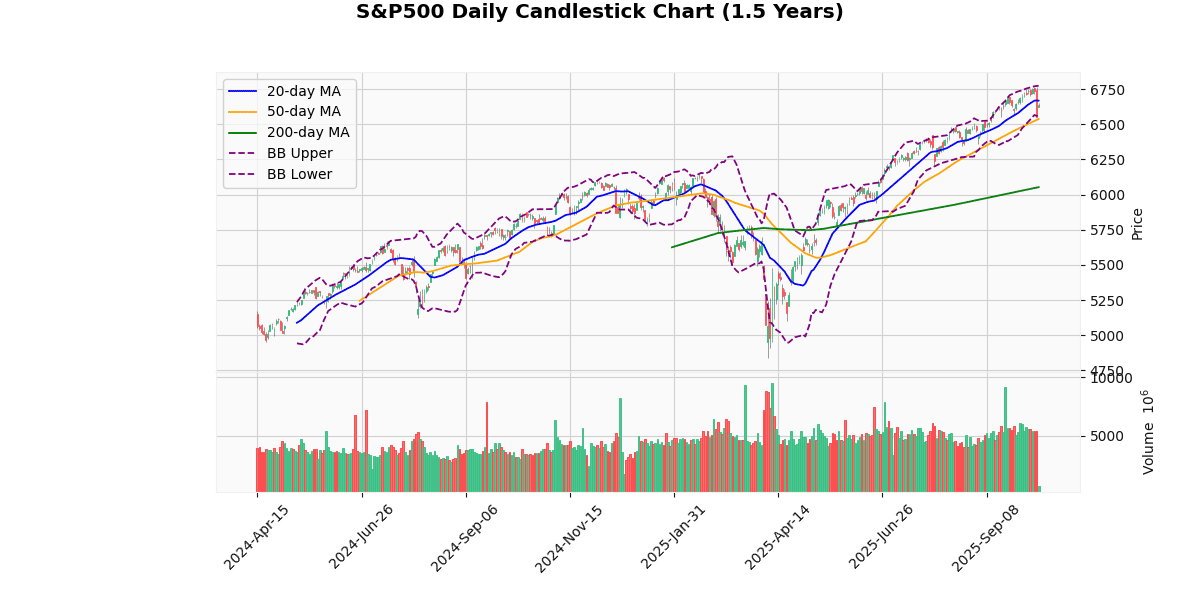
The S&P 500 index is currently priced at 6637.35, reflecting a modest increase of 1.29% today. Analyzing its position relative to various moving averages, the index is slightly below the 20-day moving average (MA20) of 6668.3 but above both the 50-day (MA50) at 6537.8 and the 200-day (MA200) at 6052.83. This suggests a generally bullish trend in the medium to long term but indicates some recent consolidation or pullback.
The Bollinger Bands show the index near the middle band (same as MA20), with the current price closer to the lower band at 6562.19 compared to the upper at 6774.42. This proximity to the lower band could indicate potential buying opportunities if the price is perceived as relatively low.
The Relative Strength Index (RSI) at 50.99 is neutral, suggesting no immediate overbought or oversold conditions. However, the Moving Average Convergence Divergence (MACD) at 39.95 is currently below its signal line at 55.88, indicating possible bearish momentum in the short term. This could suggest a wait-and-see approach for potential downward movement before making buying decisions.
The index’s current price is near its 3-day low of 6550.78 and significantly off its 3-day high of 6764.58, which aligns with the recent high for both the 52-week and year-to-date (6764.58). This shows that the index is currently pulling back from its recent peaks.
The Average True Range (ATR) at 62.91 indicates moderate volatility, which, combined with the current price position within the Bollinger Bands and the MACD below its signal line, suggests that there might be some short-term price instability or consolidation before a clearer trend is established.
Overall, the technical indicators suggest a cautiously optimistic outlook with signs of potential short-term pullback or consolidation. Investors might look for stabilization or a positive MACD crossover as signals for more robust bullish momentum.
Technical Metrics
| Metric | Value |
|---|---|
| Current Price | 6637.35 |
| Today’s Change (%) | 1.29 |
| 20-day MA | 6668.30 |
| % from 20-day MA | -0.46 |
| 50-day MA | 6537.80 |
| % from 50-day MA | 1.52 |
| 200-day MA | 6052.83 |
| % from 200-day MA | 9.66 |
| Bollinger Upper | 6774.42 |
| % from BB Upper | -2.02 |
| Bollinger Lower | 6562.19 |
| % from BB Lower | 1.15 |
| RSI (14) | 50.99 |
| MACD | 39.95 |
| MACD Signal | 55.88 |
| 3-day High | 6764.58 |
| % from 3-day High | -1.88 |
| 3-day Low | 6550.78 |
| % from 3-day Low | 1.32 |
| 52-week High | 6764.58 |
| % from 52-week High | -1.88 |
| 52-week Low | 4835.04 |
| % from 52-week Low | 37.28 |
| YTD High | 6764.58 |
| % from YTD High | -1.88 |
| YTD Low | 4835.04 |
| % from YTD Low | 37.28 |
| ATR (14) | 62.91 |
The S&P 500’s current technical outlook presents a mixed sentiment with a slight bearish inclination. The index is trading below its 20-day moving average (MA20) at 6668.3 but above its 50-day (MA50) and 200-day (MA200) moving averages, indicating a short-term pullback within a longer-term uptrend. The proximity to the MA20 suggests potential resistance near this level.
Bollinger Bands show the index trading closer to the lower band, positioned at 6562.19, which could act as a near-term support level. The upper band at 6774.42 might serve as resistance. The relatively narrow band width indicates moderate market volatility.
The Relative Strength Index (RSI) at 50.99 and the MACD below its signal line (39.95 vs. 55.88) suggest a lack of strong momentum, with the MACD indicating a bearish crossover that could lead to further consolidation or a slight downturn.
The Average True Range (ATR) of 62.91 points to a moderate level of recent volatility, aligning with the current price fluctuations between recent highs and lows.
Overall, the S&P 500 is positioned in a delicate balance. Key support is seen around the lower Bollinger Band and the 50-day moving average, with resistance likely near the 20-day moving average and the upper Bollinger Band. Market participants should watch these levels closely for indications of the index’s next directional moves.
NASDAQ100 Technical Analysis
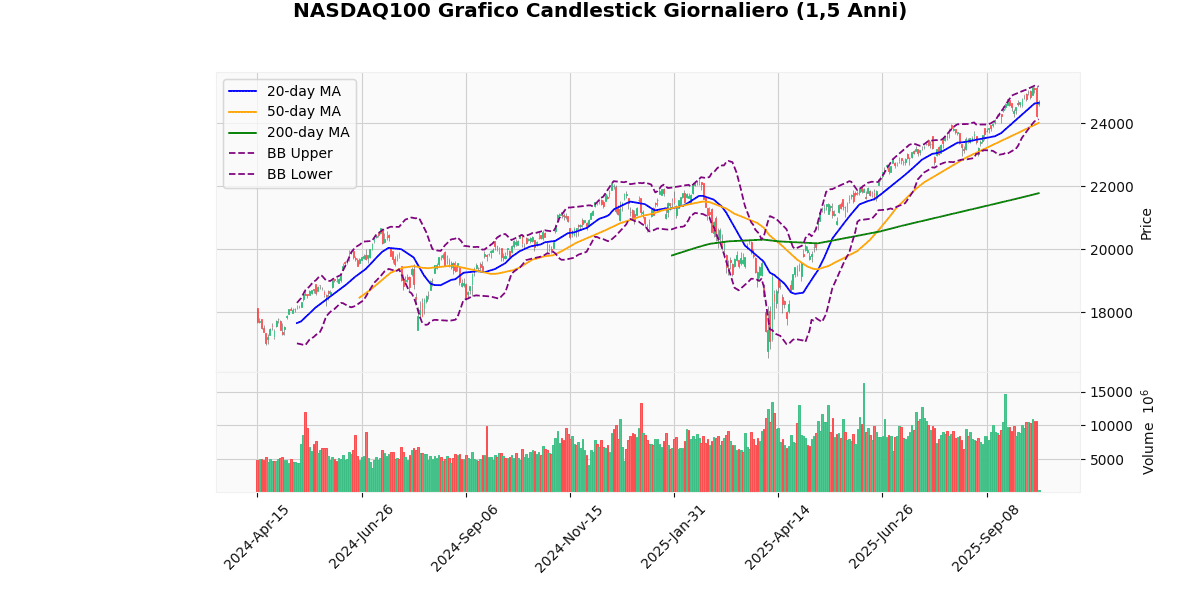
The NASDAQ100 index is currently priced at 24628.5, showing a modest increase of 1.68% today. Analyzing its position relative to various moving averages, the index is slightly below the 20-day moving average (MA20) of 24649.97, but well above both the 50-day (MA50) at 24013.35 and the 200-day (MA200) at 21782.1. This indicates a strong medium to long-term uptrend, though the slight dip below the MA20 suggests a potential short-term consolidation or pullback.
The Bollinger Bands reveal that the current price is hovering near the middle band (also the MA20), with recent prices reaching the upper band at 25170.27, suggesting high volatility. The index’s price is within the typical range but approached the upper band recently, indicating potential overbuying.
The Relative Strength Index (RSI) at 53.38 is neutral, suggesting that the index is neither overbought nor oversold at the moment. However, the Moving Average Convergence Divergence (MACD) at 229.64 is below its signal line at 285.13, indicating a bearish crossover that could suggest a downward momentum in the short term.
Recent trading has seen the index fluctuating between a 3-day high of 25195.28 and a low of 24207.15, with the current price closer to the high, reflecting recent bullish behavior but also nearing a potential resistance level from the recent high.
The Average True Range (ATR) at 308.41 points to high volatility, which is consistent with the wide range between the recent 3-day high and low, as well as the proximity to the upper Bollinger Band.
In summary, while the NASDAQ100 shows robust growth over the medium and long term, the recent bearish MACD crossover and the proximity to the upper Bollinger Band could signal a short-term pullback or consolidation. Investors should watch for potential shifts in momentum or further signs of overbuying in this volatile environment.
Technical Metrics
| Metric | Value |
|---|---|
| Current Price | 24628.50 |
| Today’s Change (%) | 1.68 |
| 20-day MA | 24649.97 |
| % from 20-day MA | -0.09 |
| 50-day MA | 24013.35 |
| % from 50-day MA | 2.56 |
| 200-day MA | 21782.10 |
| % from 200-day MA | 13.07 |
| Bollinger Upper | 25170.27 |
| % from BB Upper | -2.15 |
| Bollinger Lower | 24129.67 |
| % from BB Lower | 2.07 |
| RSI (14) | 53.38 |
| MACD | 229.64 |
| MACD Signal | 285.13 |
| 3-day High | 25195.28 |
| % from 3-day High | -2.25 |
| 3-day Low | 24207.15 |
| % from 3-day Low | 1.74 |
| 52-week High | 25195.28 |
| % from 52-week High | -2.25 |
| 52-week Low | 16542.20 |
| % from 52-week Low | 48.88 |
| YTD High | 25195.28 |
| % from YTD High | -2.25 |
| YTD Low | 16542.20 |
| % from YTD Low | 48.88 |
| ATR (14) | 308.41 |
The NASDAQ100 index exhibits a mixed technical outlook as it hovers near its 20-day moving average (MA20) at 24649.97, slightly below the current price of 24628.5. This proximity to the MA20, along with the index being well above its 50-day (MA50) and 200-day (MA200) moving averages, suggests a generally bullish mid to long-term trend.
The Bollinger Bands indicate a narrowing range with the current price close to the middle band, suggesting a period of consolidation. The upper and lower bands are positioned at 25170.27 and 24129.67, respectively, which could act as short-term resistance and support levels.
The Relative Strength Index (RSI) at 53.38 points to a neutral market sentiment without immediate overbought or oversold conditions. However, the Moving Average Convergence Divergence (MACD) below its signal line (229.64 vs. 285.13) suggests some bearish momentum in the near term.
Volatility, measured by the Average True Range (ATR) of 308.41, remains relatively high, indicating that significant price movements could still occur. This is supported by the recent price action, which has seen the index fluctuating between a 3-day high of 25195.28 and a 3-day low of 24207.15.
Overall, the NASDAQ100’s technical indicators suggest a cautiously optimistic outlook with potential resistance near the recent highs around 25195.28 and support at the lower Bollinger Band. Investors should watch for a decisive breakout or breakdown from these levels to gauge the index’s next directional move.
RUSSELL2000 Technical Analysis
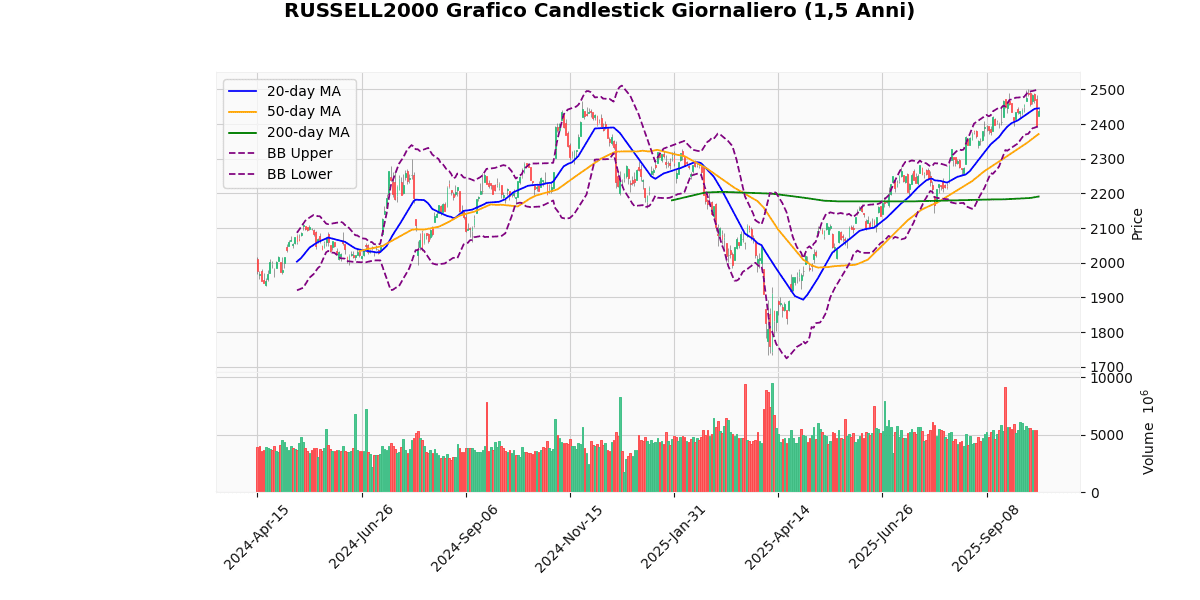
The Russell 2000 Index, currently at 2436.75, has shown a modest increase of 1.76% today. Analyzing its position relative to various moving averages and other technical indicators provides insights into its potential future movements.
**Moving Averages:**
– The index is slightly below the 20-day moving average (MA20) of 2445.29, indicating a potential resistance in the short term. However, it remains well above both the 50-day (MA50) at 2371.1 and the 200-day (MA200) at 2191.01, suggesting a strong medium to long-term upward trend.
**Bollinger Bands:**
– The current price is nearing the lower Bollinger Band (2393.35), which might indicate a buying opportunity as the price could be considered relatively low. The bands are moderately wide, suggesting some level of volatility.
**Relative Strength Index (RSI) and MACD:**
– The RSI at 52.27 is neutral, indicating neither overbought nor oversold conditions. This suggests that there is room for movement in either direction without immediate pressure from RSI extremes.
– The MACD at 20.33 is below its signal line at 28.02, showing a bearish crossover. This could indicate potential downward momentum in the near term.
**Additional Metrics:**
– The index is currently below its 3-day high of 2490.75 and above its 3-day low of 2393.85, showing recent fluctuations within this range.
– The proximity to the 52-week and YTD highs (2501.92) suggests that the index is testing upper resistance levels established over the last year.
– The Average True Range (ATR) of 36.52 points to a moderate level of daily volatility.
**Conclusion:**
The Russell 2000 is positioned in a generally bullish trend over the medium to long term, supported by its standing above the MA50 and MA200. However, the recent bearish MACD crossover and its position just under the MA20 and near the lower Bollinger Band suggest potential short-term consolidation or pullback before further upward movement. Investors should watch for whether the index can sustain above these key moving averages and how it reacts to the Bollinger Band levels to adjust their positions accordingly.
Technical Metrics
| Metric | Value |
|---|---|
| Current Price | 2436.75 |
| Today’s Change (%) | 1.76 |
| 20-day MA | 2445.29 |
| % from 20-day MA | -0.35 |
| 50-day MA | 2371.10 |
| % from 50-day MA | 2.77 |
| 200-day MA | 2191.01 |
| % from 200-day MA | 11.22 |
| Bollinger Upper | 2497.22 |
| % from BB Upper | -2.42 |
| Bollinger Lower | 2393.35 |
| % from BB Lower | 1.81 |
| RSI (14) | 52.27 |
| MACD | 20.33 |
| MACD Signal | 28.02 |
| 3-day High | 2490.75 |
| % from 3-day High | -2.17 |
| 3-day Low | 2393.85 |
| % from 3-day Low | 1.79 |
| 52-week High | 2501.92 |
| % from 52-week High | -2.60 |
| 52-week Low | 1732.99 |
| % from 52-week Low | 40.61 |
| YTD High | 2501.92 |
| % from YTD High | -2.60 |
| YTD Low | 1732.99 |
| % from YTD Low | 40.61 |
| ATR (14) | 36.52 |
The technical outlook for the Russell 2000 index suggests a moderately bullish sentiment with some caution due to recent price movements and indicators. Currently trading at 2436.75, the index is slightly below the 20-day moving average (MA20) of 2445.29, indicating a potential resistance level nearby. However, it remains well above both the 50-day (MA50) and 200-day (MA200) moving averages, which are positive signs for longer-term momentum.
The Bollinger Bands show the index hovering near the middle band (also the MA20), with the upper and lower bands at 2497.22 and 2393.35, respectively. This positioning suggests some room for movement within the bands without indicating extreme volatility. The Relative Strength Index (RSI) at 52.27 does not signal overbought or oversold conditions, supporting a stable market sentiment.
The MACD, currently at 20.33, below its signal line at 28.02, suggests a bearish crossover that may call for caution among bullish investors. The Average True Range (ATR) of 36.52 points to a moderate level of recent volatility, aligning with the market’s uncertainty.
Key support and resistance levels to watch are the recent 3-day low at 2393.85 and the 3-day high at 2490.75, respectively. The proximity to the 52-week high also suggests that reaching new highs could face resistance around these levels.
Overall, while the market shows strength from a longer-term perspective, short-term indicators suggest cautious optimism, with attention needed for potential shifts in momentum or increased volatility.
Disclaimer
The content on MarketsFN.com is provided for educational and informational purposes only. It does not constitute financial advice, investment recommendations, or trading guidance. All investments involve risks, and past performance does not guarantee future results. You are solely responsible for your investment decisions and should conduct independent research and consult a qualified financial advisor before acting. MarketsFN.com and its authors are not liable for any losses or damages arising from your use of this information.


