FX Today, Geopolitical Tensions Rise, USD/CHF Declines Amid Mixed Signals
📰 Forex and Global Market News
**Market Overview:**
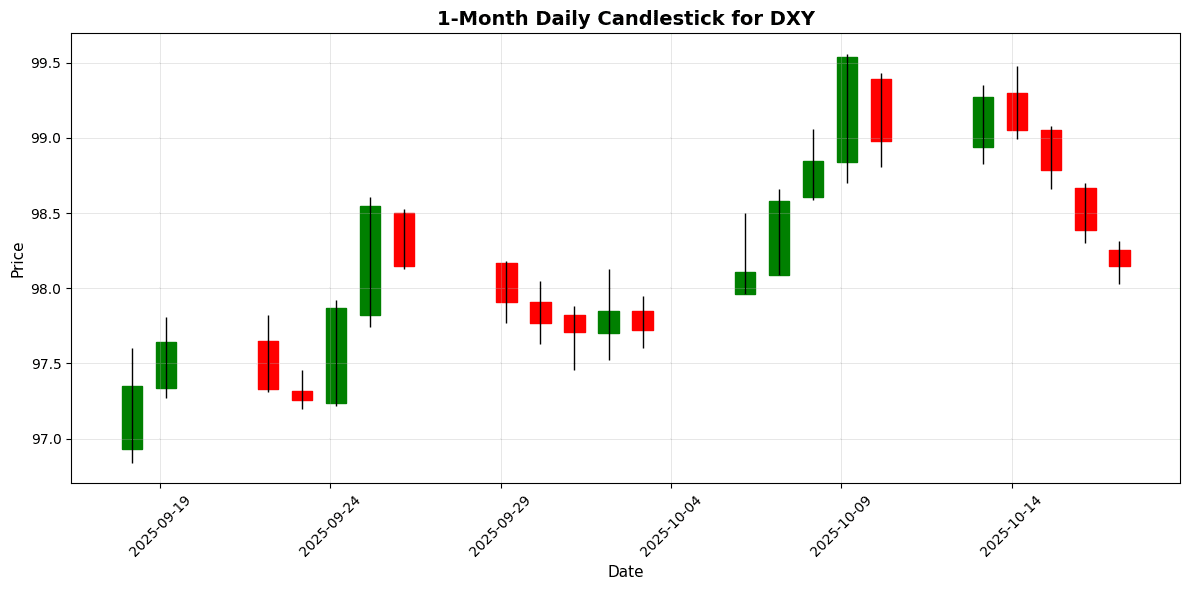
Today’s forex market reflects a cautious sentiment amid geopolitical tensions and mixed economic signals. The U.S. dollar (USD) traded slightly lower, with the DXY index at 98.15 (-0.0367%). The euro (EUR) gained ground against the Canadian dollar (CAD) as political stability in France improved, while the Japanese yen (JPY) remained stable following comments from the Bank of Japan (BoJ) regarding moderate economic recovery.
**Key News Items:**
The EUR/CAD strengthened to near 1.6460 as the French government survived a no-confidence vote, alleviating some political uncertainty in the Eurozone. Meanwhile, BoJ Deputy Governor Uchida indicated that the central bank would consider rate hikes if economic conditions are met, supporting the yen’s stability. In the U.S., ongoing concerns surrounding the health of regional banks are contributing to market anxiety, impacting the USD’s performance.
Geopolitical developments, including Trump’s planned meeting with Putin to discuss the Ukraine conflict, are adding to market volatility. Commodity prices are also in focus, with gold experiencing significant fluctuations, trading near $4,380, and silver maintaining close to record highs at $54.30 amid safe-haven demand.
**Closing:**
Overall, the forex market is navigating through a complex landscape of economic data, geopolitical tensions, and commodity price movements, influencing currency valuations and investor sentiment.
📅 Economic Calendar Events Today
All times are in US Eastern Time (ET)
| Date | Time | Cur | Imp | Event | Actual | Forecast |
|---|---|---|---|---|---|---|
| 2025-10-17 | 02:45 | 🇪🇺 | Medium | German Buba Balz Speaks | ||
| 2025-10-17 | 02:45 | 🇪🇺 | Medium | German Buba President Nagel Speaks | ||
| 2025-10-17 | 05:00 | 🇪🇺 | Medium | Core CPI (YoY) (Sep) | 2.3% | |
| 2025-10-17 | 05:00 | 🇪🇺 | High | CPI (YoY) (Sep) | 2.2% | |
| 2025-10-17 | 05:00 | 🇪🇺 | Medium | CPI (MoM) (Sep) | 0.1% | |
| 2025-10-17 | 05:35 | 🇬🇧 | Medium | BoE MPC Member Pill Speaks | ||
| 2025-10-17 | 08:30 | 🇨🇦 | Medium | Foreign Securities Purchases (Aug) | 11.61B | |
| 2025-10-17 | 08:45 | 🇪🇺 | Medium | German Buba Mauderer Speaks | ||
| 2025-10-17 | 08:45 | 🇪🇺 | Medium | German Buba President Nagel Speaks | ||
| 2025-10-17 | 09:15 | 🇺🇸 | Medium | Industrial Production (YoY) (Sep) | ||
| 2025-10-17 | 09:15 | 🇺🇸 | Medium | Industrial Production (MoM) (Sep) | 0.1% | |
| 2025-10-17 | 10:00 | 🇺🇸 | Medium | Business Inventories (MoM) (Aug) | 0.1% | |
| 2025-10-17 | 10:00 | 🇺🇸 | Medium | Retail Inventories Ex Auto (Aug) | 0.3% | |
| 2025-10-17 | 13:00 | 🇺🇸 | Medium | U.S. Baker Hughes Oil Rig Count | ||
| 2025-10-17 | 13:00 | 🇺🇸 | Medium | U.S. Baker Hughes Total Rig Count | ||
| 2025-10-17 | 16:00 | 🇺🇸 | Medium | TIC Net Long-Term Transactions (Aug) |
**Overview:**
Today’s economic calendar features several key events that could significantly impact forex markets, particularly focusing on inflation data from the Eurozone and various speeches from central bank officials. Notably, the German CPI data will be closely scrutinized.
**Key Releases:**
1. **German CPI (YoY) (Sep)**: The forecast was 2.2%. Traders will watch closely for the actual release, as any deviation could influence the EUR.
2. **Core CPI (YoY) (Sep)**: Expected at 2.3%. A higher-than-expected figure could strengthen the EUR, while a lower reading may raise concerns about inflationary pressures.
3. **U.S. Industrial Production (MoM) (Sep)**: Forecast at 0.1%. This release could affect USD pairs, particularly if the actual figure deviates significantly.
4. **Retail Inventories Ex Auto (Aug)**: Forecasted at 0.3%. This data will provide insights into consumer demand trends in the U.S.
**FX Impact:**
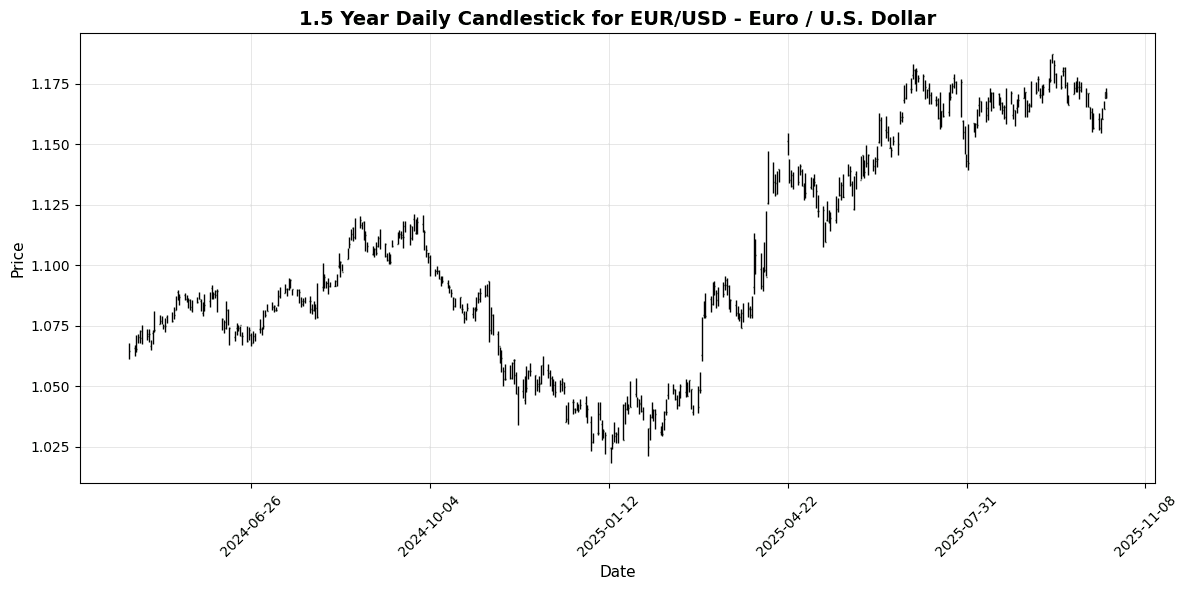
The EUR/USD pair is likely to experience volatility based on the German CPI results. A stronger CPI could bolster the euro, while weaker data may lead to a sell-off. The USD could react to U.S. industrial production data, influencing pairs like USD/JPY and GBP/USD. Overall, traders should prepare for potential market shifts based on these critical releases.
💱 Major Currency Pairs
| Name | Symbol | Price | Daily (%) | 5D (%) | 1W (%) | 1M (%) | 3M (%) | 6M (%) | YTD (%) | 12M (%) | MA50 | MA100 | MA200 | RSI | MACD |
|---|---|---|---|---|---|---|---|---|---|---|---|---|---|---|---|
| EUR/USD – Euro / U.S. Dollar | EURUSD | 1.1715 | +0.1539 | +1.2844 | +1.2844 | -1.3175 | +0.8568 | +2.7921 | +12.58 | +7.8483 | 1.1693 | 1.1650 | 1.1240 | 50.82 | -0.0022 |
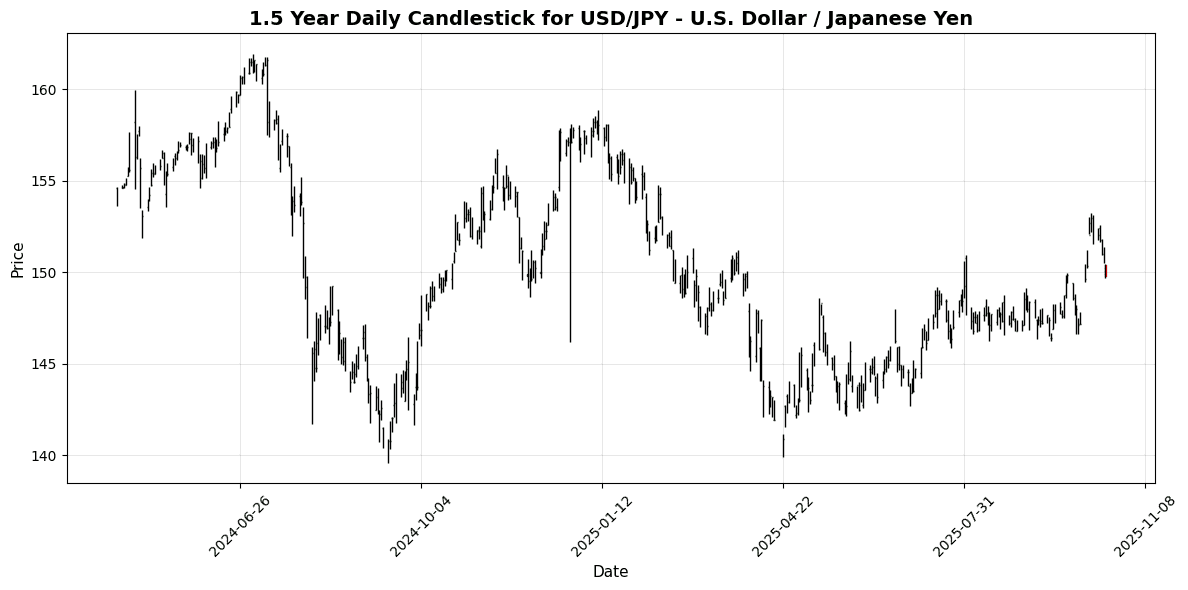
| USD/JPY – U.S. Dollar / Japanese Yen | USDJPY | 149.79 | -0.3042 | -2.0724 | -2.0724 | +2.3099 | +0.9115 | +5.5430 | -4.5861 | +0.1464 | 148.47 | 147.19 | 148.11 | 51.61 | 0.9589 |
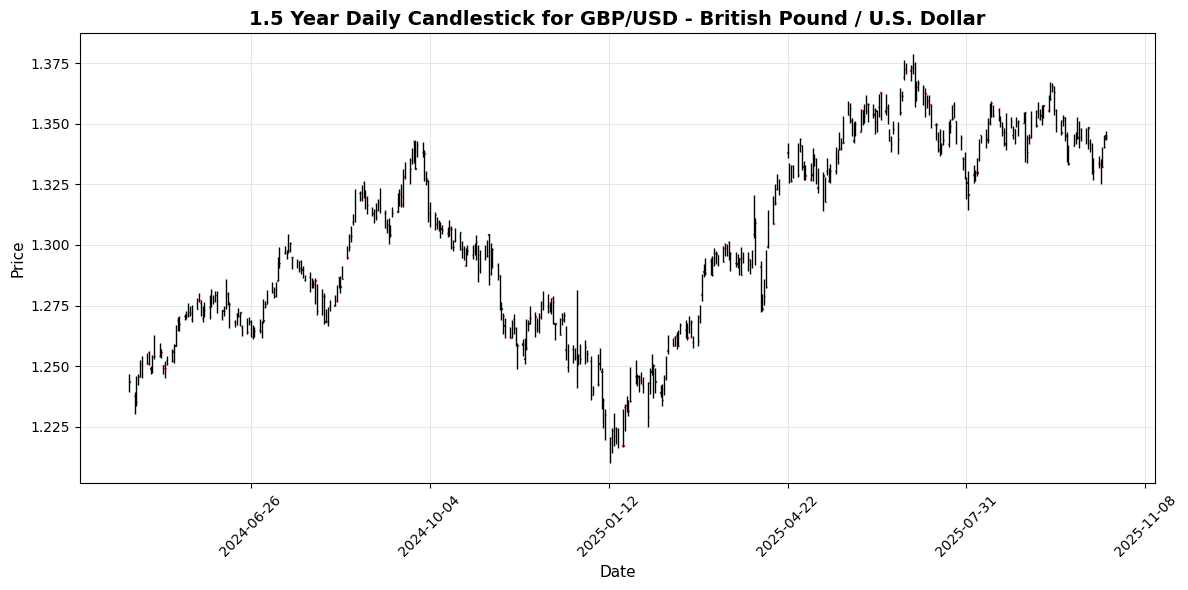
| GBP/USD – British Pound / U.S. Dollar | GBPUSD | 1.3454 | +0.1191 | +1.1203 | +1.1203 | -1.4643 | +0.1596 | +1.6625 | +7.2109 | +3.5702 | 1.3476 | 1.3493 | 1.3183 | 54.34 | -0.0030 |
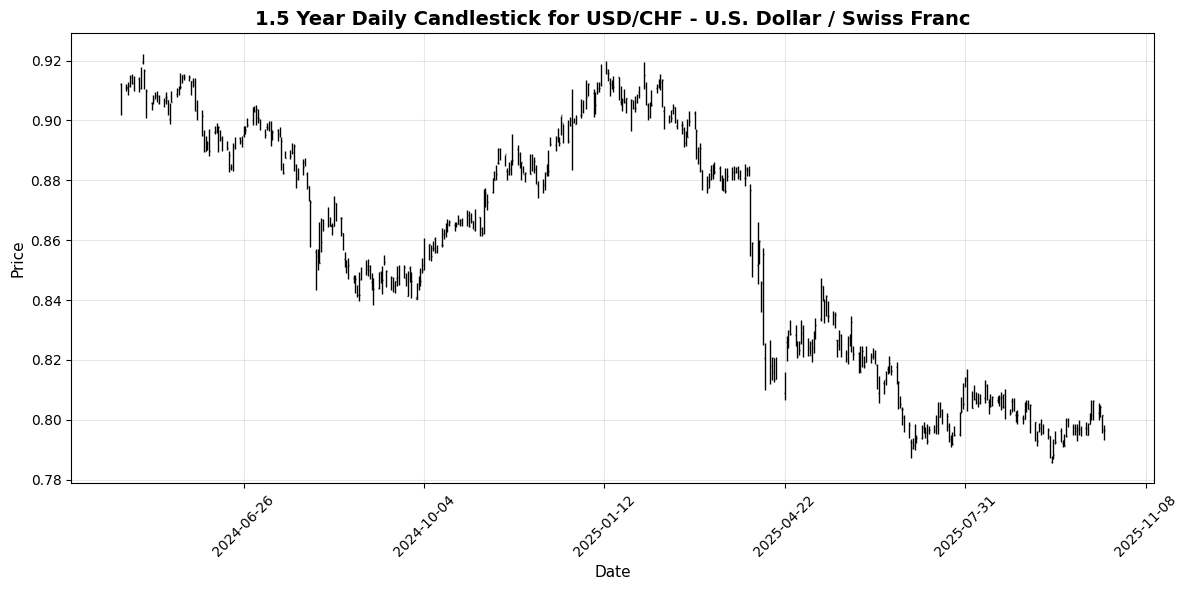
| USD/CHF – U.S. Dollar / Swiss Franc | USDCHF | 0.7892 | -0.3913 | -2.1050 | -2.1050 | +0.4186 | -1.7039 | -3.0169 | -12.63 | -8.7946 | 0.8003 | 0.8032 | 0.8377 | 44.53 | 0.0007 |
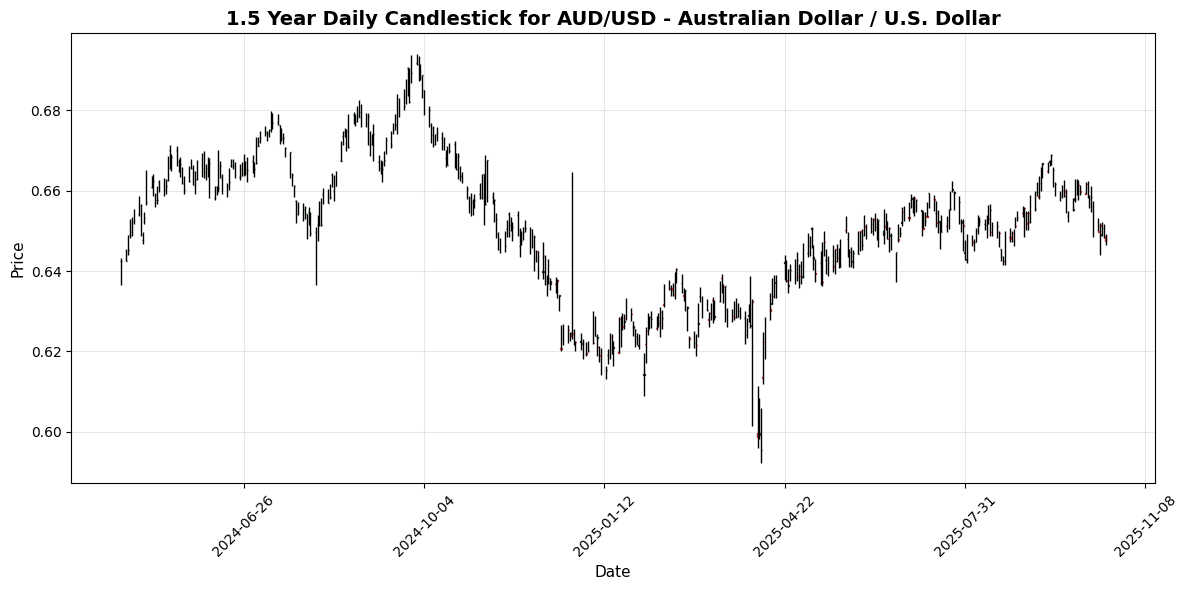
| AUD/USD – Australian Dollar / U.S. Dollar | AUDUSD | 0.6475 | -0.1850 | -1.3152 | -1.3152 | -3.1993 | -0.3569 | +1.6005 | +4.0997 | -2.8491 | 0.6555 | 0.6537 | 0.6425 | 37.52 | -0.0020 |
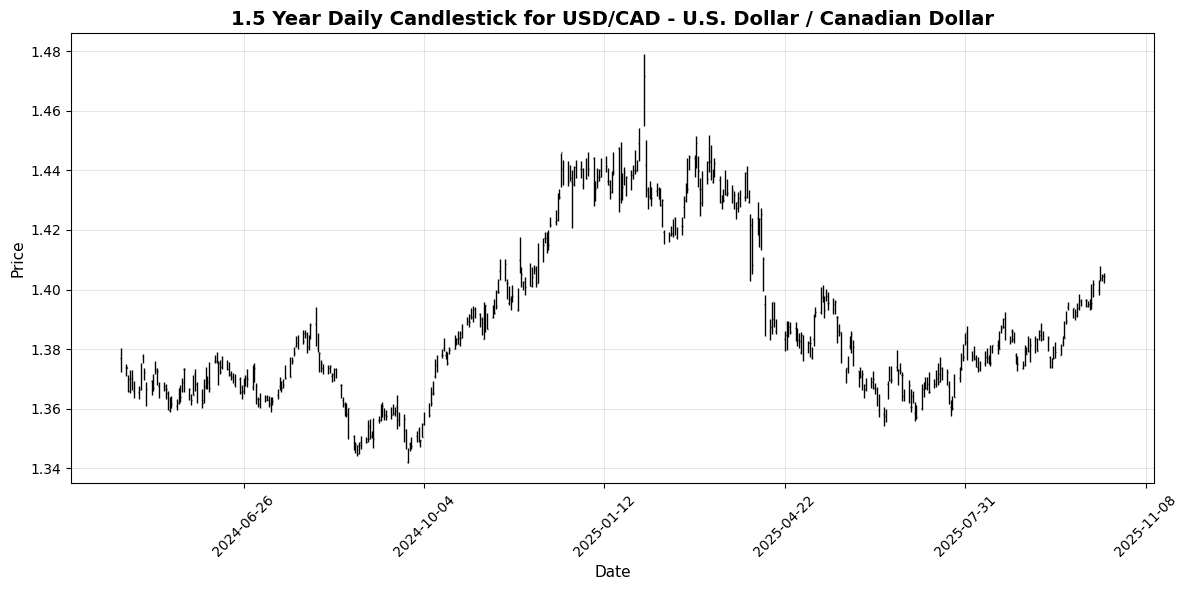
| USD/CAD – U.S. Dollar / Canadian Dollar | USDCAD | 1.4047 | 0.0000 | +0.2012 | +0.2012 | +2.2433 | +2.2649 | +1.3514 | -2.1101 | +2.1229 | 1.3856 | 1.3773 | 1.3976 | 72.51 | 0.0057 |
| NZD/USD – New Zealand Dollar / U.S. Dollar | NZDUSD | 0.5735 | +0.1397 | -0.3114 | -0.3114 | -4.2475 | -3.5212 | -3.3761 | +1.6896 | -5.3427 | 0.5861 | 0.5933 | 0.5849 | 39.95 | -0.0043 |

**Overview:**
The Majors FX group exhibits a mixed trend direction today, with some pairs showing bullish momentum while others remain bearish. The overall sentiment leans slightly towards the dollar strength, particularly against the CAD and JPY.
**Key Pairs:**
1. **USD/CAD:** Currently at 1.4047, this pair is notable for its strong bullish signal, with an RSI of 72.51 indicating overbought conditions. The positive MACD of 0.0057 confirms bullish momentum, suggesting potential for a pullback or consolidation near current levels.
2. **USD/JPY:** Priced at 149.7950, this pair shows a neutral-bullish stance with an RSI of 51.61 and a strong MACD of 0.9589. This suggests continued upward momentum, but traders should watch for resistance around 150.00.
3. **AUD/USD:** At 0.6475, this pair is weaker, indicated by an RSI of 37.52 (oversold) and a negative MACD of -0.0020. This suggests potential for further downside, especially if it breaks below support at 0.6450.
**Trading Implications:**
For USD/CAD, traders should consider potential resistance
🔀 Cross Currency Pairs
| Name | Symbol | Price | Daily (%) | 5D (%) | 1W (%) | 1M (%) | 3M (%) | 6M (%) | YTD (%) | 12M (%) | MA50 | MA100 | MA200 | RSI | MACD |
|---|---|---|---|---|---|---|---|---|---|---|---|---|---|---|---|
| EUR/GBP | EURGBP | 0.8705 | +0.0230 | +0.1346 | +0.1346 | +0.1254 | +0.6708 | +1.0916 | +4.9820 | +4.1480 | 0.8676 | 0.8631 | 0.8520 | 35.95 | 0.0003 |
| EUR/JPY | EURJPY | 175.43 | -0.1639 | -0.8523 | -0.8523 | +0.9367 | +1.7487 | +8.4811 | +7.3703 | +8.0082 | 173.51 | 171.34 | 166.27 | 55.67 | 0.8768 |
| EUR/CHF | EURCHF | 0.9242 | -0.2375 | -0.8784 | -0.8784 | -0.9347 | -0.8954 | -0.3450 | -1.6704 | -1.6536 | 0.9356 | 0.9353 | 0.9387 | 31.41 | -0.0015 |
| EUR/AUD | EURAUD | 1.8092 | +0.3439 | +2.6368 | +2.6368 | +1.9480 | +1.2191 | +1.1303 | +8.1281 | +11.05 | 1.7835 | 1.7818 | 1.7477 | 53.47 | -0.0002 |
| GBP/JPY | GBPJPY | 201.50 | -0.1937 | -0.9833 | -0.9833 | +0.8029 | +1.0648 | +7.3114 | +2.2863 | +3.7264 | 199.97 | 198.51 | 195.10 | 59.44 | 0.9470 |
| GBP/CHF | GBPCHF | 1.0612 | -0.3100 | -1.0499 | -1.0499 | -1.0951 | -1.5950 | -1.4561 | -6.3661 | -5.5922 | 1.0783 | 1.0837 | 1.1021 | 51.37 | -0.0021 |
| AUD/JPY | AUDJPY | 96.95 | -0.5059 | -3.3910 | -3.3910 | -1.0027 | +0.5205 | +7.2502 | -0.6873 | -2.7377 | 97.28 | 96.15 | 95.13 | 51.88 | 0.5048 |
| AUD/NZD | AUDNZD | 1.1287 | -0.3179 | -1.0294 | -1.0294 | +1.0782 | +3.2559 | +5.1793 | +2.3583 | +2.6120 | 1.1176 | 1.1013 | 1.0985 | 55.49 | 0.0059 |
| CHF/JPY | CHFJPY | 189.77 | +0.0733 | +0.0269 | +0.0269 | +1.8746 | +2.6590 | +8.8542 | +9.1918 | +9.8265 | 185.44 | 183.17 | 177.13 | 60.97 | 1.2383 |
| NZD/JPY | NZDJPY | 85.89 | -0.1767 | -2.3745 | -2.3745 | -2.0427 | -2.6401 | +2.0011 | -2.9789 | -5.2020 | 87.02 | 87.29 | 86.59 | 49.41 | -0.0041 |
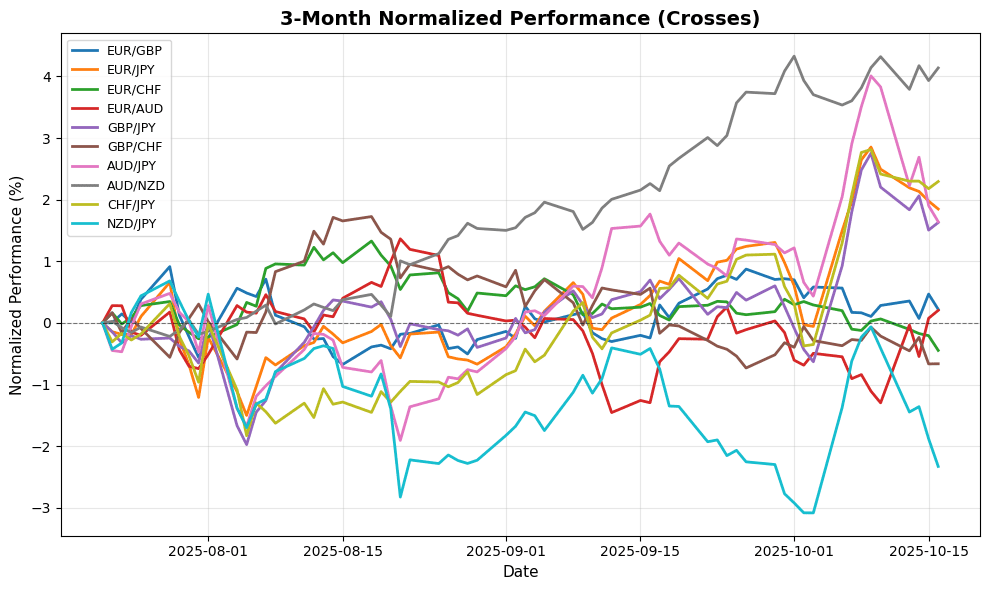
**Overview:** The Crosses FX group exhibits a mixed trend with bearish pressure evident in several pairs, particularly those with RSI levels indicating oversold conditions.
**Key Pairs:**
1. **EUR/CHF**: Currently priced at 0.9242, it shows an RSI of 31.41, indicating oversold conditions, while the MACD is negative (-0.0015), suggesting bearish momentum.
2. **GBP/JPY**: Priced at 201.5030, it has an RSI of 59.44, indicating a neutral-bullish stance, and a positive MACD (0.9470), signaling bullish momentum.
3. **CHF/JPY**: At 189.7710, it has a strong RSI of 60.97 and a robust MACD (1.2383), indicating strong bullish momentum.
**Trading Implications:** Watch for potential support at 0.9200 for EUR/CHF and resistance around 0.9300. For GBP/JPY, support
🌍 Exotic and Emerging Market Currencies
| Name | Symbol | Price | Daily (%) | 5D (%) | 1W (%) | 1M (%) | 3M (%) | 6M (%) | YTD (%) | 12M (%) | MA50 | MA100 | MA200 | RSI | MACD |
|---|---|---|---|---|---|---|---|---|---|---|---|---|---|---|---|
| USD/TRY – U.S. Dollar / Turkish Lira | USDTRY | 41.95 | +0.3010 | +0.3006 | +0.3006 | +1.5515 | +3.9969 | +9.9750 | +18.82 | +22.78 | 41.31 | 40.63 | 38.94 | 97.50 | 0.1723 |
| USD/ZAR – U.S. Dollar / South African Rand | USDZAR | 17.38 | +0.3448 | +1.0736 | +1.0736 | +0.2228 | -2.3902 | -7.4762 | -7.4005 | -1.4586 | 17.46 | 17.63 | 18.03 | 46.21 | -0.0417 |
| USD/THB – U.S. Dollar / Thai Baht | USDTHB | 32.56 | +0.1846 | -0.6408 | -0.6408 | +2.8427 | +0.2772 | -1.5720 | -4.6252 | -1.8597 | 32.25 | 32.38 | 33.04 | 63.96 | 0.1351 |
| USD/SEK – U.S. Dollar / Swedish Krona | USDSEK | 9.4195 | -0.0053 | -1.1794 | -1.1794 | +2.1301 | -3.1533 | -3.4111 | -14.55 | -10.33 | 9.4501 | 9.5121 | 9.8957 | 50.79 | 0.0212 |
| USD/NOK – U.S. Dollar / Norwegian Krone | USDNOK | 10.07 | +0.0964 | +0.0386 | +0.0386 | +3.2207 | -2.0618 | -4.6885 | -11.11 | -7.7301 | 10.03 | 10.07 | 10.44 | 55.31 | 0.0283 |
| USD/DKK – U.S. Dollar / Danish Krone | USDDKK | 6.3778 | -0.1237 | -1.1992 | -1.1992 | +1.4307 | -0.7301 | -2.6590 | -11.01 | -7.1706 | 6.3845 | 6.4085 | 6.6570 | 52.99 | 0.0170 |
| USD/MXN – U.S. Dollar / Mexican Peso | USDMXN | 18.48 | +0.2811 | +0.5199 | +0.5199 | +1.0566 | -1.4591 | -7.2120 | -10.44 | -7.1346 | 18.54 | 18.70 | 19.42 | 48.27 | -0.0187 |
| USD/PLN – U.S. Dollar / Polish Zloty | USDPLN | 3.6323 | +0.0523 | -1.3008 | -1.3008 | +1.5801 | -0.8232 | -3.1998 | -11.56 | -8.1581 | 3.6394 | 3.6551 | 3.7793 | 46.37 | 0.0093 |
| USD/HUF – U.S. Dollar / Hungarian Forint | USDHUF | 332.94 | -0.0573 | -1.4752 | -1.4752 | +1.4937 | -3.0655 | -6.8718 | -15.71 | -9.8449 | 335.69 | 340.38 | 357.27 | 48.62 | 0.5364 |
| USD/CZK – U.S. Dollar / Czech Koruna | USDCZK | 20.74 | -0.0347 | -1.4940 | -1.4940 | +1.3144 | -2.0998 | -5.4025 | -14.14 | -10.82 | 20.84 | 21.06 | 22.11 | 49.05 | 0.0360 |
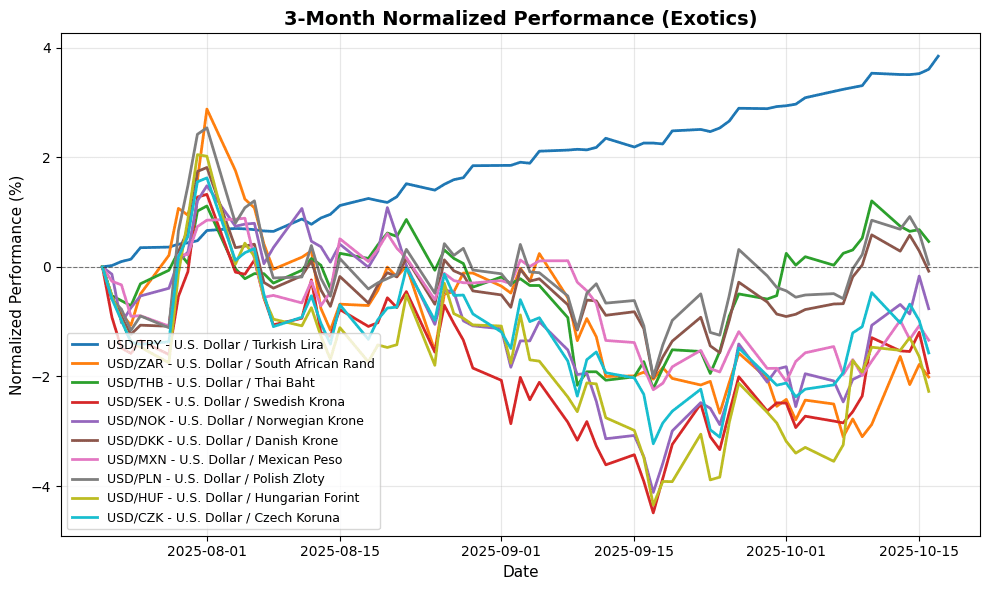
**Overview:** The Exotic FX group exhibits a mixed trend, with USD/TRY showing extreme overbought conditions while other pairs remain neutral to slightly bullish.
**Key Pairs:**
1. **USD/TRY:** Trading at 41.9482, the RSI at 97.50 indicates extreme overbought conditions, suggesting a potential reversal or correction. The MACD at 0.1723 supports bullish momentum, but caution is warranted due to the RSI level.
2. **USD/ZAR:** Currently at 17.3762, the RSI at 46.21 reflects a neutral-bearish stance, while the MACD at -0.0417 indicates bearish momentum. This pair may face selling pressure.
3. **USD/THB:** Priced at 32.5600, the RSI at 63.96 suggests bullish potential, with the MACD at 0.1351 confirming positive momentum.
**Trading Implications:** For USD/TRY, watch for resistance around 42.00 and support near
Disclaimer
The content on MarketsFN.com is provided for educational and informational purposes only. It does not constitute financial advice, investment recommendations, or trading guidance. All investments involve risks, and past performance does not guarantee future results. You are solely responsible for your investment decisions and should conduct independent research and consult a qualified financial advisor before acting. MarketsFN.com and its authors are not liable for any losses or damages arising from your use of this information.


