Weak Friday for Energy Commodities
⚡ Market Overview
Energy markets on October 17, 2025 reflect dynamic trading across crude oil, Brent, and natural gas December 2025 futures contracts. The analysis below covers market drivers, technical indicators, and trading outlook for each energy commodity.
📋 Contract Specifications
December 2025 Futures Contracts:
• CLZ25: NYMEX WTI Crude Oil (CL = Crude Light, Z = December, 25 = 2025)
• BZZ25: ICE Brent Crude (BZ = Brent, Z = December, 25 = 2025)
• NGZ25: NYMEX Natural Gas (NG = Natural Gas, Z = December, 25 = 2025)
Performance Summary
| Commodity | Contract | Price | Unit | Daily % | MA21 | MA50 | MA100 | MA200 | RSI | MACD |
|---|---|---|---|---|---|---|---|---|---|---|
| Crude Oil (WTI) | CLZ25 | $56.63 | $/barrel | -0.63% | $60.99 | $61.86 | $62.62 | $63.47 | 30.96 | -1.41 |
| Brent Oil | BZZ25 | $60.67 | $/barrel | -0.64% | $65.09 | $65.84 | $66.31 | $67.15 | 31.46 | -1.38 |
| Natural Gas | NGZ25 | $3.61 | $/MMBtu | -0.69% | $3.85 | $3.86 | $4.19 | $4.48 | 33.47 | -0.06 |
⚫ Crude Oil (WTI)
Contract: CLZ25 | Price: $56.63 $/barrel (-0.63%)

📰 Market Drivers & News
Crude oil markets opened lower today, with West Texas Intermediate (WTI) dipping below $57 per barrel amid a confluence of bearish pressures. Geopolitical tensions eased slightly as prospects of a U.S.-Russia summit raised hopes for de-escalation in Ukraine, potentially unwinding the war’s risk premium that has buoyed prices for months. This overshadowed persistent supply-demand imbalances, where robust OPEC+ production cuts are clashing with softening global demand signals from economic slowdowns in China and Europe.
U.S. inventories unexpectedly built by over 3 million barrels last week, per recent data, signaling ample supply amid steady domestic shale output hovering near record highs. Refinery utilization rates remain subdued, further pressuring margins and exacerbating oversupply fears. These dynamics have shaved roughly 1% off WTI prices in early trading, extending a weekly decline of over 2%.
Looking ahead, near-term volatility persists; any summit breakthroughs could accelerate downside, but sticky inflation and renewed supply disruptions might cap further drops, keeping WTI range-bound between $55-60 in the coming weeks.
📈 Technical Analysis
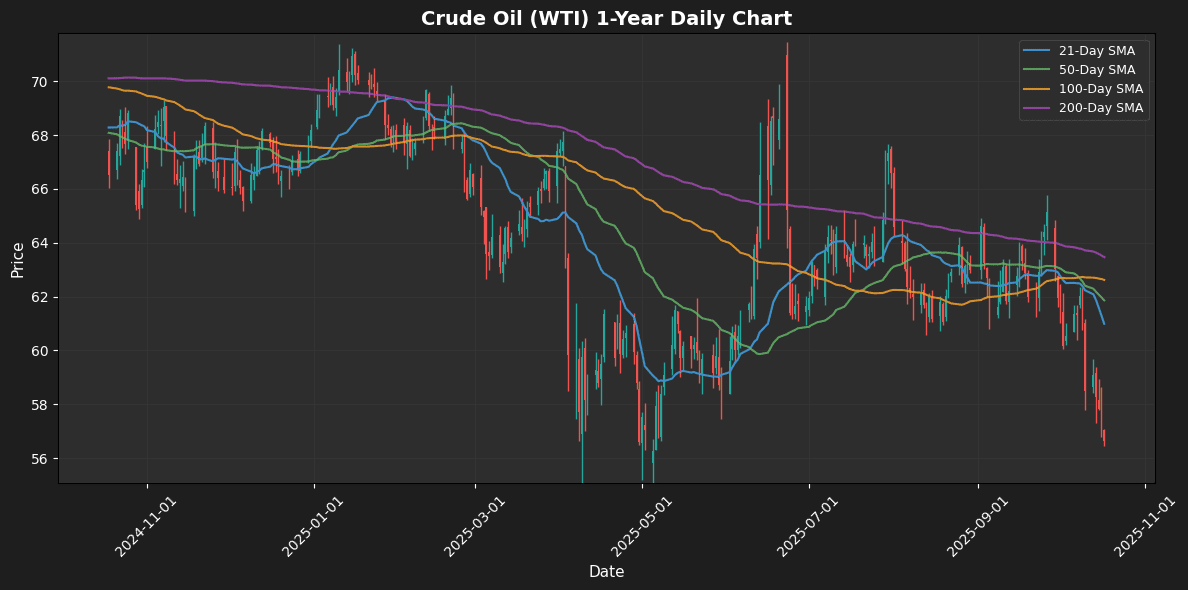
Crude Oil (WTI) is currently priced at $56.63, reflecting a daily decline of 0.63%. The instrument remains significantly below key moving averages, with MA21 at $60.99, MA50 at $61.86, MA100 at $62.62, and MA200 at $63.47. This indicates a bearish trend, as the price is substantially under all major moving averages, suggesting limited upside momentum in the near term.
The RSI is at 30.96, placing it in oversold territory, indicating potential for a price rebound if buying pressure returns. However, the MACD reading of -1.41 confirms prevailing downward momentum, further indicating that sellers remain dominant.
Traders should watch for potential support around the recent low near $55. Should prices manage to stabilize and break above the MA21, it may signal a shift towards bullish sentiment, but immediate resistance remains at the MA50 of $61.86. Caution is advised,
🟤 Brent Oil
Contract: BZZ25 | Price: $60.67 $/barrel (-0.64%)

📰 Market Drivers & News
Brent crude oil prices dipped modestly today, trading around $60 per barrel amid a cautious market sentiment. Key drivers include persistent supply overhang from OPEC+ production adjustments, where the group extended voluntary cuts but signaled potential increases later, tempering bullish expectations. Demand dynamics remain subdued, with global economic slowdowns—particularly in China—curbing consumption forecasts and pressuring refiners to draw down less aggressively.
Geopolitical tensions in the Middle East, including Red Sea disruptions, have not escalated into major supply interruptions, allowing ample rerouting via alternative paths. U.S. inventory data revealed a surprise build of over 3 million barrels last week, signaling softer demand and ample stockpiles, which exacerbated the downward pressure. Production from non-OPEC nations like the U.S. continues at record highs, flooding the market further.
This confluence has shaved about 1% off Brent prices since yesterday’s close. Near-term outlook leans bearish, with prices likely testing $58 support unless fresh demand signals or supply shocks emerge.
(Word count: 142)
📈 Technical Analysis
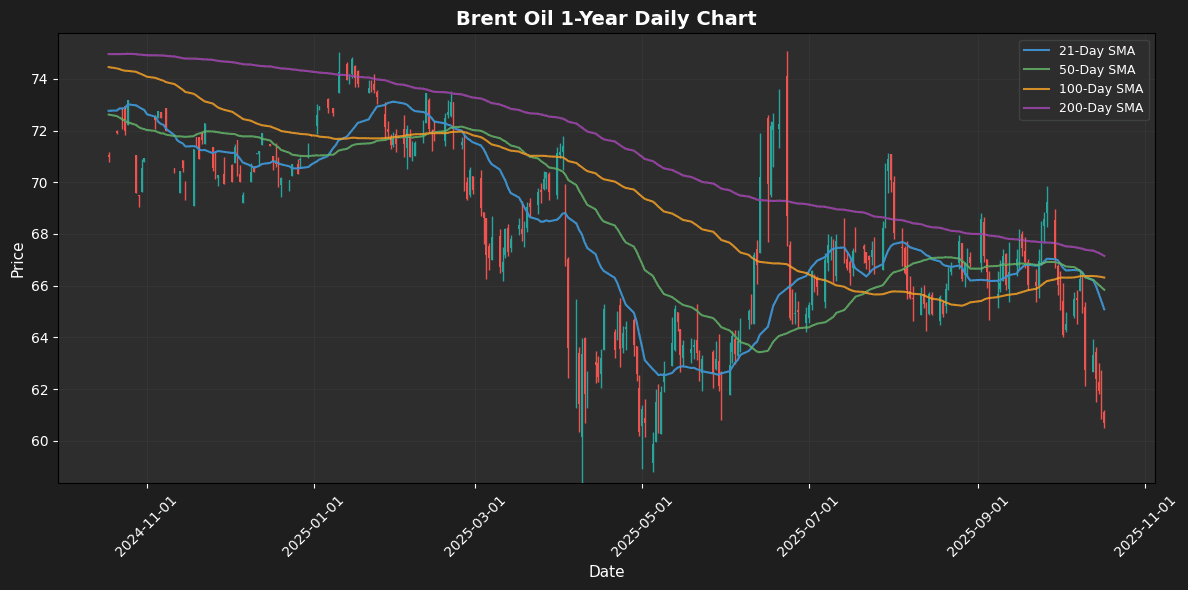
Brent Oil is currently priced at $60.67, reflecting a daily decline of 0.64%. The asset is trading well below all key moving averages (MA21: $65.09, MA50: $65.84, MA100: $66.31, MA200: $67.15), indicating a bearish momentum as it struggles to reclaim higher levels.
The RSI at 31.46 suggests that Brent is entering oversold territory, potentially indicating a reversal point soon if buying interest builds. However, with the MACD at -1.38, bearish momentum persists, suggesting further downside risk in the near term.
Traders should monitor immediate support around the psychological level of $60, while resistance has solidified around $65, corresponding to the MA21. A sustained break below $60 may lead to further declines, while a rally reclaiming the $65 level could signal a bullish reversal. Caution is advised as market sentiment remains negative.
🔵 Natural Gas
Contract: NGZ25 | Price: $3.61 $/MMBtu (-0.69%)

📰 Market Drivers & News
U.S. natural gas prices continued their downward trajectory today, with front-month futures dipping below $3 per million British thermal units amid persistent mild weather forecasts curbing residential and commercial heating demand. Supply remains robust, bolstered by steady production levels from key shale basins like the Permian, where output has held firm despite seasonal maintenance. Inventories are on pace to enter winter with a substantial surplus—currently over 10% above five-year averages—following a routine weekly injection that aligned with analyst expectations, further pressuring prices.
Demand dynamics are subdued, with lower-than-average withdrawals anticipated through late fall, while LNG export facilities operate at near-capacity, providing a modest counterbalance but not enough to stem the glut. Geopolitically, ongoing tensions in Europe have indirectly supported U.S. exports, yet domestic oversupply dominates the narrative, limiting upside potential.
In the near term, prices may stabilize around current levels if weather patterns hold mild, though any shift toward colder snaps could spark volatility and draw on stockpiles more aggressively.
📈 Technical Analysis
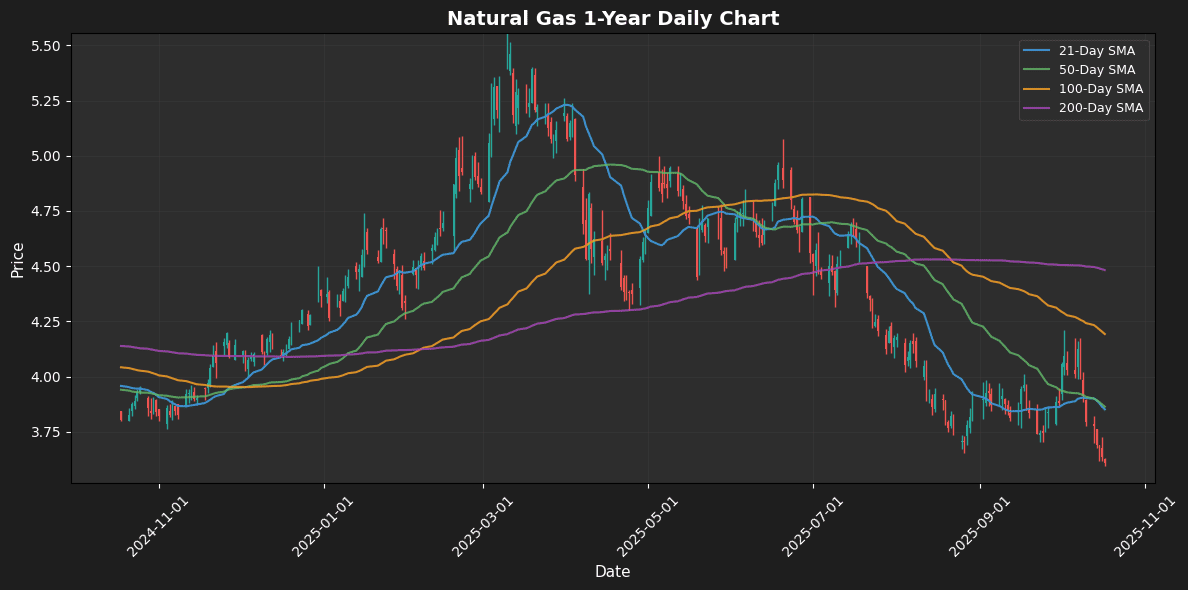
Natural Gas is currently trading at $3.61, reflecting a daily decline of 0.69%. The price remains well below key moving averages, with the MA21 at $3.85, MA50 at $3.86, and significantly lower MA100 at $4.19 and MA200 at $4.48, indicating a bearish trend.
The Relative Strength Index (RSI) at 33.47 suggests that the commodity is approaching oversold territory, potentially signaling a reversal if buying pressure increases. Meanwhile, the MACD at -0.06 reinforces the weak momentum, as both the signal and MACD lines remain below zero, indicating further bearish sentiment.
Traders should watch for potential support around $3.50, with resistance levels near the MA21 and MA50. A decisive move above $3.85 could signal a short-term bullish reversal, but caution is warranted given current momentum indicators. Overall, the outlook remains cautious, with significant resistance levels overhead.
Disclaimer
The content on MarketsFN.com is provided for educational and informational purposes only. It does not constitute financial advice, investment recommendations, or trading guidance. All investments involve risks, and past performance does not guarantee future results. You are solely responsible for your investment decisions and should conduct independent research and consult a qualified financial advisor before acting. MarketsFN.com and its authors are not liable for any losses or damages arising from your use of this information.


