State Street Corporation (STT) Post Earning Analysis
State Street Corp., founded in 1792 and headquartered in Boston, MA, specializes in providing financial services to institutional investors. The company operates through two main segments: Commercial and Financial Loans, and Commercial Real Estate Loans. Renowned for its long-standing expertise, State Street focuses on meeting the diverse financial needs of its clients globally.
State Street Corporation (NYSE: STT) recently reported its third-quarter financial results for 2025, surpassing expectations in both earnings and revenue. Despite this positive performance, the stock experienced a decline. This anomaly can be attributed to broader market conditions and possibly heightened expectations already priced into the stock. The company’s revenue rose by 9%, and there was a significant increase in fee revenue, which contributed to higher profits. These results highlight State Street’s robust financial health and operational efficiency during the quarter.
However, the financial sector, including regional banks like State Street, is currently under pressure due to concerns over bank credit, as indicated by the general downturn in market indices and specific reports on regional bank issues. This environment has likely influenced investor sentiment towards State Street, leading to a drop in its stock price despite the strong quarterly performance. This scenario underscores the impact of external market forces on individual stock performances, even when company-specific outcomes are strong.
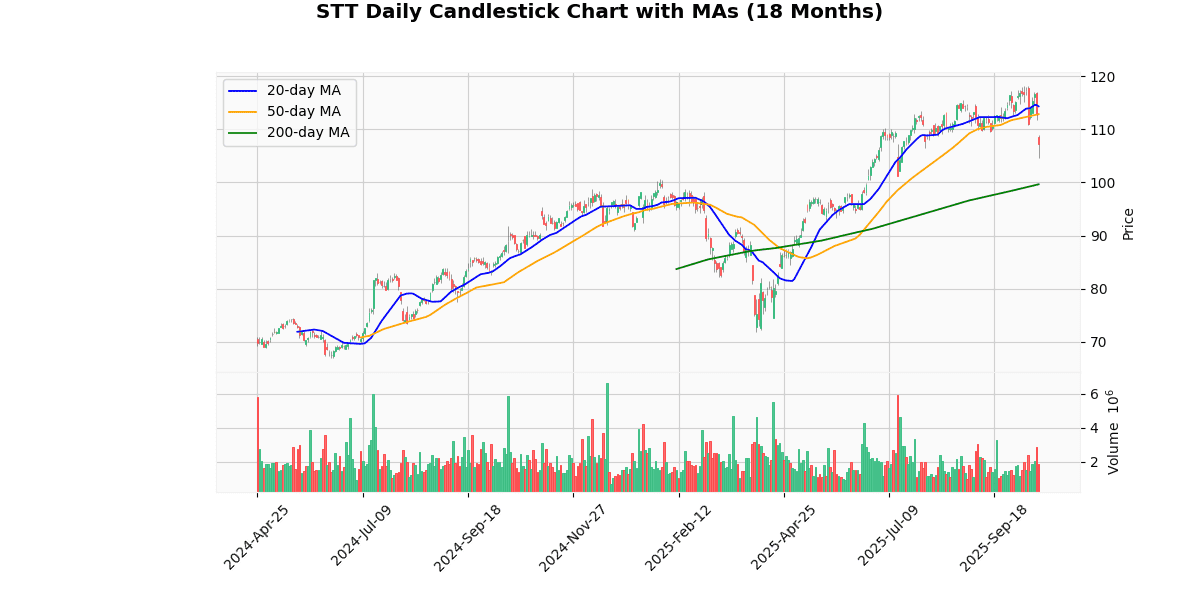
The current price of the asset at $107.33 represents a significant drop of 3.66% today. This price is notably below the recent week’s high of $117.00 and the 52-week and YTD highs of $118.24, indicating a downward shift from recent peaks. The asset’s price is currently positioned between its 52-week low of $71.77 and high, showing a recovery from the lowest values of the year but struggling to maintain its peak performance.
The price is below both the 20-day and 50-day moving averages by 6.13% and 4.9% respectively, suggesting a short-term bearish trend. However, it remains 7.71% above the 200-day moving average, indicating that the longer-term trend might still be positive.
The RSI at 37.11 points to a potential overselling situation, hinting at a possible undervaluation or a reversal point if other market conditions align. The MACD value near zero (0.03) suggests a lack of strong momentum in either direction, reflecting the current market uncertainty.
Overall, the asset is experiencing a bearish phase in the short term but holds some longer-term bullish signals, warranting close monitoring for signs of stabilization or further decline.
Price Chart

State Street Corporation announced its Q3 2025 financial results on October 17, 2025, showcasing significant growth. The company reported a 23% increase in Earnings Per Share (EPS) to $2.78, compared to $2.26 in Q3 2024. Total revenue rose by 9% to $3.545 billion from $3.259 billion in the previous year. This growth was driven by an increase in total fee revenue, which went up 8% to $2.829 billion, supported by notable gains in management fees (16%), foreign exchange trading services (11%), and securities finance (19%).
The company’s Return on Equity (ROE) improved to 13.4%, and Return on Tangible Common Equity (ROTCE) reached 20.9%. The pre-tax margin expanded to 31.1%, reflecting a 332 basis point improvement in total operating leverage. Despite a slight 1% dip in net interest income, total expenses rose by 5% to $2.434 billion, attributed mainly to investments in technology and services.
Assets under custody and administration grew by 10% to $51.7 trillion, while assets under management increased by 15% to $5.4 trillion. The company returned $637 million to shareholders, including $400 million through share repurchases and an 11% increase in dividends to $0.84 per share. The provision for credit losses decreased by 65% to $9 million, and the Common Equity Tier 1 Ratio was slightly down at 11.3%.
Earnings Trend Table
| Earnings Date | Date | Estimate EPS | Reported EPS | Surprise % |
|---|---|---|---|---|
| 2025-04-17 07:31:00-04:00 | 2025-04-17 | 2.00 | 2.04 | 1.97 |
| 2025-01-17 07:02:00-05:00 | 2025-01-17 | 2.43 | 2.60 | 6.82 |
| 2024-10-15 07:02:00-04:00 | 2024-10-15 | 2.12 | 2.26 | 6.65 |
| 2024-07-16 07:32:00-04:00 | 2024-07-16 | 2.03 | 2.15 | 6.12 |
| 2024-04-12 07:39:00-04:00 | 2024-04-12 | 1.50 | 1.69 | 13.02 |
| 2024-01-19 07:32:00-05:00 | 2024-01-19 | 1.83 | 2.04 | 11.35 |
| 2023-10-18 08:50:00-04:00 | 2023-10-18 | 1.81 | 1.93 | 6.50 |
| 2023-07-14 07:42:00-04:00 | 2023-07-14 | 2.10 | 2.17 | 3.21 |
Over the last eight quarters, the company has demonstrated a consistent pattern of surpassing EPS estimates, indicating robust financial performance and effective management strategies. A closer analysis reveals a gradual increase in both the EPS estimates and reported EPS figures, suggesting a positive growth trajectory and increasing profitability.
In the earliest quarter reported (Q3 2023), the EPS was estimated at 2.10 and reported at 2.17, surpassing the estimate by 3.21%. This trend of exceeding expectations continued consistently across subsequent quarters. Notably, the largest positive surprise occurred in Q2 2024, where the reported EPS of 1.69 exceeded the estimate of 1.50 by 13.02%. This indicates a significant outperformance that could reflect either an underestimation by analysts or an exceptional operational period for the company.
The most recent quarter (Q2 2025) shows a slight moderation in surprise percentage to 1.97%, with an EPS reported at 2.04 against an estimate of 2.00. This could suggest a stabilization in earnings predictability or a calibration of analyst expectations closer to actual performance.
Overall, the data exhibits a company in a strong financial position with a consistent ability to exceed analyst expectations, which may bolster investor confidence and influence future investment decisions.
Dividend Payments Table
| Date | Dividend |
|---|---|
| 2025-10-01 | 0.84 |
| 2025-07-01 | 0.76 |
| 2025-04-01 | 0.76 |
| 2025-01-02 | 0.76 |
| 2024-10-01 | 0.76 |
| 2024-07-01 | 0.69 |
| 2024-03-28 | 0.69 |
| 2023-12-29 | 0.69 |
The dividend data over the last eight quarters shows a clear trend of incremental growth, particularly notable in the most recent quarters. Starting from the end of 2023, the dividend was consistently set at $0.69, maintained through the first half of 2024. This period of stability suggests a cautious approach during this timeframe, possibly reflecting a strategic decision to consolidate before increasing shareholder returns.
In July 2024, there was a noticeable increase in the dividend to $0.76, marking a 10.1% rise from the previous quarter. This increase was then sustained through the subsequent three quarters, indicating a new level of confidence in the financial health or cash flow of the entity, allowing for a higher sustained payout.
The most significant increase occurred in the latest data from October 2025, where dividends rose to $0.84, an increase of 10.5% from the prior quarter rate of $0.76. This continued upward adjustment in dividends could be indicative of strong financial performance and a robust outlook, supporting higher distributions to shareholders. This trend, if continued, suggests a positive trajectory in shareholder value delivery.
The most recent rating changes for the stock in question reflect a generally positive outlook from various financial institutions.
-
BMO Capital Markets (October 3, 2025) – BMO Capital Markets initiated coverage on the stock with an “Outperform” rating and set a target price of $130. This initiation suggests a bullish outlook from BMO, indicating an expectation of the stock performing better than the broader market.
-
TD Cowen (September 25, 2025) – TD Cowen also initiated coverage, assigning a “Buy” rating. However, they did not specify a target price. The “Buy” rating implies that TD Cowen anticipates the stock will outperform in the future, recommending that investors consider purchasing shares.
-
Citigroup (September 5, 2025) – On this date, Citigroup made two significant changes. Firstly, they upgraded the stock from “Neutral” to “Buy,” with a target price set at $130. This upgrade indicates a shift in Citigroup’s valuation of the stock, moving from a stance of neutrality to a more aggressive endorsement of the stock’s potential for growth. The setting of the target price at $130 further emphasizes their positive reassessment.
-
Citigroup (September 5, 2025) – Concurrently, Citigroup resumed coverage of the stock with a “Buy” rating, again with a target price of $130. This action reaffirms their positive view and perhaps follows a period of reassessment or lack of active coverage.
Overall, these recent ratings suggest a strong consensus among analysts that the stock has robust growth prospects, with multiple financial institutions initiating or upgrading their outlooks around a similar target price of $130. This convergence on a specific target price and the positive ratings could influence investor confidence and market performance of the stock in the near term.
The current price of the stock stands at $107.33. Recent analyses from financial institutions suggest a bullish outlook, with a consensus target price around $130, as indicated by BMO Capital Markets and Citigroup. This represents a potential upside of approximately 21.1% from the current price, suggesting that analysts expect the stock to perform well in the near future.
The initiation and upgrades by notable firms such as BMO Capital Markets, TD Cowen, and Citigroup, with ratings ranging from “Buy” to “Outperform,” further reinforce a positive market sentiment towards the stock. Notably, both Citigroup’s upgrade from “Neutral” to “Buy” and their resumed coverage with a “Buy” rating at the same target price of $130, underscore a strong confidence in the stock’s potential.
This optimistic target pricing and favorable ratings indicate expected growth or a positive adjustment in the company’s market performance, although specific EPS (Earnings Per Share) and dividend trends are not detailed in the provided data, these factors typically influence such positive analyst ratings and target price settings.
Disclaimer: The information provided here is for educational and informational purposes only and should not be interpreted as financial advice, investment recommendations, or trading guidance. Markets involve risk, and past performance is not indicative of future results. You should always conduct your own research and consult with a qualified financial advisor before making any investment decisions. By acting, you accept full responsibility for your choices.


