Weekly Report: Bitcoin Drops, Gold and Nasdaq Gain
Week of October 10 – October 17, 2025
📊 Market Overview
The financial markets navigated a week of cautious optimism from October 10 to 17, 2025, as investors grappled with steady economic data tempered by escalating geopolitical risks and trade frictions. Major equity indices showed modest gains overall, with the S&P 500 rising 1.2% and the Nasdaq Composite advancing 1.5%, buoyed by resilient corporate earnings in banking and technology sectors. European stocks, however, lagged, with the STOXX 600 dipping 0.3% amid concerns over France’s credit downgrade and China’s economic slowdown. Commodities presented a mixed picture: oil prices fell 2.8% to around $72 per barrel due to an anticipated surplus, while silver surged 4.1% amid supply disruptions in India and London. Currencies remained stable, with the euro holding steady against the dollar at 1.09, reflecting balanced inflation signals. The dominant sentiment was one of guarded vigilance, as traders weighed central bank reassurances against brewing global tensions, including U.S. warnings of an imminent Hamas attack and simmering U.S.-China trade disputes.
Central bank communications dominated the monetary policy landscape this week, providing subtle hints of a dovish tilt without immediate rate shifts. On October 10, Federal Reserve Chair Jerome Powell delivered a speech emphasizing the U.S. economy’s resilience, noting that inflation had eased to 2.4% in recent readings, aligning with the Fed’s target and reducing the urgency for aggressive hikes. Powell’s remarks, which avoided committing to specific timelines for cuts, nonetheless eased market fears of overtightening, contributing to a slight dip in Treasury yields, with the 10-year note falling to 4.15%. Across the Atlantic, ECB Governing Council member Joachim Nagel struck an optimistic tone on October 17, stating that eurozone inflation was “pretty much on target” for the coming years, projecting headline figures to stabilize around 2% by mid-2026. This came amid no major rate decisions, but Nagel’s comments bolstered expectations for a potential 25-basis-point cut in December, supporting a rally in peripheral European bonds. The Bank of Japan remained on the sidelines, with no fresh interventions, though reports of Japan’s new immigration policies hinted at long-term labor boosts to combat deflationary pressures. Overall, these speeches fostered a sense of policy continuity, encouraging risk assets while keeping borrowing costs in check.
Economic data releases painted a picture of stabilization rather than acceleration, with key indicators meeting expectations and eliciting muted market reactions. On October 10, Germany’s September CPI rose 0.2% month-over-month, precisely in line with forecasts and up from August’s 0.1%, signaling controlled inflationary pressures in Europe’s largest economy. This alignment eased ECB rate-hike fears, leading to a 0.4% gain in the DAX index that day, though broader eurozone sentiment remained subdued due to fiscal worries in France. Similarly, the UK’s August GDP expanded 0.1% month-over-month, matching predictions and rebounding from July’s 0.1% contraction, underscoring a fragile recovery driven by services. The data prompted a slight strengthening of the pound to 1.31 against the dollar, but sterling’s gains were capped by ongoing scrutiny of potential ISA reforms announced by the UK Chancellor on October 17, which could reshape retail investment flows. No major U.S. indicators dropped this week, leaving focus on prior employment strength, but global releases like China’s shrinking rare-earth exports—down 15% year-over-year—highlighted supply chain vulnerabilities, pressuring industrial metals and contributing to a 1.1% decline in commodity-linked equities.
Commodities swung wildly: silver prices spiked 5.2% to $32.50 per ounce after markets in India sold out and London panicked over physical shortages, driven by industrial demand and export curbs. Oil, however, slumped on news of a billion-barrel surplus flotilla arriving globally, exacerbating China’s export boom—up 8.7% in September—that failed to offset its broader slowdown, with GDP growth forecasts trimmed to 4.6%. Currencies saw the Argentine peso weaken 3.2% versus the dollar amid volatility under President Milei’s reforms, despite unconventional U.S. support proposals critiqued by economists. Geopolitical headlines, including U.S. alerts on Hamas threats and France’s unscheduled S&P downgrade to AA from AA+, fueled a 1.5% rise in gold as a safe haven, while equity volatility indices like the VIX climbed 8% to 18.2, reflecting trader unease over bank lending risks and trade war escalations between Trump and Xi.
In summary, the week underscored economic steadiness amid rising uncertainties, with central bank dovishness supporting equities but trade and geopolitical frictions capping upside. Key takeaways include persistent inflationary control in Europe and the UK, contrasted by China’s rare-earth tensions and oil oversupply. Investors now eye next week’s U.S. retail sales data and ECB meeting minutes for clues on spending trends and policy paths, alongside any U.S.-China trade developments that could sway global growth outlooks.
📈 Indices
S&P 500
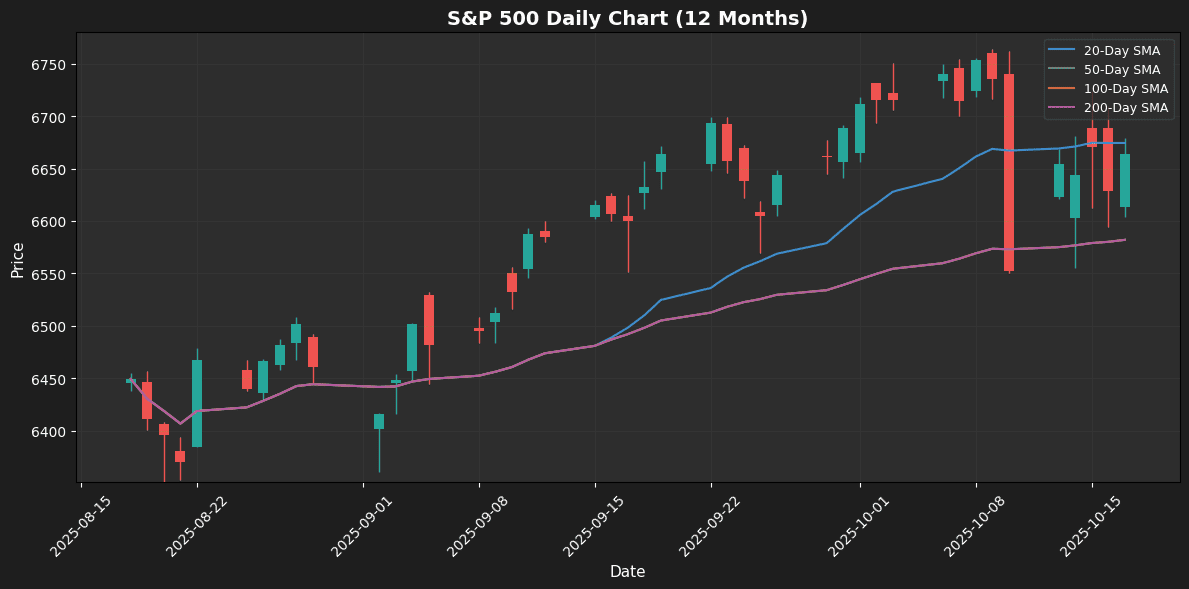
Current Price: 6664.01 | Weekly Change: +1.7016%
🔍 Technical Analysis
The S&P 500 experienced a weekly gain of 1.70%, currently priced at 6664.0098. The index is positioned just below the 20-day moving average (MA) at 6674.4225, indicating a slight resistance level as the price is -0.16% from this key indicator. In contrast, it is comfortably above both the 50-day and 200-day MAs, both at 6582.0059, by 1.25%, suggesting a bullish short- to medium-term trend. The Bollinger Bands indicate that the price is mid-range, with the upper band at 6771.5589 and the lower band at 6577.2861, reflecting potential for further volatility. The Relative Strength Index (RSI) stands at 52.62, signaling a neutral market condition, while the MACD shows bearish momentum at 29.8124, hinting at potential downward pressure. The S&P 500 is approaching its 52-week high of 6764.5801, making this a key resistance level to monitor. Support can be found at the 50-day and 200-day MAs, both at 6582.0059. Traders should watch these levels closely for potential breakouts or reversals.
Nasdaq 100
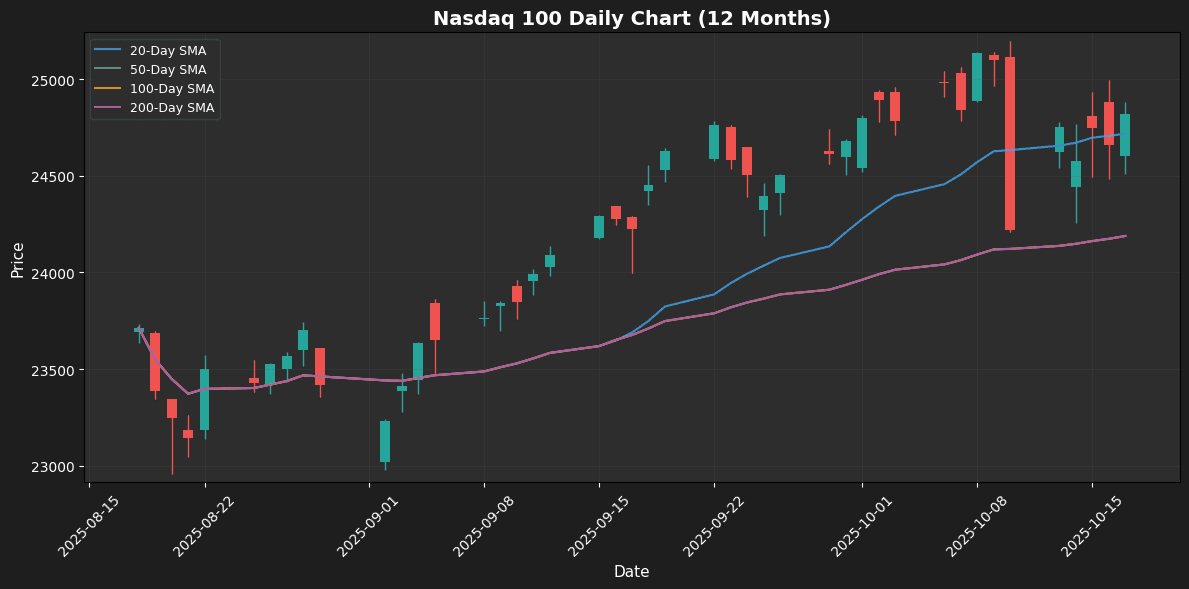
Current Price: 24817.95 | Weekly Change: +2.4615%
🔍 Technical Analysis
The Nasdaq 100 has shown a robust weekly performance, gaining 2.46% and currently trading at 24817.9492. The price is positioned above the 20-day moving average (MA) at 24717.0949 by 0.41%, indicating a short-term bullish trend. It also stands 2.60% above both the 50-day and 200-day MAs, which are aligned at 24188.7885, further confirming a positive momentum in the medium to long term.
Analyzing the Bollinger Bands, the current price is near the mid-range, with the upper band at 25153.8762 and the lower band at 24280.3137, suggesting that the market is in a consolidation phase. The Relative Strength Index (RSI) at 55.65 indicates a neutral zone, implying that the index is neither overbought nor oversold. However, the MACD at 208.5446 shows bearish momentum, hinting at potential downward pressure.
With a 52-week high of 25195.2793 and a low of 22959.6992, traders should closely watch key support at the 50-day MA and resistance at the upper Bollinger Band.
Dow Jones
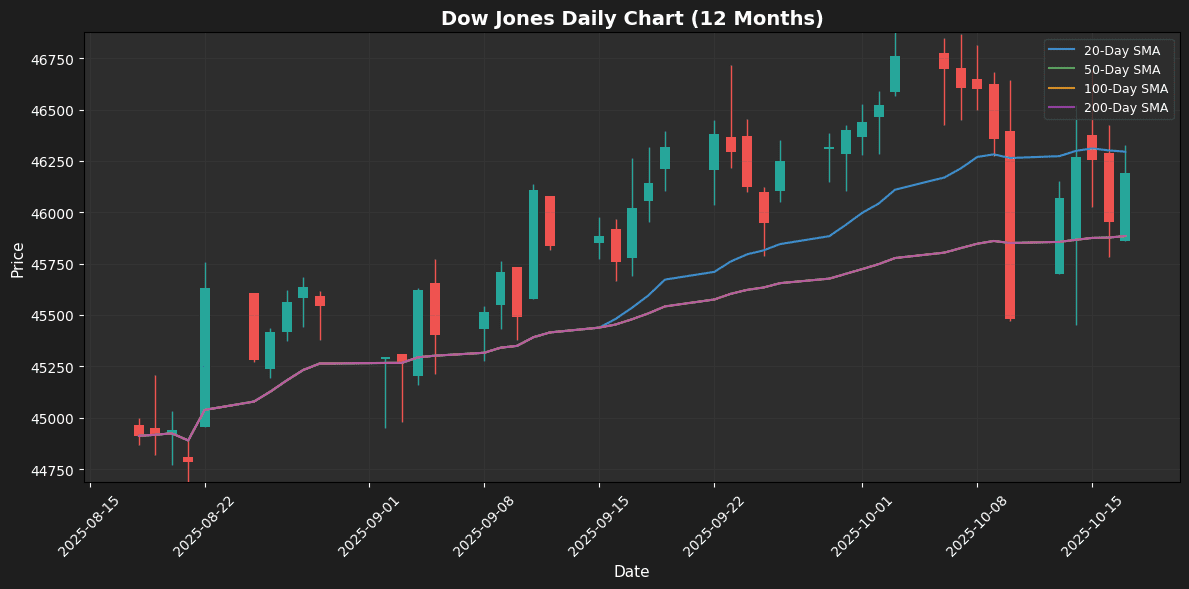
Current Price: 46190.61 | Weekly Change: +1.5634%
🔍 Technical Analysis
The Dow Jones Industrial Average experienced a weekly gain of 1.56%, currently trading at 46,190.6094. The price is slightly below the 20-week moving average (MA) at 46,294.7611, indicating a potential resistance level, while it remains above both the 50-MA and 200-MA, both positioned at 45,884.0542, suggesting a bullish short- to medium-term outlook. The Bollinger Bands reveal the index is mid-range, with the upper band at 46,870.7152 and the lower band at 45,718.8071, indicating a period of consolidation. The Relative Strength Index (RSI) is at 51.50, placing it in the neutral zone, which implies no immediate overbought or oversold conditions. However, the MACD at 107.6874 shows bearish momentum, hinting at potential downward pressure. The index is approaching its 52-week high of 47,049.6406, making it crucial to monitor for resistance at this level. Key support is identified at the 50-MA, while resistance remains at the 20-MA, shaping the near-term trading landscape.
Euro Stoxx 50
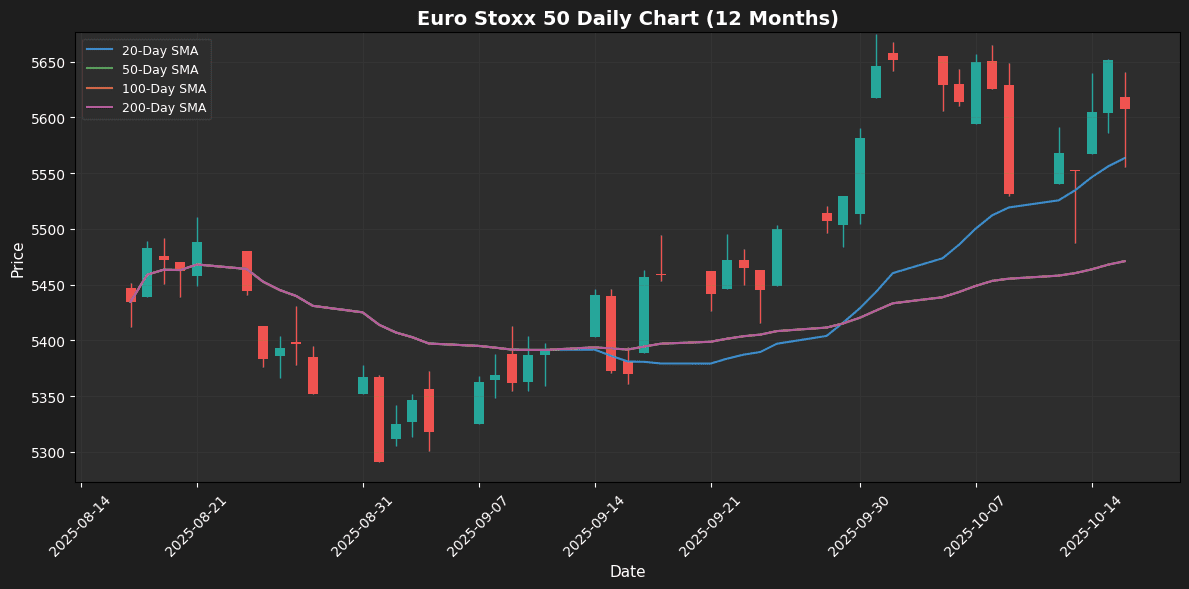
Current Price: 5607.39 | Weekly Change: +1.3753%
🔍 Technical Analysis
The Euro Stoxx 50 has shown a weekly performance increase of 1.38%, currently trading at 5607.39. The price is positioned above the 20-week moving average (MA) at 5563.64, indicating short-term bullish sentiment, while also maintaining a significant distance above the 50-MA and 200-MA, both at 5471.08, suggesting a strong upward trend. The index is currently trading within the Bollinger Bands, with the upper band at 5705.70 and the lower band at 5421.58, indicating that the price is mid-range and may be due for a breakout or consolidation.
The Relative Strength Index (RSI) stands at 57.47, reflecting a neutral zone, implying that the market is neither overbought nor oversold. However, the MACD at 46.44 indicates bearish momentum, suggesting potential downward pressure ahead. The index is approaching its 52-week high of 5674.55, which could serve as a critical resistance level. Key support to watch lies at the 20-MA and the lower Bollinger Band, while resistance is at the 52-week high.
Nikkei 225
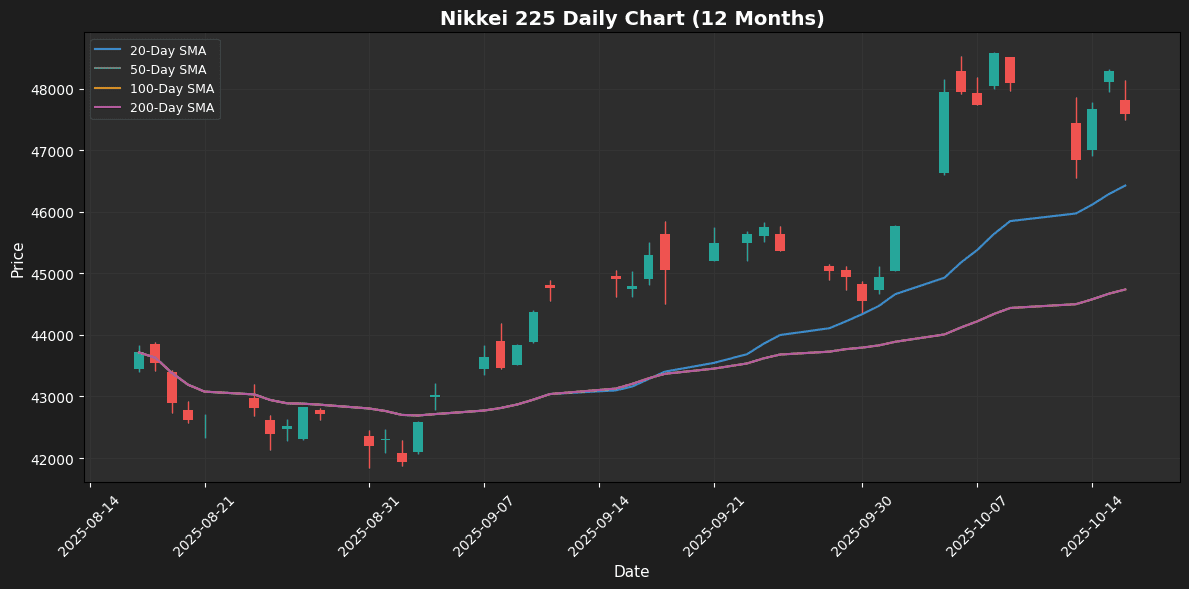
Current Price: 47582.15 | Weekly Change: -1.0536%
🔍 Technical Analysis
The Nikkei 225 experienced a weekly decline of 1.05%, closing at 47582.1484. Currently, the index is positioned above both the 20-week moving average (MA) at 46424.8168, indicating a positive short-term trend, and the 50-week and 200-week MAs, both at 44737.3790, suggesting a strong bullish stance over a longer horizon. The price is notably 2.49% above the 20-MA and 6.36% above the 50 and 200-MAs, reinforcing this bullish outlook.
In terms of volatility, the index is approaching the upper Bollinger Band at 49138.4823, with the lower band resting at 43711.1513, indicating that the market may be overbought. The Relative Strength Index (RSI) is at 60.45, reflecting a neutral zone that does not yet indicate overextension. Meanwhile, the MACD shows bullish momentum at 1162.1448, supporting the current upward trajectory. With a 52-week high of 48597.0781 and a low of 41835.1719, key support levels to watch include the 20-MA, while resistance is likely near the upper Bollinger Band.
Shanghai Composite
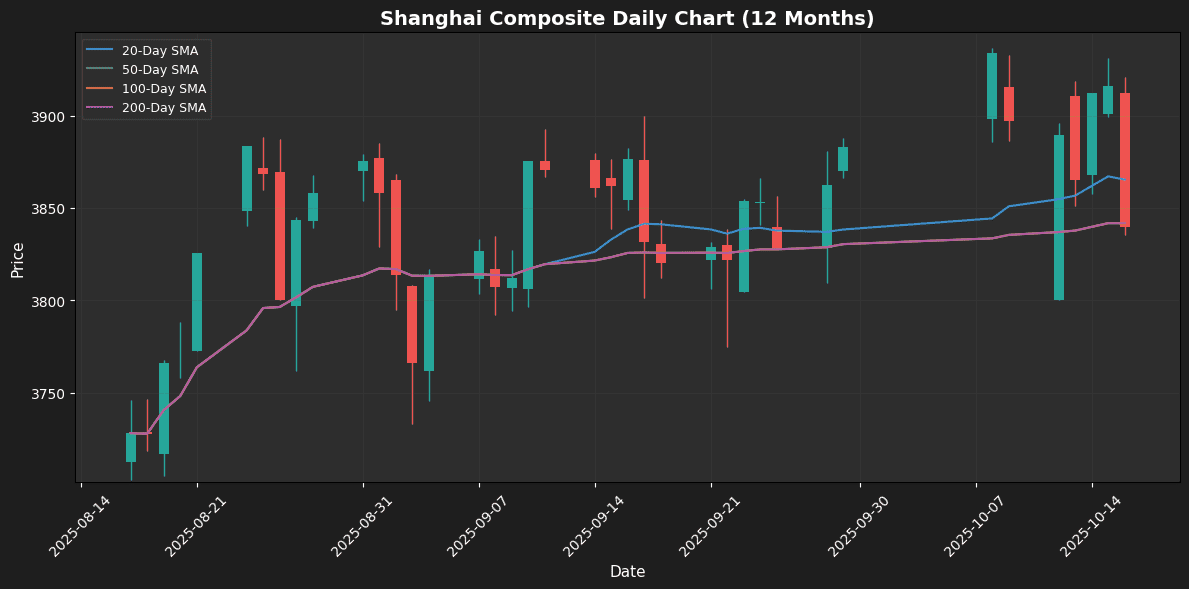
Current Price: 3839.75 | Weekly Change: -1.4697%
🔍 Technical Analysis
The Shanghai Composite Index experienced a weekly decline of 1.47%, closing at 3839.7549. The index is positioned slightly below the 20-day moving average (MA) of 3865.2872, indicating a short-term bearish sentiment, while it remains close to both the 50-day and 200-day MAs at 3841.6723, suggesting a consolidation phase. The Bollinger Bands indicate that the price is currently mid-range, with the upper band at 3929.0524 and the lower band at 3801.5220, which could imply potential volatility as the index approaches these boundaries.
The Relative Strength Index (RSI) at 47.74 is in the neutral zone, indicating that the market is neither overbought nor oversold, which may lead to further price exploration. However, the MACD reading of 17.1134 suggests bearish momentum, indicating a potential continuation of downward pressure. The index is trading near its 52-week high of 3936.5759 and low of 3702.3799. Key levels to watch include support at 3801.5220 and resistance around 3865.2872.
💱 Forex
EUR/USD
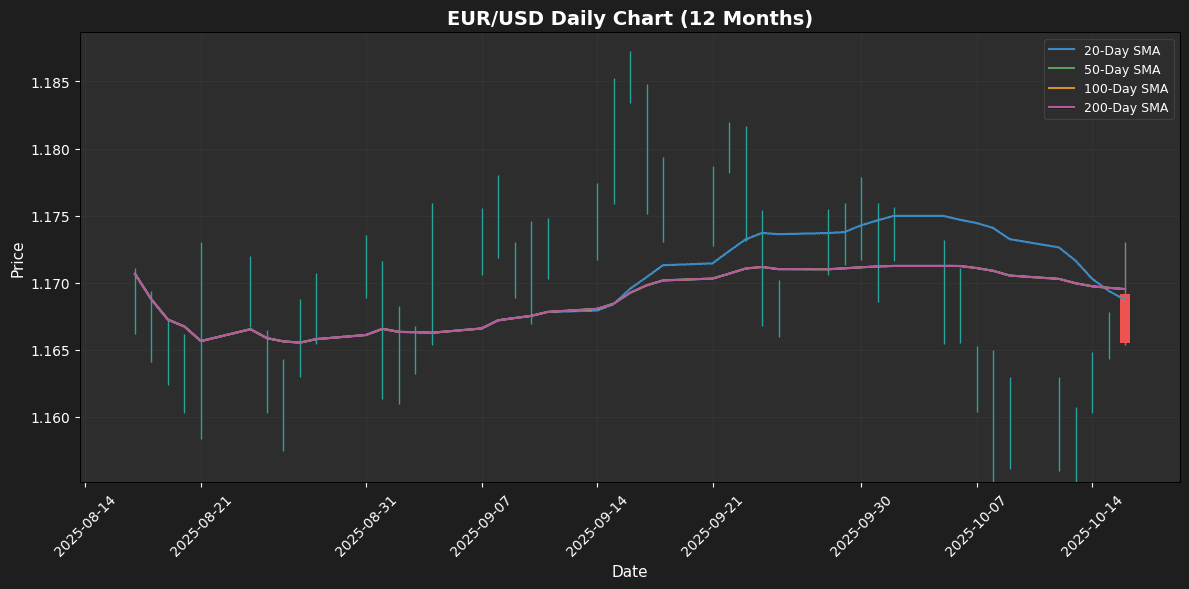
Current Price: 1.1655 | Weekly Change: +0.7695%
🔍 Technical Analysis
The EUR/USD pair has shown a weekly performance increase of 0.77%, currently trading at 1.1655. The price remains below key moving averages, with the 20-day moving average at 1.1687, the 50-day at 1.1695, and the 200-day also at 1.1695, indicating a bearish sentiment as the price is approximately 0.28% and 0.34% below these levels. The Bollinger Bands suggest that the current price is mid-range, with the upper band at 1.1825 and the lower band at 1.1549, indicating potential for volatility but no immediate breakout direction. The RSI stands at 47.26, placing it in the neutral zone and suggesting a lack of strong momentum in either direction. The MACD reading of -0.0024 further supports bearish momentum, indicating that sellers may still dominate the market. The proximity to the 52-week high of 1.1873 and low of 1.1545 highlights significant resistance and support levels, respectively. Traders should watch the 1.1687 and 1.1695 levels closely for potential breakouts or reversals.
USD/JPY
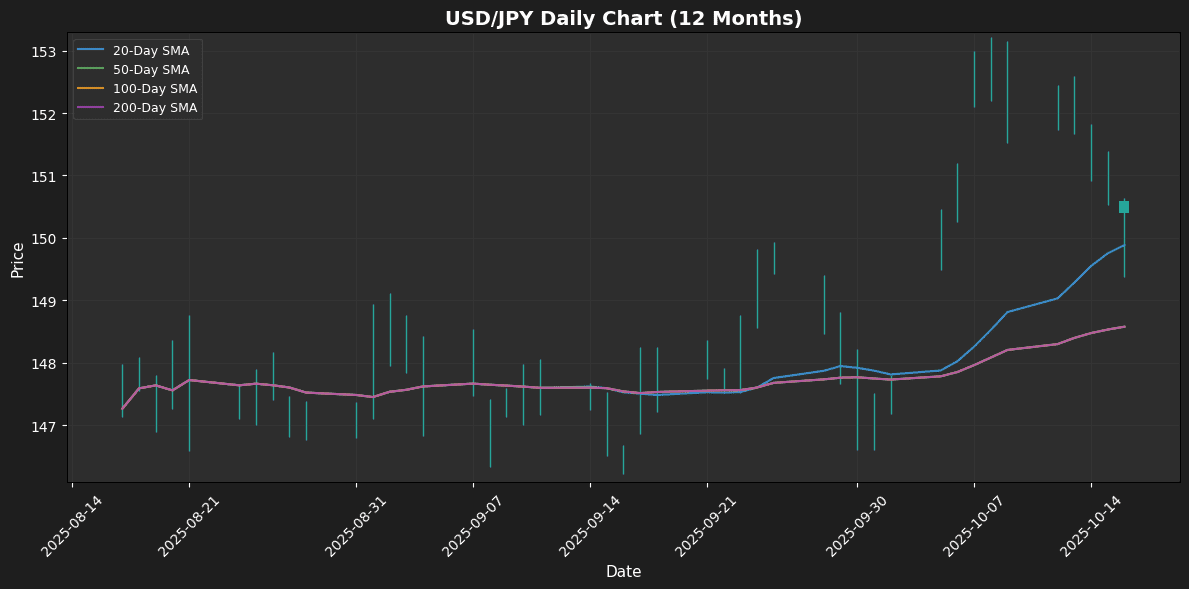
Current Price: 150.5840 | Weekly Change: -1.5566%
🔍 Technical Analysis
The USD/JPY pair experienced a weekly decline of 1.56%, currently trading at 150.5840. The price is positioned above the 20-week moving average (MA) at 149.8843, indicating a short-term bullish sentiment, while it remains significantly above the 50-MA and 200-MA, both at 148.5771, suggesting a robust medium- to long-term bullish trend. The Bollinger Bands indicate that the current price is in the mid-range, with the upper band at 153.7228 and the lower band at 146.0459, reflecting potential resistance above and support below. The Relative Strength Index (RSI) at 54.64 sits in the neutral zone, implying no immediate overbought or oversold conditions. The MACD reading of 1.0100 shows bullish momentum, reinforcing the potential for upward movement. Notably, the pair is approaching its 52-week high of 153.2120, which may act as a significant resistance level. Traders should watch key support at the 20-MA and resistance at the 52-week high for potential trading signals.
🛢️ Commodities
Gold
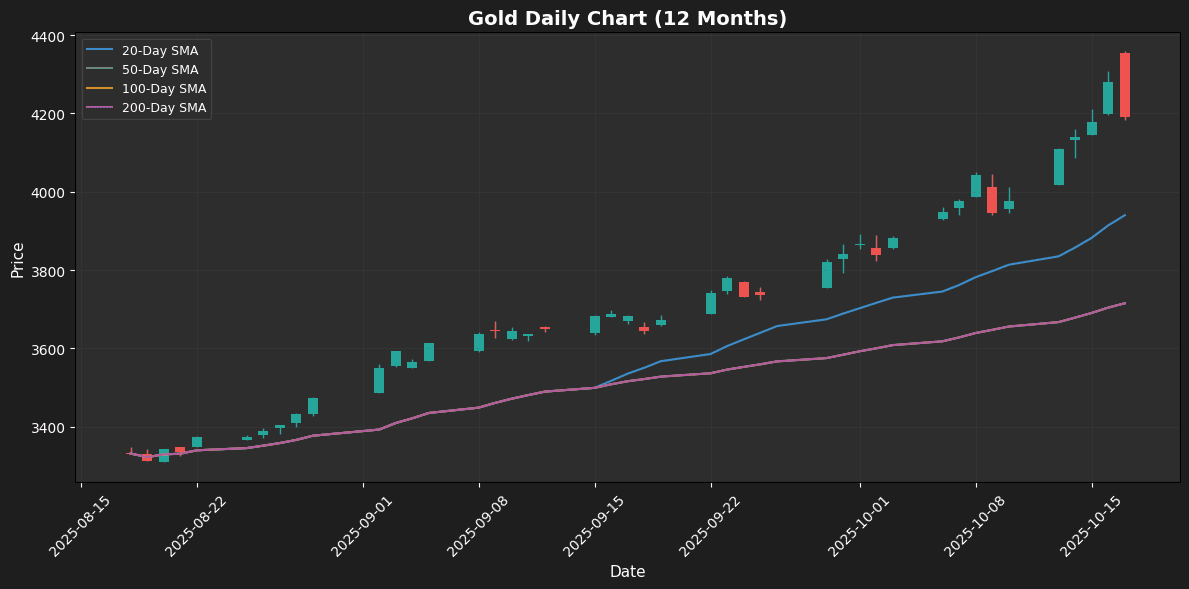
Current Price: 4189.90 | Weekly Change: +5.3824%
🔍 Technical Analysis
Gold has experienced a robust weekly performance, gaining +5.38% and currently trading at 4189.8999. The price is well above the key moving averages, sitting +6.34% above the 20-MA of 3940.0100 and +12.77% above both the 50-MA and 200-MA at 3715.3068, indicating a strong bullish trend. The Bollinger Bands suggest that the price is nearing the upper band at 4267.1797, which may signal an overbought condition in the short term. This is further corroborated by the RSI at 72.29, indicating that gold is in overbought territory and may experience a pullback. However, the MACD at 159.1424 continues to show bullish momentum, suggesting that the upward trend could persist despite the overbought signals. With a 52-week high of 4358.0000 and a low of 3310.1001, traders should monitor the key support level around the 20-MA at 3940.0100 and resistance near the upper Bollinger Band at 4267.1797 for potential trading strategies.
Crude Oil
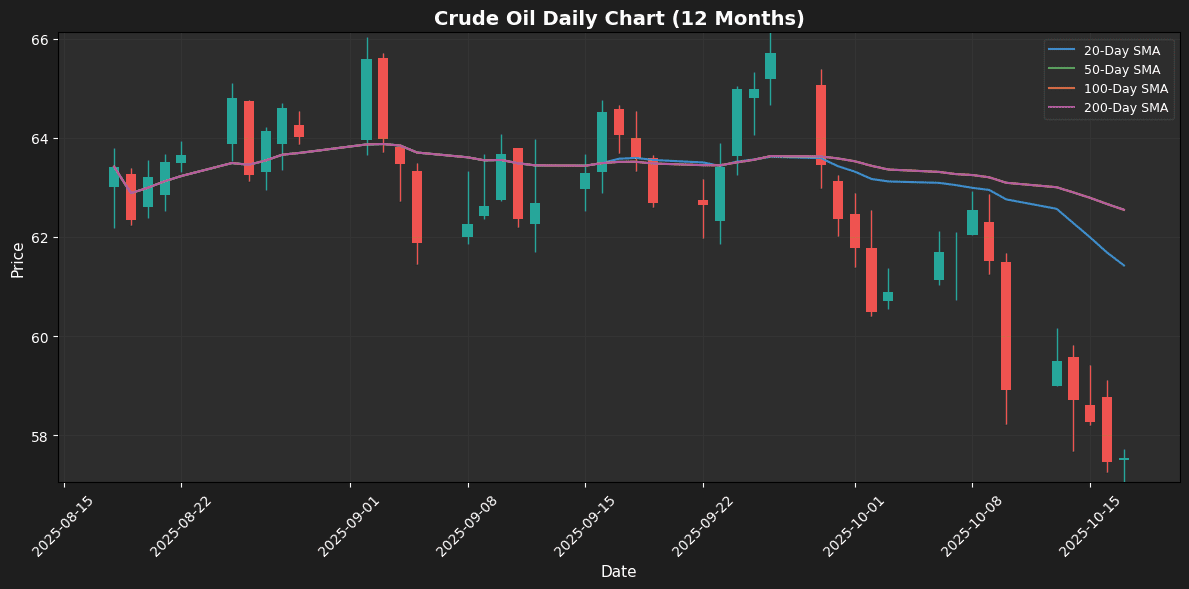
Current Price: 57.5400 | Weekly Change: -2.3090%
🔍 Technical Analysis
Crude oil has experienced a weekly decline of 2.31%, currently trading at 57.5400. The price remains significantly below key moving averages, with the 20-MA at 61.4270, indicating a -6.33% deviation, and both the 50-MA and 200-MA at 62.5491, reflecting an 8.01% gap. This positioning suggests a bearish trend in the short to medium term. The price is approaching the lower Bollinger Band at 56.6255, which may act as a support level, while the upper band sits at 66.2285, indicating potential resistance. The RSI is at 32.06, placing it in the neutral zone and suggesting that the market is not yet oversold. Additionally, the MACD reading of -1.4422 points to ongoing bearish momentum, reinforcing the current downtrend. With a 52-week high of 66.4200 and a low of 56.6000, traders should closely monitor the 56.6255 support level and the psychological barrier at 60.00 for potential reversals or further declines.
₿ Crypto
Bitcoin
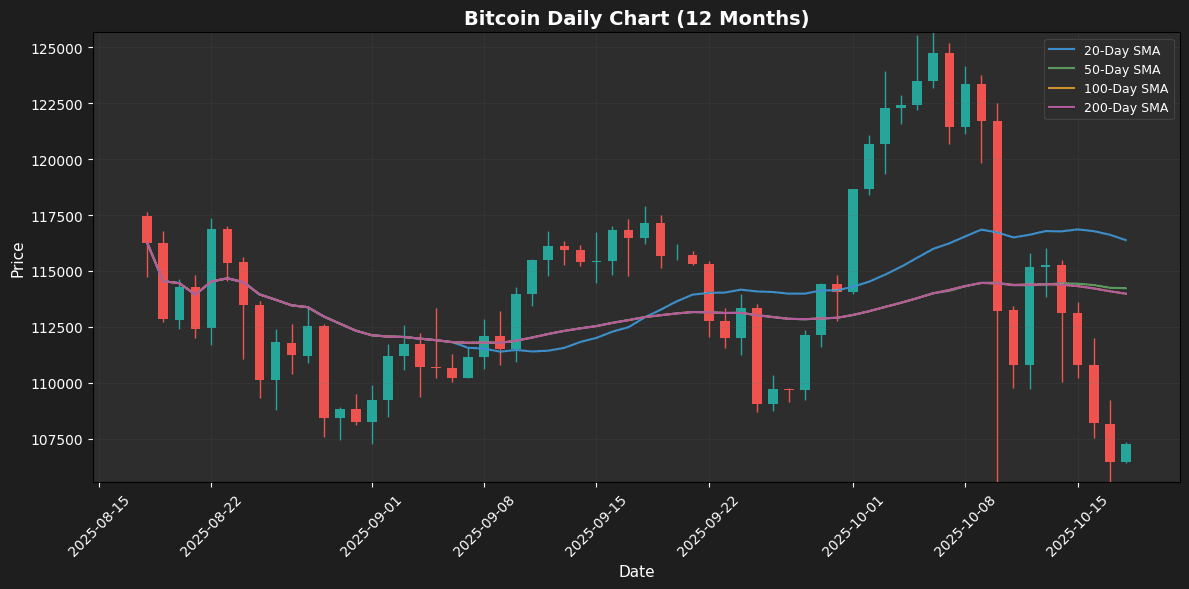
Current Price: 106467.79 | Weekly Change: -5.9591%
🔍 Technical Analysis
Bitcoin has experienced a weekly decline of 5.96%, currently trading at 107,276.65. The price is positioned below key moving averages, with the 20-MA at 116,377.59, indicating a -7.82% deviation, while the 50-MA at 114,226.63 shows a -6.08% distance, and the 200-MA at 113,982.59 reflects a -5.88% gap. This positioning suggests bearish sentiment in the short to medium term. The price is also near the lower Bollinger Band at 104,872.20, which often signals potential support but also suggests increased volatility. The RSI is currently at 36.70, placing it in a neutral zone, indicating that the market is not yet oversold. However, the MACD reading of -1,817.24 signals bearish momentum, reinforcing the downward trend. With a 52-week high of 126,198.07 and a low of 103,598.43, traders should watch for critical support at the lower band and resistance around the moving averages, particularly the 20-MA, for potential reversal signals.
Disclaimer
The content on MarketsFN.com is provided for educational and informational purposes only. It does not constitute financial advice, investment recommendations, or trading guidance. All investments involve risks, and past performance does not guarantee future results. You are solely responsible for your investment decisions and should conduct independent research and consult a qualified financial advisor before acting. MarketsFN.com and its authors are not liable for any losses or damages arising from your use of this information.


