Energy Market Snapshot: WTI Crude Surges 3.74% Amid Supply Tightness
⚡ Market Overview
Energy markets on October 22, 2025 reflect dynamic trading across crude oil, Brent, and natural gas December 2025 futures contracts. The analysis below covers market drivers, technical indicators, and trading outlook for each energy commodity.
📋 Contract Specifications
December 2025 Futures Contracts:
• CLZ25: NYMEX WTI Crude Oil (CL = Crude Light, Z = December, 25 = 2025)
• BZZ25: ICE Brent Crude (BZ = Brent, Z = December, 25 = 2025)
• NGZ25: NYMEX Natural Gas (NG = Natural Gas, Z = December, 25 = 2025)
Performance Summary
| Commodity | Contract | Price | Unit | Daily % | MA21 | MA50 | MA100 | MA200 | RSI | MACD |
|---|---|---|---|---|---|---|---|---|---|---|
| Crude Oil (WTI) | CLZ25 | $59.38 | $/barrel | +3.74% | $60.39 | $61.63 | $62.60 | $63.30 | 46.42 | -1.31 |
| Brent Oil | BZZ25 | $63.49 | $/barrel | +3.54% | $64.49 | $65.64 | $66.31 | $66.99 | 46.75 | -1.28 |
| Natural Gas | NGZ25 | $4.05 | $/MMBtu | -0.81% | $3.90 | $3.87 | $4.18 | $4.48 | 58.28 | 0.01 |
⚫ Crude Oil (WTI)
Contract: CLZ25 | Price: $59.38 $/barrel (+3.74%)

📰 Market Drivers & News
Crude oil markets exhibited renewed vigor today, propelled by a significant draw in U.S. inventories that underscored tightening supply amid steady global demand signals. The latest data revealed a notable reduction in stockpiles, reversing prior builds and highlighting robust refining activity and export flows. In China, oil product demand edged higher month-over-month, though surging reserves pointed to precautionary stockpiling rather than robust consumption, tempering optimism in the world’s largest importer.
Geopolitical tensions in the Middle East added a layer of uncertainty, with ongoing conflicts potentially disrupting key supply routes, while policy shifts in major producers remained cautious. OPEC+ adhered to production cuts, balancing output to support market stability, even as U.S. drilling activity hit peaks, bolstering non-OPEC supply.
Trader sentiment leaned bullish, with positioning reflecting bets on supply constraints outweighing demand softness from economic headwinds. Overall, the near-term outlook remains cautiously optimistic, hinging on upcoming demand indicators and geopolitical resolutions to sustain momentum.
📈 Technical Analysis
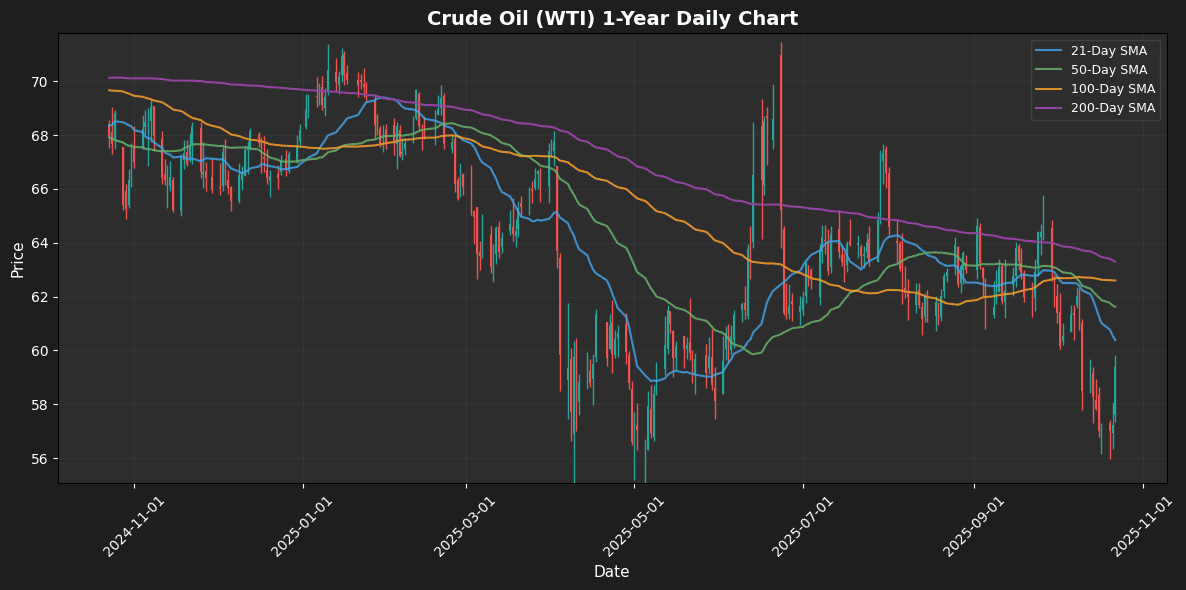
Crude Oil (WTI) is currently trading at $59.38, showing a robust daily increase of 3.74%. The price remains below significant moving averages, with the 21-day MA at $60.39, the 50-day MA at $61.63, the 100-day MA at $62.60, and the 200-day MA at $63.30. This positioning indicates potential resistance at the MA levels, particularly the 21-day MA, which could act as an immediate barrier for upward momentum.
The Relative Strength Index (RSI) at 46.42 suggests that crude oil is nearing neutral territory, indicating a lack of strong momentum either for buying or selling. The MACD reading of -1.31 reflects bearish momentum, but it remains essential to monitor for potential crossover signals.
Traders should look for a decisive break above the 21-day MA for a bullish signal, with key resistance at the 50-day MA. Support levels can be
🟤 Brent Oil
Contract: BZZ25 | Price: $63.49 $/barrel (+3.54%)

📰 Market Drivers & News
In the volatile Brent oil market, recent developments have ignited a bullish surge driven by escalating geopolitical tensions and tightening supply signals. Prospects of fresh U.S. sanctions targeting Russian energy exports have heightened fears of disrupted global flows, amplifying supply vulnerabilities amid ongoing conflicts. A surprise draw in U.S. crude inventories underscored robust demand outpacing expectations, countering earlier concerns over economic slowdowns in key consumer regions like Asia. OPEC+ producers have held firm on output curbs, resisting calls for hikes despite voluntary cuts from some members, which sustains a constrained supply environment. Inventory trends point to declining stockpiles, bolstering fundamentals as refineries ramp up ahead of seasonal peaks.
Trader sentiment has shifted decidedly optimistic, with increased long positioning reflecting confidence in sustained tightness. However, lingering demand uncertainties from global growth worries temper the enthusiasm. Near-term, the market outlook remains cautiously upward, hinging on sanction outcomes and inventory updates.
📈 Technical Analysis
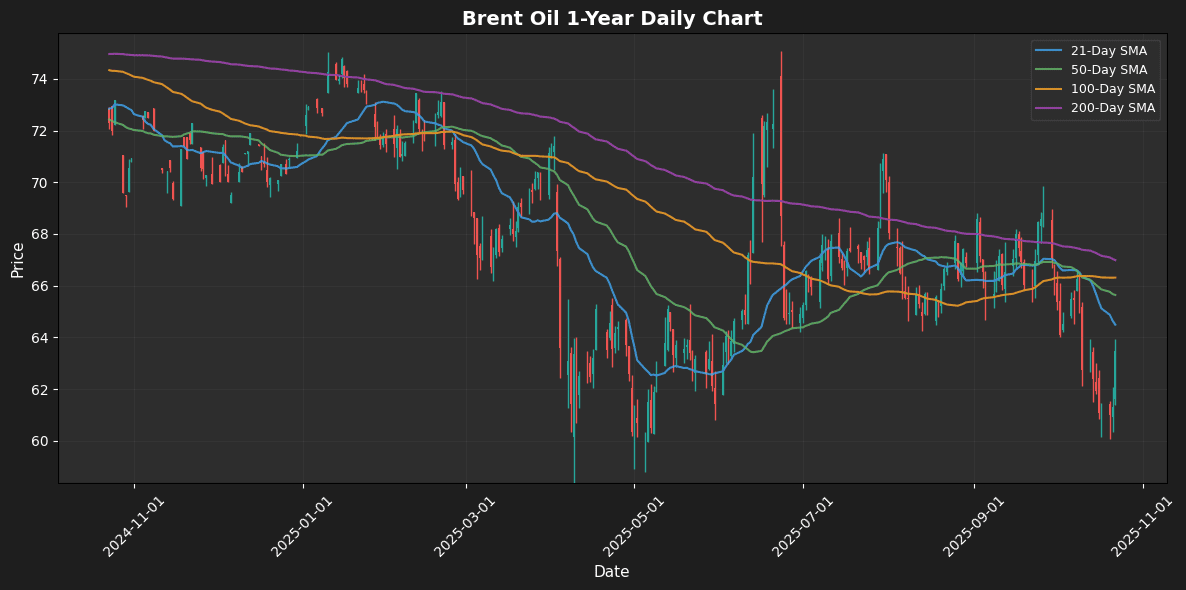
Brent Oil currently trades at $63.49, marking a notable daily increase of 3.54%. The price is positioned below key moving averages: the 21-day MA at $64.49, the 50-day MA at $65.64, the 100-day MA at $66.31, and the 200-day MA at $66.99, indicating a downward trend in the medium to long term.
The Relative Strength Index (RSI) reading of 46.75 suggests that Brent Oil is approaching neutral territory but is not yet oversold, indicating potential for further price movements. The MACD at -1.28 underscores bearish momentum, although a convergence may develop if bullish activities persist.
Traders should watch the $64.50 level as immediate resistance, while $63.00 acts as a potential support level. A decisive break above the 21-day MA could signal a shift in momentum, while bearish continuation below $63.00 may target lower
🔵 Natural Gas
Contract: NGZ25 | Price: $4.05 $/MMBtu (-0.81%)

📰 Market Drivers & News
As autumn deepens, the natural gas market stirs with anticipation of a seasonal demand uptick. Forecasts for an early November chill across key regions are poised to initiate the first storage withdrawals, easing pressure on elevated inventories that have lingered from a mild summer. In Texas, ongoing pipeline maintenance has temporarily constrained regional flows, tightening local supply dynamics despite robust operations at LNG export terminals that continue to sustain global shipments.
Geopolitically, Europe’s push for diversified energy imports amid lingering tensions underscores steady U.S. export volumes, while domestic policy discussions around permitting reforms hint at potential expansions in production capacity. Producers maintain steady output levels, with no major curtailments reported, though selective maintenance schedules add layers of uncertainty.
Market sentiment remains cautiously optimistic, with traders bolstering long positions in anticipation of weather-driven volatility, yet wary of ample stockpiles capping upside momentum. Near-term, expect continued fluctuations as cooler temperatures test supply resilience and early winter preparations intensify.
📈 Technical Analysis
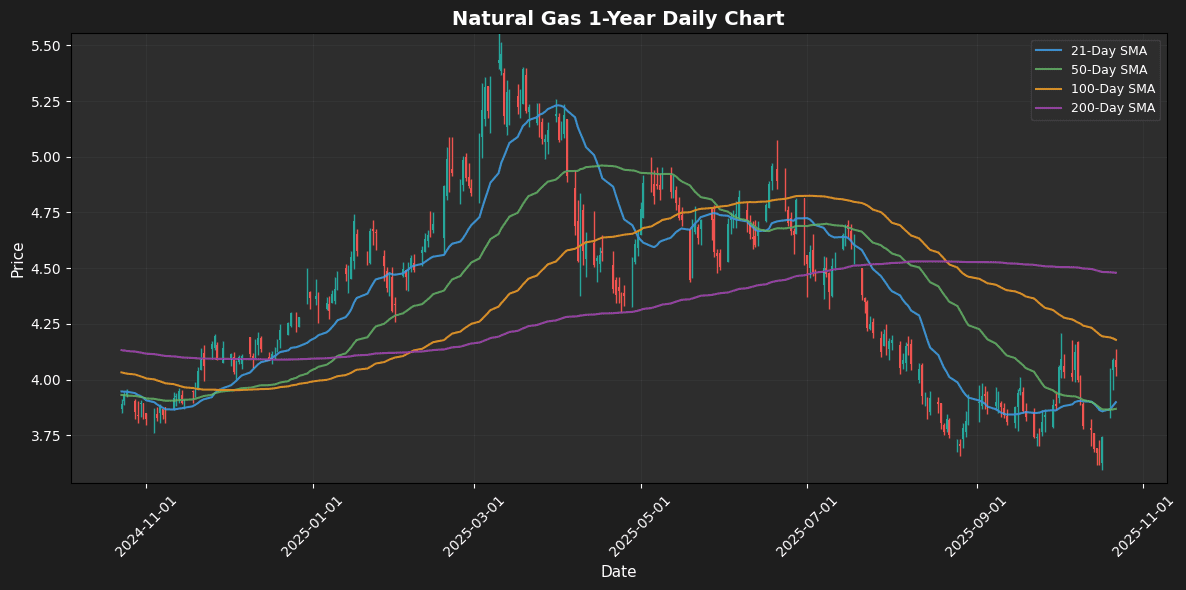
Natural gas is currently trading at $4.05, reflecting a daily decline of 0.81%. The price remains above the short-term moving averages (MA21 at $3.90 and MA50 at $3.87), indicating a bullish short-term sentiment. However, it is below the longer-term MA100 at $4.18 and significantly below the MA200 at $4.48, suggesting potential resistance at these upper levels.
The Relative Strength Index (RSI) at 58.28 indicates that the market is approaching overbought territory, while the MACD at 0.01 is near the zero line, displaying a lack of momentum. Traders should watch for a potential crossover or divergence in MACD to confirm the next price movement.
Key support levels appear at $3.90 and $3.87, while resistance is observed around $4.18. Given these indicators, traders may adopt a cautious bullish stance but should remain aware of possible price consolidation near these levels
Disclaimer
The content on MarketsFN.com is provided for educational and informational purposes only. It does not constitute financial advice, investment recommendations, or trading guidance. All investments involve risks, and past performance does not guarantee future results. You are solely responsible for your investment decisions and should conduct independent research and consult a qualified financial advisor before acting. MarketsFN.com and its authors are not liable for any losses or damages arising from your use of this information.


