Forex Report: US Dollar Weakens Amid Trade Tensions, USD/CAD Declines 0.21%
📰 Forex and Global Market News
**Market Overview:**
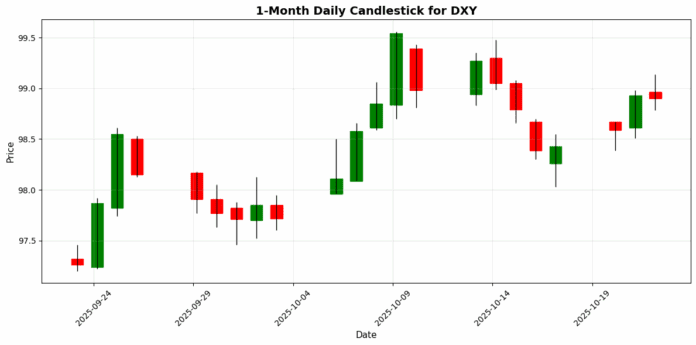
Today’s forex market saw mixed movements as the US Dollar (USD) faced downward pressure amid ongoing trade tensions and uncertainty surrounding a potential government shutdown. The DXY index settled at 98.90, down 0.0030%. The broader market sentiment was influenced by geopolitical events and economic data releases, particularly in relation to the US-China trade dynamics.
**Key News Items:**
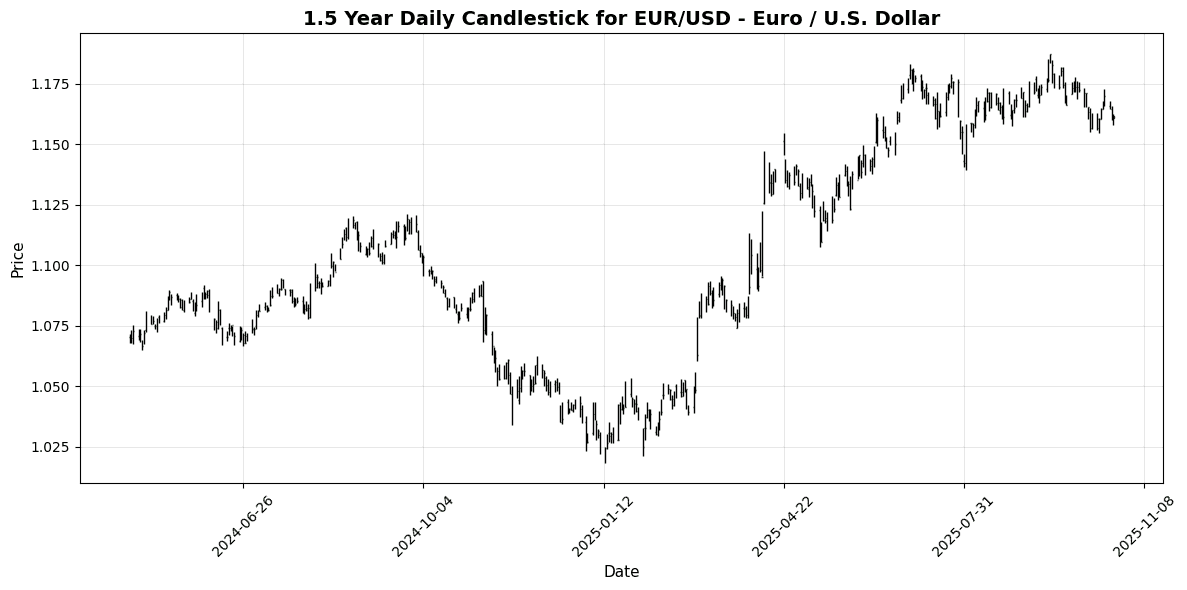
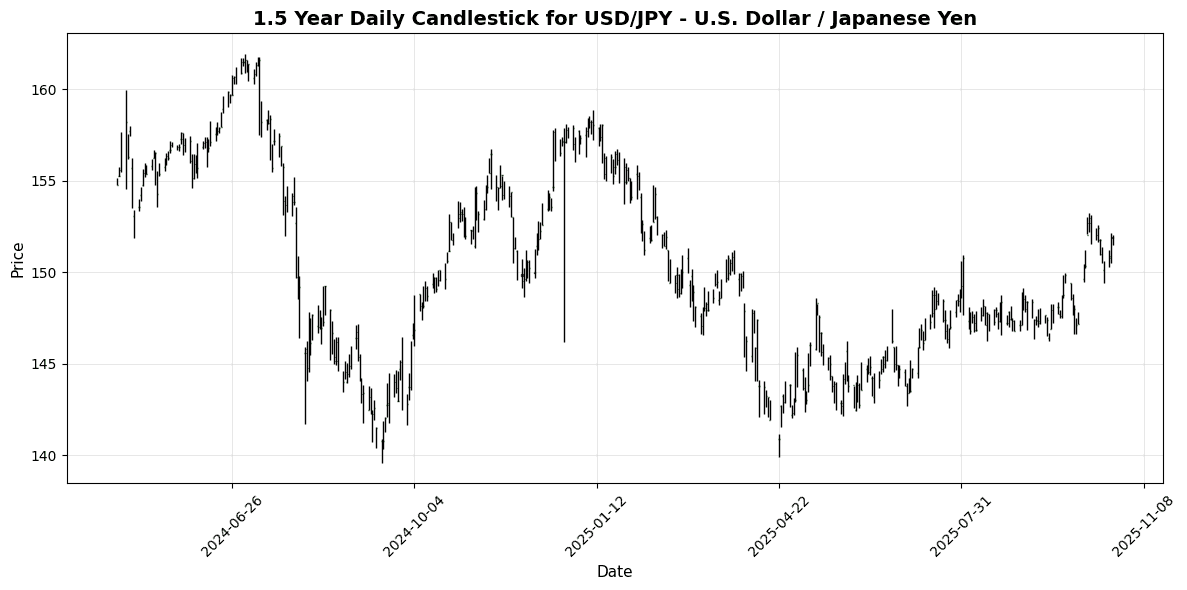
The Euro (EUR) showed signs of recovery, with EUR/USD nudging back above 1.1600 as risk sentiment improved slightly. Meanwhile, the Australian Dollar (AUD) regained some ground, lifting above 0.6500 after a turbulent previous session. The Japanese Yen (JPY) stabilized against the USD, trading just below the 152.00 mark as markets adjusted to Japan’s new economic leadership. Gold prices continued to decline, flirting with the $4,000 threshold, pressured by expectations of an upcoming US inflation report. In commodities, WTI crude oil prices gained traction following a surprise draw in US inventories, supporting a modest recovery.
**Closing:**
Overall, the forex market remains sensitive to geopolitical developments and economic indicators, with traders closely monitoring the evolving US-China trade situation and domestic economic data. The DXY’s slight decline reflects these uncertainties as investors reassess their positions.
📅 Economic Calendar Events Today
All times are in US Eastern Time (ET)
| Date | Time | Cur | Imp | Event | Actual | Forecast |
|---|---|---|---|---|---|---|
| 2025-10-22 | 02:00 | 🇬🇧 | High | CPI (YoY) (Sep) | 3.8% | 4.0% |
| 2025-10-22 | 02:00 | 🇬🇧 | Medium | CPI (MoM) (Sep) | 0.0% | |
| 2025-10-22 | 02:00 | 🇬🇧 | Medium | CPIH (YoY) | 4.1% | |
| 2025-10-22 | 02:00 | 🇬🇧 | Medium | PPI Input (MoM) (Sep) | -0.1% | 0.3% |
| 2025-10-22 | 07:00 | 🇪🇺 | Medium | ECB’s De Guindos Speaks | ||
| 2025-10-22 | 08:25 | 🇪🇺 | Medium | ECB President Lagarde Speaks | ||
| 2025-10-22 | 10:30 | 🇺🇸 | High | Crude Oil Inventories | -0.961M | 2.200M |
| 2025-10-22 | 10:30 | 🇺🇸 | Medium | Cushing Crude Oil Inventories | -0.770M | |
| 2025-10-22 | 11:00 | 🇪🇺 | Medium | German Buba Vice President Buch Speaks | ||
| 2025-10-22 | 13:00 | 🇺🇸 | Medium | 20-Year Bond Auction | 4.506% | |
| 2025-10-22 | 16:00 | 🇬🇧 | Medium | BoE Deputy Governor Woods Speaks | ||
| 2025-10-22 | 16:00 | 🇺🇸 | Medium | Fed Vice Chair for Supervision Barr Speaks |
**Overview:**
Today’s economic calendar features several high-impact events, particularly focused on the UK and the US. Key data releases include UK inflation figures and US crude oil inventories, with potential implications for GBP and USD pairs.
**Key Releases:**
1. **UK CPI (YoY)**: Actual 3.8% vs. Forecast 4.0% – A notable miss, suggesting easing inflationary pressures which could influence Bank of England’s policy outlook.
2. **UK PPI Input (MoM)**: Actual -0.1% vs. Forecast 0.3% – This unexpected decline further indicates weakening inflation dynamics, likely to impact GBP negatively.
3. **US Crude Oil Inventories**: Actual -0.961M vs. Forecast 2.200M – A significant drawdown, indicating tighter supply conditions which could support USD and oil-related currencies.
**FX Impact:**
The GBP is likely to weaken against major currencies, particularly the USD and EUR, due to disappointing inflation data. Traders may look to short GBP/USD and GBP/EUR. Conversely, the USD may strengthen on the back of the crude oil inventory draw, potentially bolstering USD/CAD and other oil-related pairs. Market participants will be closely monitoring comments from ECB officials, as any hawkish signals could also influence EUR pairs.
💱 Major Currency Pairs
| Name | Symbol | Price | Daily (%) | 5D (%) | 1W (%) | 1M (%) | 3M (%) | 6M (%) | YTD (%) | 12M (%) | MA50 | MA100 | MA200 | RSI | MACD |
|---|---|---|---|---|---|---|---|---|---|---|---|---|---|---|---|
| EUR/USD – Euro / U.S. Dollar | EURUSD | 1.1616 | +0.1034 | -0.7146 | +0.1183 | -1.0305 | -1.3442 | +2.1465 | +11.63 | +7.3783 | 1.1692 | 1.1657 | 1.1260 | 37.02 | -0.0022 |
| USD/JPY – U.S. Dollar / Japanese Yen | USDJPY | 151.91 | -0.0165 | +1.1897 | +0.1153 | +2.5733 | +3.7971 | +6.3179 | -3.2415 | +0.8639 | 148.68 | 147.43 | 148.01 | 70.93 | 0.8759 |
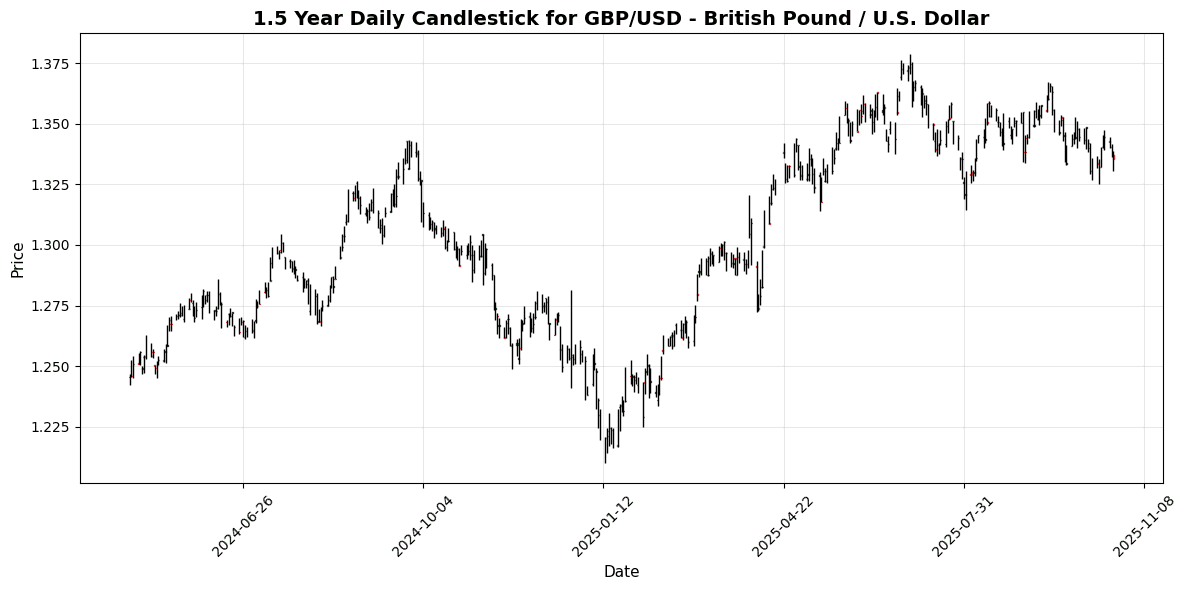
| GBP/USD – British Pound / U.S. Dollar | GBPUSD | 1.3355 | -0.0972 | -0.6735 | +0.2506 | -0.8151 | -1.6538 | +0.2159 | +6.4220 | +2.8656 | 1.3472 | 1.3489 | 1.3200 | 38.38 | -0.0027 |
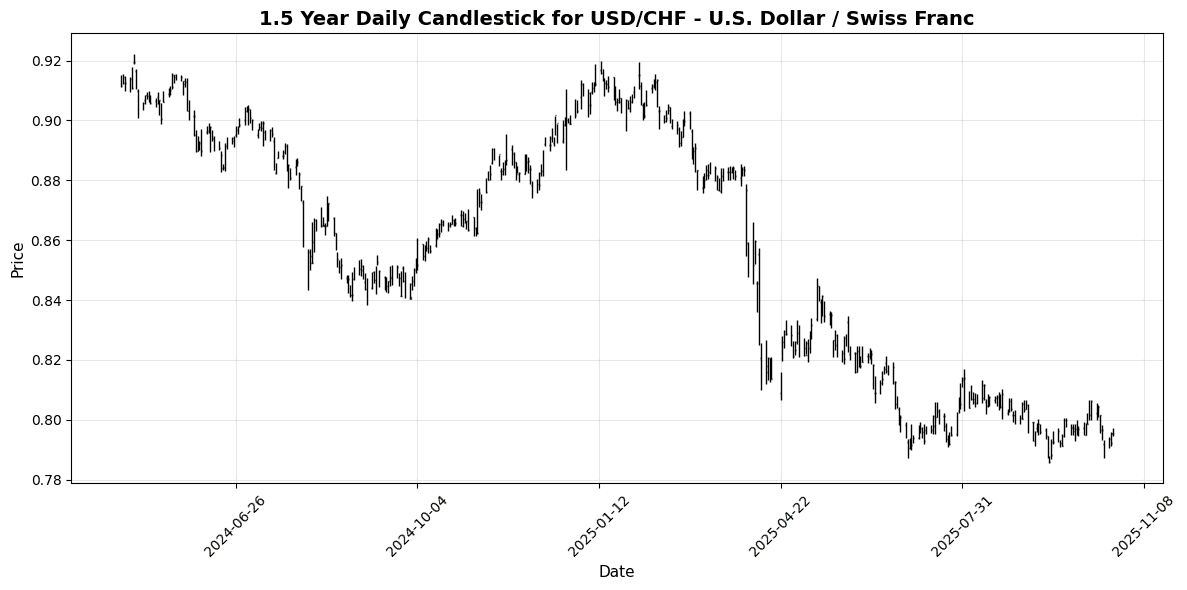
| USD/CHF – U.S. Dollar / Swiss Franc | USDCHF | 0.7954 | -0.1381 | +0.4509 | -0.7648 | -0.1042 | +0.4233 | -4.0230 | -11.94 | -8.0898 | 0.7991 | 0.8021 | 0.8353 | 47.96 | -0.0008 |
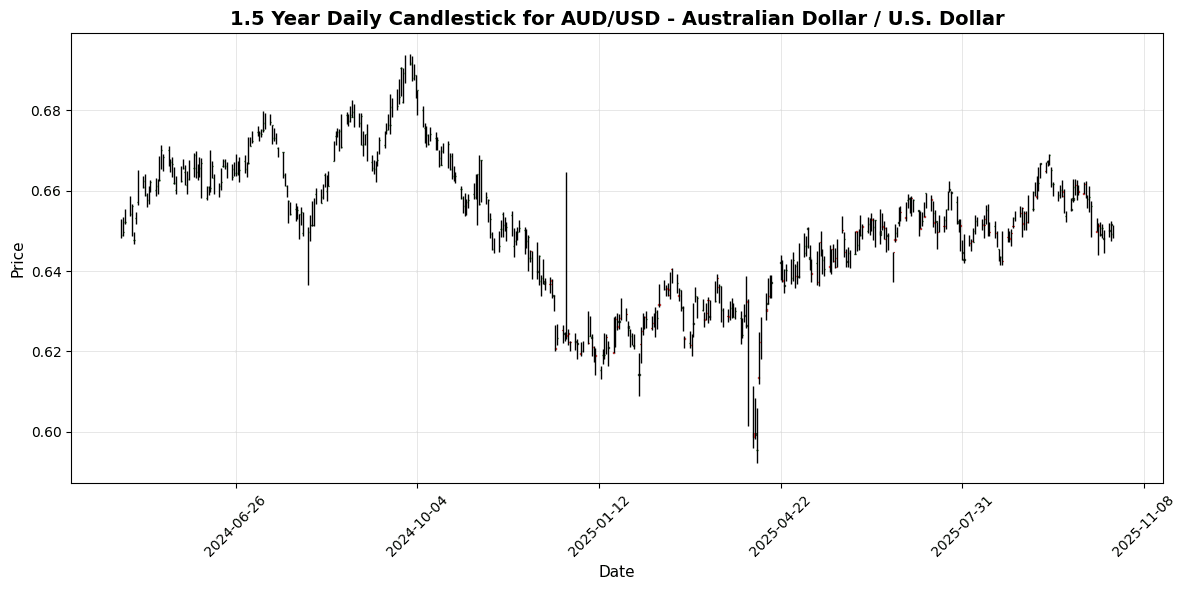
| AUD/USD – Australian Dollar / U.S. Dollar | AUDUSD | 0.6493 | 0.0000 | +0.1636 | +0.0262 | -1.4616 | -1.6808 | +1.3979 | +4.3891 | -2.4063 | 0.6554 | 0.6538 | 0.6430 | 29.88 | -0.0022 |
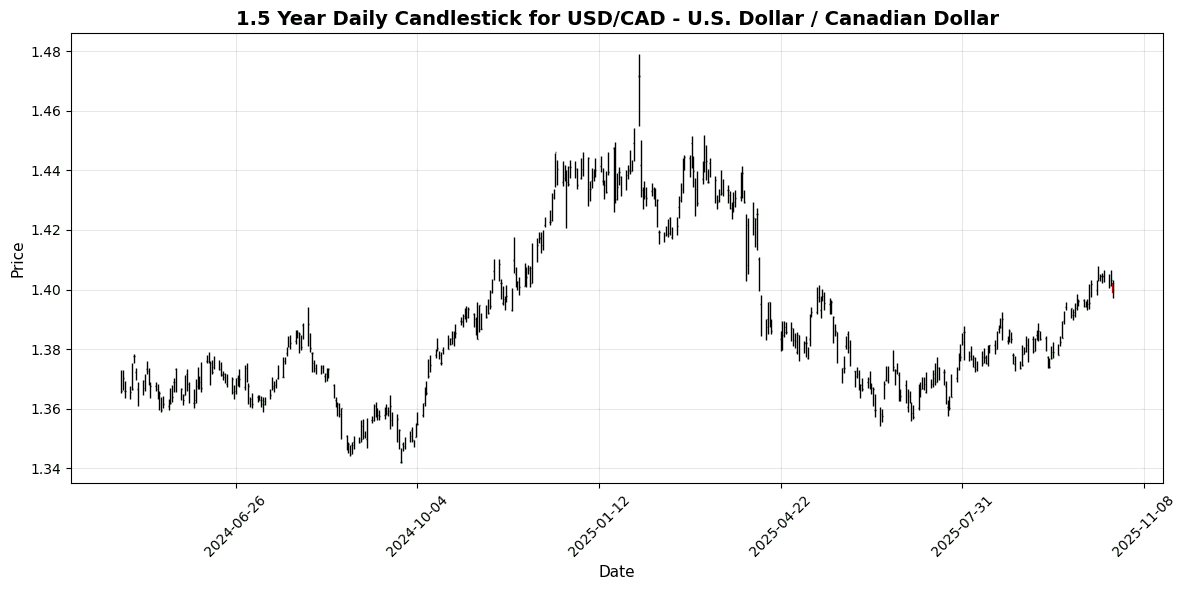
| USD/CAD – U.S. Dollar / Canadian Dollar | USDCAD | 1.3992 | -0.2068 | -0.3845 | -0.3774 | +1.5237 | +2.8710 | +0.9670 | -2.4934 | +1.1458 | 1.3877 | 1.3784 | 1.3969 | 59.67 | 0.0049 |
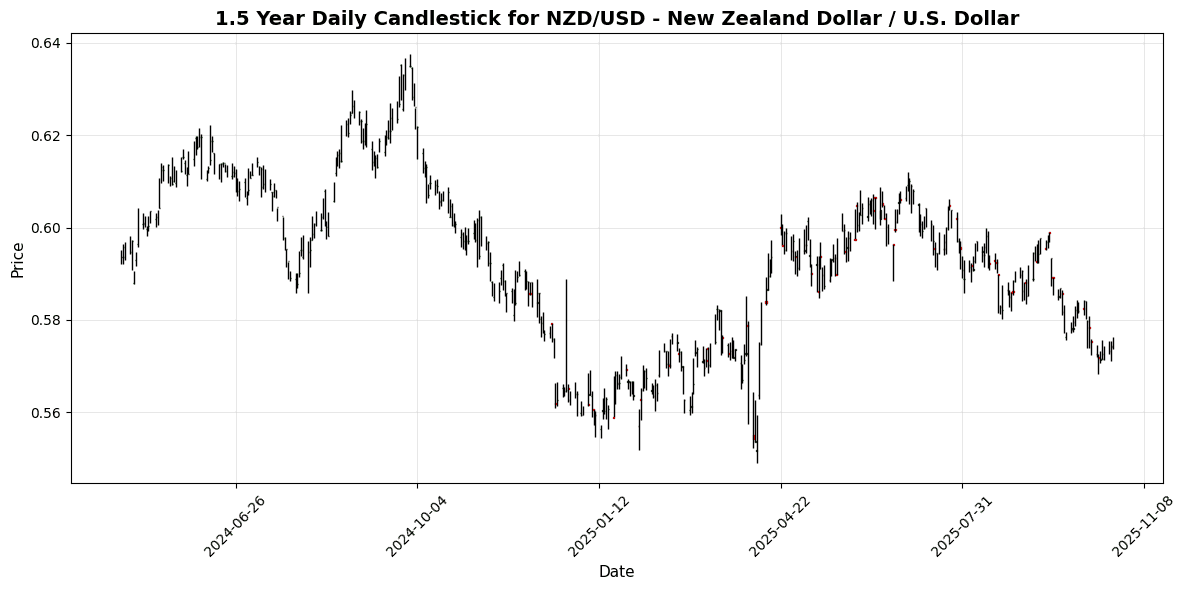
| NZD/USD – New Zealand Dollar / U.S. Dollar | NZDUSD | 0.5742 | -0.0174 | +0.2616 | +0.4724 | -1.8681 | -5.0566 | -4.1080 | +1.8137 | -4.6702 | 0.5848 | 0.5925 | 0.5851 | 28.07 | -0.0038 |
**Overview:**
The current trend in the Majors FX group indicates a mixed sentiment. While the USD shows strength against several currencies, some pairs are exhibiting bearish signals, particularly those with lower RSI readings.
**Key Pairs:**
1. **USD/JPY**: Currently priced at 151.9060, this pair is near overbought territory with an RSI of 70.93 and a positive MACD of 0.8759, indicating strong bullish momentum. Traders should watch for potential resistance near 152.00.
2. **AUD/USD**: Priced at 0.6493, this pair is in oversold territory with an RSI of 29.88 and a negative MACD of -0.0022, suggesting bearish momentum. A critical support level to monitor is around 0.6450.
3. **GBP/USD**: At 1.3355, this pair shows an RSI of 38.38 and a negative MACD of -0.0027, indicating bearish sentiment. Watch for support around 1.3300.
**Trading Implications:**
For USD/JPY, traders may consider buying on dips as bullish momentum persists. Conversely, for AUD/USD and GBP/USD, traders should be cautious, as both pairs are
🔀 Cross Currency Pairs
| Name | Symbol | Price | Daily (%) | 5D (%) | 1W (%) | 1M (%) | 3M (%) | 6M (%) | YTD (%) | 12M (%) | MA50 | MA100 | MA200 | RSI | MACD |
|---|---|---|---|---|---|---|---|---|---|---|---|---|---|---|---|
| EUR/GBP | EURGBP | 0.8692 | +0.1729 | -0.1057 | -0.1998 | -0.2811 | +0.2549 | +1.8693 | +4.8252 | +4.3382 | 0.8678 | 0.8641 | 0.8527 | 46.87 | 0.0000 |
| EUR/JPY | EURJPY | 176.38 | +0.0777 | +0.4248 | +0.1897 | +1.4752 | +2.3639 | +8.5638 | +7.9505 | +8.2992 | 173.82 | 171.84 | 166.53 | 72.51 | 0.6880 |
| EUR/CHF | EURCHF | 0.9238 | -0.0216 | -0.2753 | -0.6517 | -1.1408 | -0.9436 | -1.9685 | -1.7129 | -1.3097 | 0.9342 | 0.9349 | 0.9384 | 16.84 | -0.0027 |
| EUR/AUD | EURAUD | 1.7883 | +0.0783 | -0.9071 | +0.0599 | +0.4003 | +0.2860 | +0.6665 | +6.8790 | +10.01 | 1.7840 | 1.7830 | 1.7503 | 57.39 | 0.0026 |
| GBP/JPY | GBPJPY | 202.87 | -0.1142 | +0.5113 | +0.3731 | +1.7438 | +2.0986 | +6.5538 | +2.9802 | +3.7787 | 200.27 | 198.84 | 195.25 | 67.36 | 0.7795 |
| GBP/CHF | GBPCHF | 1.0620 | -0.2630 | -0.2423 | -0.5255 | -0.9051 | -1.2626 | -3.8340 | -6.2955 | -5.4790 | 1.0764 | 1.0819 | 1.1009 | 26.11 | -0.0032 |
| AUD/JPY | AUDJPY | 98.58 | -0.0406 | +1.3072 | +0.0883 | +1.0289 | +2.0497 | +7.8060 | +0.9803 | -1.5949 | 97.42 | 96.37 | 95.14 | 57.13 | 0.2395 |
| AUD/NZD | AUDNZD | 1.1292 | -0.1150 | -0.2368 | -0.6161 | +0.2762 | +3.4540 | +5.6492 | +2.4037 | +2.2354 | 1.1206 | 1.1035 | 1.0990 | 41.61 | 0.0035 |
| CHF/JPY | CHFJPY | 190.89 | +0.0939 | +0.7004 | +0.8523 | +2.6418 | +3.3361 | +10.74 | +9.8380 | +9.7571 | 186.04 | 183.79 | 177.47 | 86.46 | 1.2793 |
| NZD/JPY | NZDJPY | 87.17 | -0.0573 | +1.4206 | +0.5711 | +0.6210 | -1.4861 | +1.9138 | -1.5273 | -3.8866 | 86.92 | 87.31 | 86.55 | 62.22 | -0.0692 |
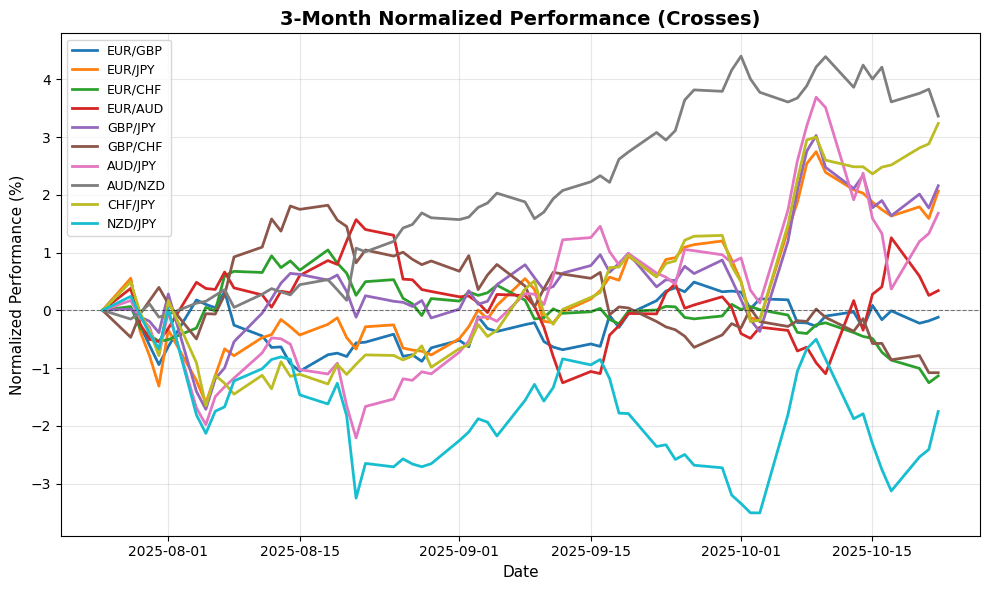
**Overview:**
The Crosses FX group exhibits mixed signals, with a general bullish sentiment in select pairs, particularly those with strong RSI and MACD readings. However, some pairs are showing signs of potential weakness.
**Key Pairs:**
1. **EUR/JPY**: Currently priced at 176.3760, it has an RSI of 72.51, indicating overbought conditions, and a positive MACD of 0.6880, suggesting bullish momentum.
2. **CHF/JPY**: Priced at 190.8940, it shows an RSI of 86.46, also indicating overbought status, with a strong MACD of 1.2793, reinforcing bullish momentum.
3. **EUR/CHF**: Priced at 0.9238, it has an RSI of 16.84, indicating oversold conditions and a negative MACD of -0.0027, suggesting bearish momentum.
**Trading Implications:**
For EUR/JPY and CHF/
🌍 Exotic and Emerging Market Currencies
| Name | Symbol | Price | Daily (%) | 5D (%) | 1W (%) | 1M (%) | 3M (%) | 6M (%) | YTD (%) | 12M (%) | MA50 | MA100 | MA200 | RSI | MACD |
|---|---|---|---|---|---|---|---|---|---|---|---|---|---|---|---|
| USD/TRY – U.S. Dollar / Turkish Lira | USDTRY | 41.95 | -0.0136 | +0.1313 | +0.3159 | +1.3123 | +3.7087 | +9.2055 | +18.82 | +22.50 | 41.38 | 40.71 | 39.03 | 96.93 | 0.1679 |
| USD/ZAR – U.S. Dollar / South African Rand | USDZAR | 17.40 | +0.1168 | +0.3942 | +0.1055 | +0.4890 | -0.6162 | -7.1763 | -7.2534 | -1.1131 | 17.43 | 17.61 | 18.00 | 58.75 | -0.0234 |
| USD/THB – U.S. Dollar / Thai Baht | USDTHB | 32.72 | -0.2439 | +0.6769 | +0.3681 | +2.6349 | +1.7729 | -2.0066 | -4.1565 | -2.3575 | 32.27 | 32.38 | 33.00 | 61.54 | 0.1336 |
| USD/SEK – U.S. Dollar / Swedish Krona | USDSEK | 9.3863 | -0.3789 | -0.3115 | -1.6261 | -0.3060 | -1.2396 | -2.4009 | -14.85 | -11.10 | 9.4370 | 9.5060 | 9.8608 | 51.55 | 0.0039 |
| USD/NOK – U.S. Dollar / Norwegian Krone | USDNOK | 10.01 | -0.4206 | -0.4315 | -1.3932 | +0.9426 | -0.8175 | -3.8766 | -11.59 | -8.5272 | 10.02 | 10.07 | 10.41 | 59.63 | 0.0209 |
| USD/DKK – U.S. Dollar / Danish Krone | USDDKK | 6.4312 | -0.0870 | +0.7488 | -0.0805 | +1.1402 | +1.4609 | -2.0472 | -10.26 | -6.7261 | 6.3849 | 6.4029 | 6.6403 | 63.79 | 0.0131 |
| USD/MXN – U.S. Dollar / Mexican Peso | USDMXN | 18.42 | -0.0911 | -0.0749 | -0.4749 | -0.0201 | -0.6484 | -6.0383 | -10.74 | -7.7367 | 18.52 | 18.66 | 19.38 | 52.30 | -0.0201 |
| USD/PLN – U.S. Dollar / Polish Zloty | USDPLN | 3.6424 | -0.2465 | +0.3778 | -0.7983 | +0.3112 | +0.9875 | -2.9643 | -11.31 | -8.7732 | 3.6385 | 3.6511 | 3.7692 | 54.47 | 0.0030 |
| USD/HUF – U.S. Dollar / Hungarian Forint | USDHUF | 334.88 | -0.1282 | +0.5422 | -0.7272 | +0.7212 | -1.0089 | -6.1827 | -15.22 | -9.7285 | 335.24 | 339.57 | 355.91 | 59.62 | 0.0679 |
| USD/CZK – U.S. Dollar / Czech Koruna | USDCZK | 20.90 | -0.1600 | +0.7873 | -0.2162 | +1.0646 | +0.1879 | -4.6689 | -13.47 | -10.44 | 20.83 | 21.02 | 22.04 | 62.14 | 0.0227 |
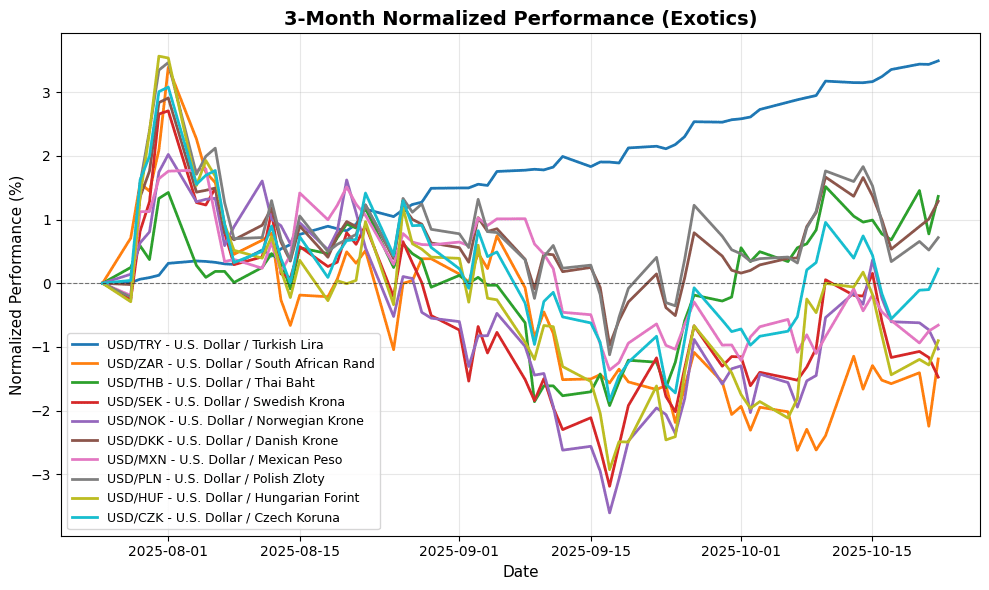
**Overview:** The Exotics FX group is currently exhibiting mixed signals, with a general bearish undertone observed across most pairs. However, USD/TRY stands out due to extreme overbought conditions.
**Key Pairs:**
1. **USD/TRY:** Price at 41.9513, RSI at 96.93 indicates extreme overbought conditions, suggesting a potential reversal. MACD at 0.1679 signals bullish momentum but caution is advised due to overbought RSI.
2. **USD/ZAR:** Price at 17.4038, RSI at 58.75 is neutral-bullish, while MACD at -0.0234 indicates waning bearish momentum, suggesting a possible upward shift.
3. **USD/DKK:** Price at 6.4312, RSI at 63.79 shows bullish momentum, supported by MACD at 0.0131, indicating potential for further gains.
**Trading Implications:** Watch for resistance at 42.00 for USD/TRY, while
Disclaimer
The content on MarketsFN.com is provided for educational and informational purposes only. It does not constitute financial advice, investment recommendations, or trading guidance. All investments involve risks, and past performance does not guarantee future results. You are solely responsible for your investment decisions and should conduct independent research and consult a qualified financial advisor before acting. MarketsFN.com and its authors are not liable for any losses or damages arising from your use of this information.


