Crypto Market Snapshot: Avalanche Drops 1.19%
🪙 Market Overview
Cryptocurrency markets on October 27, 2025 showcase the top 10 digital assets by market activity and adoption. This comprehensive analysis covers Bitcoin, Ethereum, and leading altcoins, examining market drivers, technical patterns, and trading dynamics across the crypto ecosystem.
Performance Summary
| Cryptocurrency | Symbol | Price (USD) | Daily % | MA21 | MA50 | MA100 | MA200 | RSI | MACD |
|---|---|---|---|---|---|---|---|---|---|
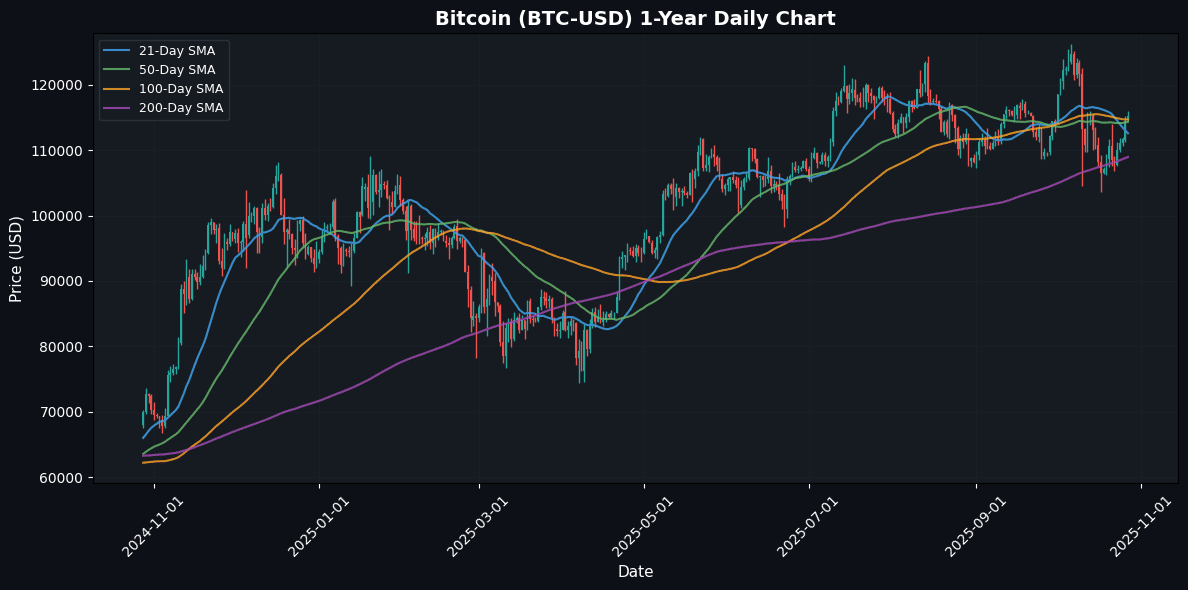
| Bitcoin | BTC | $115,258.52 | +0.69% | $112,601.25 | $114,343.29 | $114,683.15 | $108,976.95 | 55.33 | -821.50 |
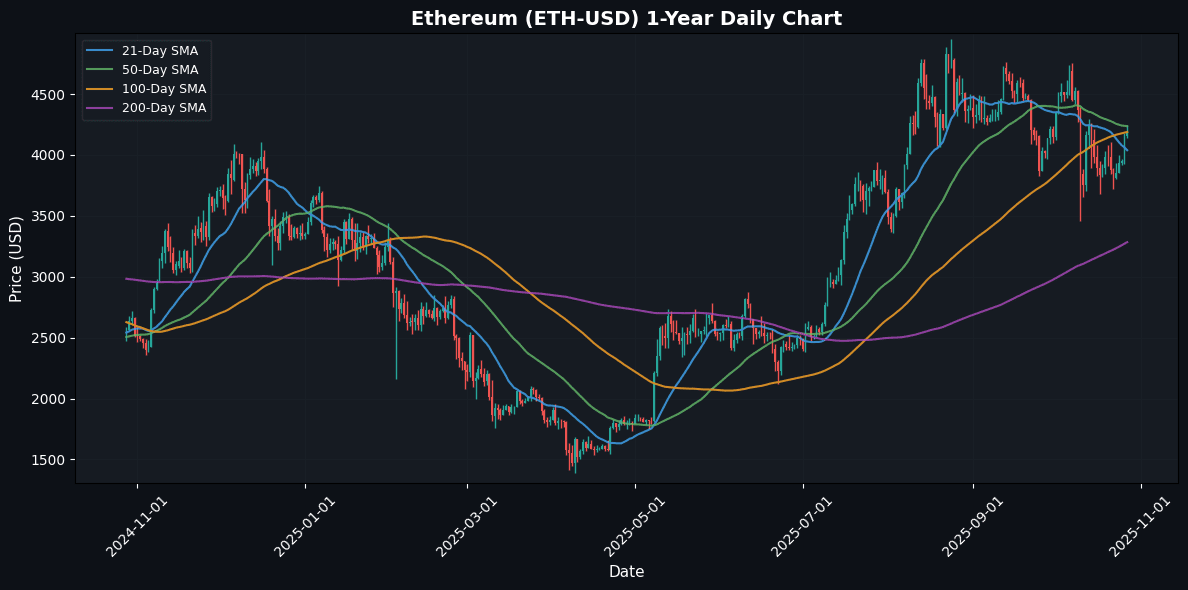
| Ethereum | ETH | $4,190.44 | +0.78% | $4,039.28 | $4,237.17 | $4,189.10 | $3,284.13 | 53.94 | -61.22 |
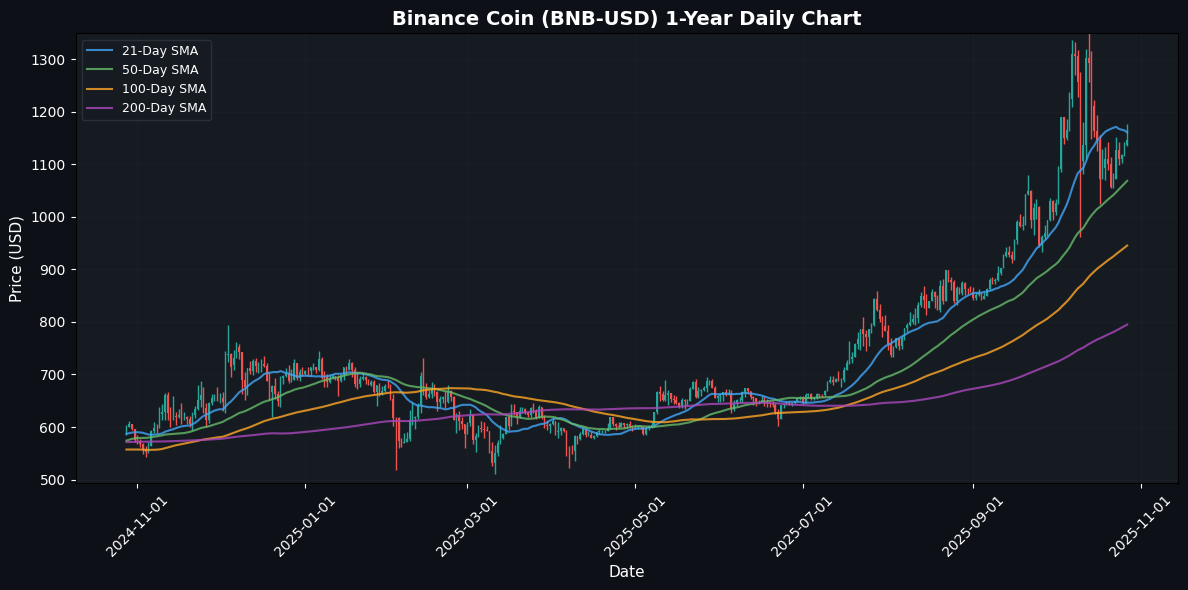
| Binance Coin | BNB | $1,146.97 | +0.82% | $1,160.78 | $1,068.48 | $945.27 | $794.86 | 53.45 | 8.37 |
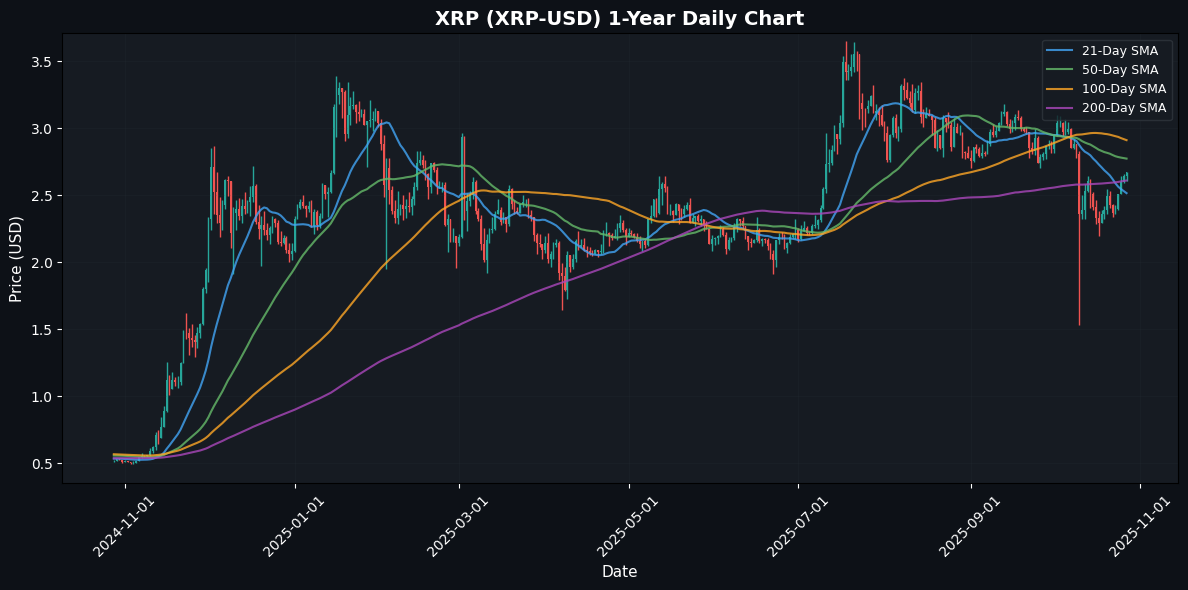
| XRP | XRP | $2.68 | +1.18% | $2.52 | $2.77 | $2.91 | $2.61 | 54.17 | -0.06 |
| Solana | SOL | $200.99 | +0.48% | $196.07 | $213.28 | $200.99 | $177.77 | 50.77 | -4.79 |
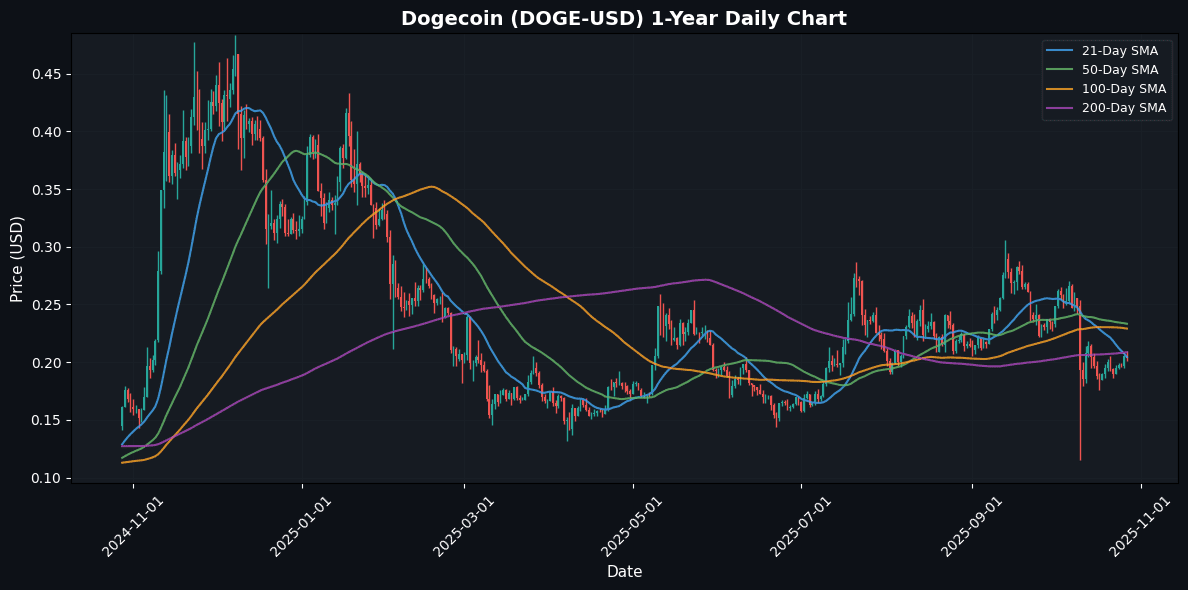
| Dogecoin | DOGE | $0.2040 | -0.83% | $0.2045 | $0.2333 | $0.2291 | $0.2086 | 46.53 | -0.01 |
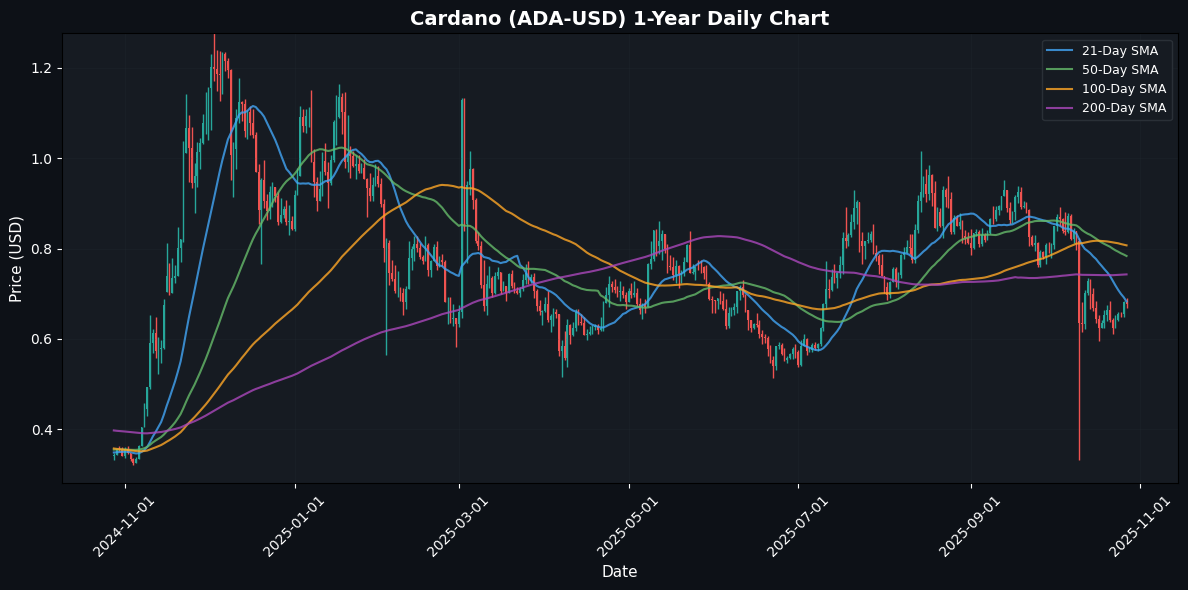
| Cardano | ADA | $0.6766 | -0.65% | $0.6828 | $0.7836 | $0.8071 | $0.7428 | 44.92 | -0.04 |
| TRON | TRX | $0.2998 | -0.22% | $0.3179 | $0.3315 | $0.3344 | $0.3024 | 33.52 | -0.01 |
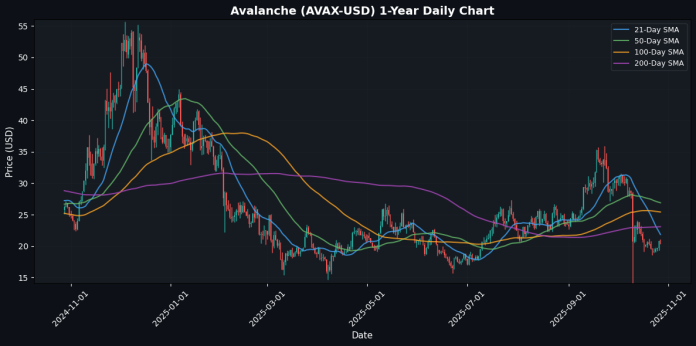
| Avalanche | AVAX | $20.59 | -1.19% | $21.85 | $26.90 | $25.43 | $23.09 | 39.13 | -2.05 |
| Polkadot | DOT | $3.17 | -0.69% | $3.23 | $3.78 | $3.86 | $3.94 | 43.88 | -0.20 |
🟠 Bitcoin (BTC)
Price: $115,258.52 (+0.69%)
The original cryptocurrency and largest by market cap; often used as a benchmark for the entire market.
📰 Market Drivers & News
Bitcoin’s market dynamics today reflect a blend of cautious institutional activity and robust corporate adoption, underscoring the asset’s evolving role in global finance. Key developments include major corporations bolstering their treasuries with substantial BTC acquisitions, signaling growing confidence in Bitcoin as a strategic reserve asset amid geopolitical uncertainties. Ecosystem growth is evident in surging institutional inflows to spot ETFs, which continue to drive mainstream integration, while partnerships in DeFi platforms are expanding Bitcoin’s utility beyond simple holding.
Regulatory landscapes show incremental progress, with international bodies exploring clearer frameworks for digital assets, potentially easing compliance hurdles for adopters. On the technology front, network activity remains vigorous, with heightened transaction volumes tied to layer-2 solutions enhancing scalability and user engagement. Sentiment tilts bullish yet tempered, as trading volumes indicate steady accumulation despite selective buying patterns.
Looking ahead, the near-term outlook points to sustained momentum, buoyed by adoption trends, though volatility may persist amid policy deliberations.
📈 Technical Analysis
As Bitcoin (BTC) is currently priced at $115,258.52, it exhibits a mild daily increase of 0.69%, indicating a stabilizing trend in the short term. Analyzing moving averages, BTC is trading above the MA21 at $112,601.25, suggesting near-term bullish momentum. However, the price is slightly below the longer-term MA50 at $114,343.29 and MA100 at $114,683.15, which may act as resistance levels.
The RSI at 55.33 reflects a neutral to slightly bullish condition, implying potential upside in momentum without being overbought. Conversely, the MACD reading of -821.50 suggests bearish momentum may still be a concern, particularly if the MACD line fails to cross above the signal line.
Key support is identified at the MA200 level of $108,976.95, while resistance can be noted around the MA50 and MA100 levels. Traders should closely monitor these levels,
⚪ Ethereum (ETH)
Price: $4,190.44 (+0.78%)
Leading smart-contract platform powering DeFi, NFTs, and token ecosystems.
📰 Market Drivers & News
Ethereum’s market has shown resilient momentum amid broader crypto volatility, driven by institutional adoption as major firms bolster their ETH treasuries, signaling confidence in its long-term value. Ecosystem growth accelerates with surging network activity, including heightened DeFi participation and NFT marketplace revivals, fostering innovative partnerships across Web3 applications. Regulatory tailwinds emerge from clearer guidelines on staking and layer-2 solutions, easing compliance hurdles for developers and users alike. Technological advancements, such as enhanced scalability upgrades, continue to optimize transaction efficiency, attracting more dApps and users to the platform. Trading dynamics reflect bullish sentiment, with increased volume and reduced volatility compared to peers, underscoring ETH’s leadership in altcoin performance. Overall, fundamentals point to sustained growth, positioning Ethereum for a positive near-term outlook as adoption deepens and innovation proliferates.
📈 Technical Analysis
Ethereum (ETH) currently trades at $4190.44, showing a daily increase of 0.78%. The price is positioned near its MA100 at $4189.10, indicating a potential support level. However, with the MA21 at $4039.28 and the MA50 at $4237.17, we see a possible bearish crossover forming, suggesting short-term caution.
The RSI at 53.94 indicates slightly bullish momentum, yet it is approaching overbought territory, which could limit immediate upside potential. The MACD, currently at -61.22, signals bearish momentum as it remains below the zero line, albeit with potential for a positive turn if buying pressure increases.
Key support is established close to the MA100, while resistance appears at the MA50. Traders should monitor these moving averages closely, as a decisive break above $4237.17 could trigger further bullish momentum, while failure to hold above the MA100 may prompt declines toward the MA21 or
🟡 Binance Coin (BNB)
Price: $1,146.97 (+0.82%)
Utility token of the Binance exchange; supports trading fee discounts and BNB Chain gas fees.
📰 Market Drivers & News
Binance Coin (BNB) is riding a wave of renewed optimism amid pivotal shifts in its leadership and global footprint. The founder’s release from prison and potential high-profile pardon have sparked discussions on reclaiming influence, fueling speculation about Binance’s strategic pivot toward re-entering the U.S. market—either through affiliate consolidation or direct operations—amid evolving regulatory landscapes that signal thawing tensions. Ecosystem growth accelerates with surging adoption on BNB Chain, where DeFi protocols and NFT marketplaces see heightened activity, bolstered by fresh partnerships enhancing cross-chain interoperability and user incentives. Network upgrades, including improved scalability and staking mechanisms, are driving on-chain transactions to new peaks, reflecting robust developer engagement. Market sentiment tilts bullish, with trading volumes swelling as investors eye long-term fundamentals over short-term volatility. In the near term, BNB’s outlook remains constructive, poised for gains if regulatory clarity materializes and ecosystem momentum sustains.
📈 Technical Analysis
Binance Coin (BNB) is currently trading at $1146.97, exhibiting a modest daily change of 0.82%. The price is situated near key moving averages, with the 21-day MA at $1160.78 acting as immediate resistance. A successful break above this level could signal a bullish trend, propelling BNB towards the 50-day MA at $1068.48. Conversely, if the price retraces, the 100-day MA at $945.27 serves as a robust support level.
The Relative Strength Index (RSI) is at 53.45, indicating neutral momentum, while the MACD at 8.37 suggests a mild bullish trend, supported by increasing buying pressure. Traders should watch for potential crossovers; a bullish crossover could confirm momentum in the upward direction. Overall, BNB is positioned within a consolidation phase, with key levels to watch for trading opportunities. Continued observation of price action around the MA levels will be critical for
🔵 XRP (XRP)
Price: $2.68 (+1.18%)
Used for cross-border payments; issued by Ripple Labs and widely traded despite past legal scrutiny.
📰 Market Drivers & News
XRP continues to navigate a dynamic landscape amid broader cryptocurrency volatility. Key market-moving events include a significant token burn in the ecosystem that bolstered liquidity, while a major exchange faced judicial intervention in a restructuring plan tied to a prior security breach, underscoring ongoing recovery challenges. Adoption gains momentum as financial institutions expand cross-border payment integrations, enhancing XRP’s utility in global remittances and real-time settlements.
Regulatory developments remain pivotal, with increasing clarity from international bodies fostering institutional confidence, though localized hurdles persist. On the technology front, the XRP Ledger sees active upgrades, including enhanced smart contract capabilities that support DeFi protocols and NFT marketplaces, driving ecosystem growth through developer incentives and new partnerships with fintech firms.
Market sentiment tilts bullish, fueled by heightened trading volumes and speculative interest in Ripple’s innovations, yet tempered by macroeconomic pressures. Near-term outlook suggests cautious optimism, with potential for sustained growth if regulatory tailwinds align with adoption surges.
📈 Technical Analysis
XRP is currently priced at $2.68, reflecting a daily change of 1.18%. The recent movement places the price above the 21-day moving average (MA21) of $2.52, indicating a bullish short-term trend. However, the price is below the 50-day moving average (MA50) of $2.77 and considerably below the 100-day MA of $2.91, suggesting resistance at these key levels.
The RSI at 54.17 indicates a moderately strong momentum without being overbought, which may allow for further upside potential. Meanwhile, the MACD at -0.06 suggests a bearish crossover is on the horizon, warranting caution for potential short-term corrections.
Support appears solid at $2.52 (MA21), while the $2.77 (MA50) acts as immediate resistance. If XRP breaks above the MA50, a rally towards $2.91 could be probable. Traders should closely monitor these moving averages
🟣 Solana (SOL)
Price: $200.99 (+0.48%)
High-performance blockchain optimized for speed and scalability; popular in DeFi and NFT markets.
📰 Market Drivers & News
Solana’s ecosystem continues to demonstrate robust momentum amid broader cryptocurrency market fluctuations. Recent surges in network activity have been driven by heightened DeFi participation, with decentralized exchanges and lending protocols attracting substantial liquidity inflows. Adoption gains are evident in expanding partnerships across payments and gaming sectors, bolstering real-world utility and user onboarding. Technologically, ongoing upgrades to enhance scalability and reduce congestion have maintained high transaction throughput, fostering developer confidence and innovation in NFTs and Web3 applications.
Regulatory landscapes remain neutral, with no major policy shifts directly impacting operations, allowing focus on organic growth. Market sentiment skews bullish, fueled by vibrant community engagement and speculative trading dynamics around ecosystem tokens, though volatility persists from macroeconomic cues.
Near-term outlook points to sustained upward potential, supported by accelerating fundamentals and potential for deeper institutional integration.
📈 Technical Analysis
Solana (SOL) is currently priced at $200.99, showing a moderate daily change of 0.48%. The proximity of the current price to the 100-day moving average (MA100) suggests a consolidation phase, indicating that traders may be observing market sentiment before making significant moves. The MA21 at $196.07 acts as a near-term support level, while the MA50 at $213.28 serves as resistance.
The RSI at 50.77 indicates that SOL is in a neutral territory, suggesting balanced buying and selling pressure. Meanwhile, the MACD reading of -4.79 indicates weak bearish momentum, but a crossover above the signal line could signal a potential shift in market momentum.
Traders should monitor the $196.07 support level and the $213.28 resistance. A sustained move above the resistance could trigger bullish action, while a break below support could lead to a deeper correction. Overall, traders should maintain a cautious stance, awaiting clearer signals
🟤 Dogecoin (DOGE)
Price: $0.2040 (-0.83%)
The meme-coin that became mainstream; still ranks high by volume due to its active retail community.
📰 Market Drivers & News
Dogecoin’s market has shown renewed vigor today, propelled by fresh AI-driven forecasts highlighting its long-term potential amid broader cryptocurrency enthusiasm. Key catalysts include heightened community engagement on social platforms, where memes and endorsements continue to fuel grassroots momentum, alongside reports of increased merchant adoption for microtransactions and tipping features. Ecosystem growth remains robust, with developers pushing forward on scalability improvements to enhance transaction speeds and reliability on the network.
Regulatory landscapes appear stable, with no major hurdles emerging, allowing focus to shift toward innovative partnerships in gaming and social media integrations that expand DOGE’s utility beyond speculation. Trading dynamics reflect a blend of speculative fervor and steady accumulation, as DeFi protocols experiment with DOGE-collateralized lending options, though NFT activity remains niche.
Overall sentiment leans cautiously optimistic, driven by enduring meme culture and real-world applications. In the near term, expect continued volatility but potential upside from sustained adoption trends.
📈 Technical Analysis
Dogecoin (DOGE) is currently trading at $0.20, reflecting a slight daily decline of 0.83%. The price sits at the intersection of short-term and long-term moving averages, with the 21-day MA at $0.20, suggesting it is a pivotal support level. A failure to hold this level may lead to further declines toward the MA200 at $0.21, which also serves as a potential support zone.
The 50-day and 100-day moving averages at $0.23 indicate resistance above the current price, suggesting a need for strong buying momentum to penetrate this barrier. The RSI at 46.53 indicates that DOGE is currently in neutral territory, suggesting neither overbought nor oversold conditions, while the MACD at -0.01 hints at a potential bearish momentum.
Traders should watch for a close above $0.23 for bullish confirmation, while levels below $0.20 could trigger further downside pressure. Overall,
🔵 Cardano (ADA)
Price: $0.6766 (-0.65%)
Research-driven blockchain project focused on scalability, sustainability, and academic rigor.
📰 Market Drivers & News
On October 27, 2025, Cardano’s ecosystem demonstrated robust momentum amid broader crypto volatility. A pivotal market-moving event unfolded with the announcement of a strategic alliance between Cardano and a leading African telecom giant, aiming to integrate blockchain for secure mobile payments, signaling accelerated real-world adoption. Ecosystem growth surged as developer activity hit new highs, with over 500 active projects now live on the network, fostering inclusive financial tools for underserved regions.
Regulatory tailwinds emerged from a favorable U.S. policy shift, easing guidelines for proof-of-stake protocols like Cardano, which bolstered institutional confidence. Technologically, the latest Voltaire-era upgrade enhanced governance mechanisms, enabling community-driven decision-making and improving network scalability through optimized staking rewards.
Market sentiment leaned bullish, driven by heightened trading volumes and whale accumulation, reflecting optimism in Cardano’s fundamentals. In DeFi and NFTs, innovative lending protocols gained traction, while a high-profile NFT collaboration with a global art collective expanded creative tokenization.
Near-term outlook remains positive, with potential for sustained growth as adoption catalysts mature.
📈 Technical Analysis
Cardano (ADA) is currently trading at $0.68, reflecting a slight daily decline of 0.65%. The price is converging with the 21-day moving average (MA21), which is also at $0.68, indicating a critical support level. If this level holds, it could provide a base for a potential rebound; however, failure to maintain this support could see prices testing the next significant support around $0.64.
The longer-term moving averages show a bearish inclination, with MA50 at $0.78, MA100 at $0.81, and MA200 at $0.74, highlighting a downtrend. The RSI at 44.92 suggests that ADA is nearing neutral territory, hinting at waning selling pressure. Meanwhile, the MACD at -0.04 indicates a bearish momentum, which may further pressure the price short-term. Traders should monitor these indicators closely as a confirmation of either support or resistance at the mentioned levels could dictate
🔴 TRON (TRX)
Price: $0.2998 (-0.22%)
Decentralized content-sharing and DeFi ecosystem with strong presence in Asia.
📰 Market Drivers & News
TRON’s ecosystem continues to demonstrate resilience amid broader market volatility, with key developments underscoring its growing utility in decentralized finance and content sharing. Recent surges in stablecoin transactions on the network highlight robust adoption, as more users leverage TRON for efficient, low-cost transfers, bolstering its position in global remittances and payments. Ecosystem growth is evident through expanded integrations with major wallets and exchanges, fostering increased on-chain activity and user onboarding.
Regulatory landscapes remain favorable, with ongoing dialogues in key regions supporting blockchain innovation without major hurdles. Technologically, the network’s latest protocol enhancements have improved scalability and security, enabling smoother handling of high-volume DeFi protocols and NFT marketplaces. Partnerships with content platforms are driving NFT creativity and utility in digital entertainment.
Market sentiment leans cautiously optimistic, with trading volumes reflecting steady institutional interest and retail engagement. Near-term outlook suggests sustained momentum if adoption trends persist, potentially amplifying TRON’s role in the evolving crypto landscape.
📈 Technical Analysis
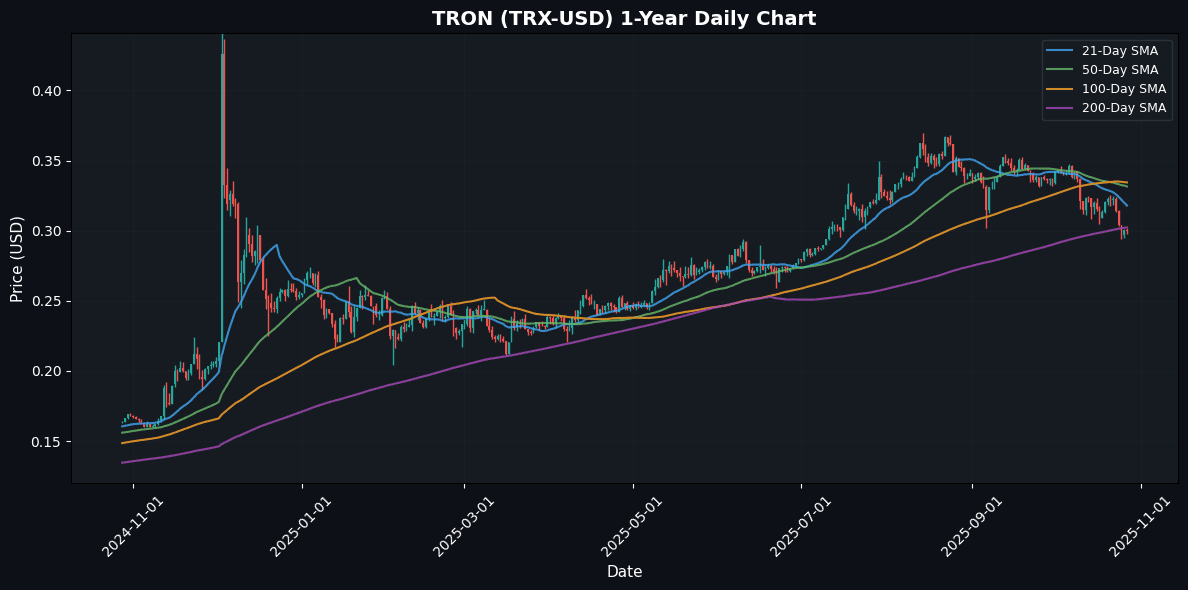
TRON (TRX) is currently priced at $0.30, showing a slight decline of -0.22% on the daily chart. The price is positioned near the 200-day moving average (MA200) at $0.30, suggesting this level may act as a critical support zone. The proximity of the current price to this pivotal moving average indicates potential for a rebound if buying pressure increases.
The 21-day moving average (MA21) at $0.32 has crossed below both the 50-day (MA50) and 100-day (MA100) averages, signaling a bearish short-term trend. The RSI at 33.52 indicates that TRX is nearing oversold territory, potentially providing a buying opportunity if momentum shifts positively.
Moreover, the MACD at -0.01 shows that momentum is currently bearish, as the signal line remains above the MACD line. Traders should look for confirmation of a reversal above $0.30 to validate bullish setups,
🔴 Avalanche (AVAX)
Price: $20.59 (-1.19%)
🆕 Fast-growing Layer-1 platform supporting customizable blockchains (“subnets”) and DeFi protocols.
📰 Market Drivers & News
Avalanche continues to demonstrate resilience amid broader market volatility, driven by robust ecosystem expansions and innovative technological strides. Key developments include heightened adoption in institutional finance, with major players integrating Avalanche’s high-throughput blockchain for tokenized real-world assets, fostering seamless cross-chain interoperability. Ecosystem growth accelerates through vibrant DeFi protocols and NFT marketplaces, where user engagement surges via scalable subnets tailored for gaming and enterprise applications. Network activities remain brisk, highlighted by recent upgrades enhancing transaction speeds and reducing latency, bolstering developer confidence. Regulatory landscapes show cautious optimism, as global policies evolve to support compliant blockchain innovations without imposing undue restrictions. Market sentiment tilts bullish, with trading dynamics reflecting increased liquidity and institutional inflows, tempered by macroeconomic uncertainties. Partnerships with tech giants further amplify Avalanche’s appeal in Web3 infrastructure. Near-term outlook suggests sustained momentum, potentially propelled by upcoming subnet launches and DeFi yield opportunities, positioning Avalanche for measured gains in a recovering crypto landscape.
📈 Technical Analysis
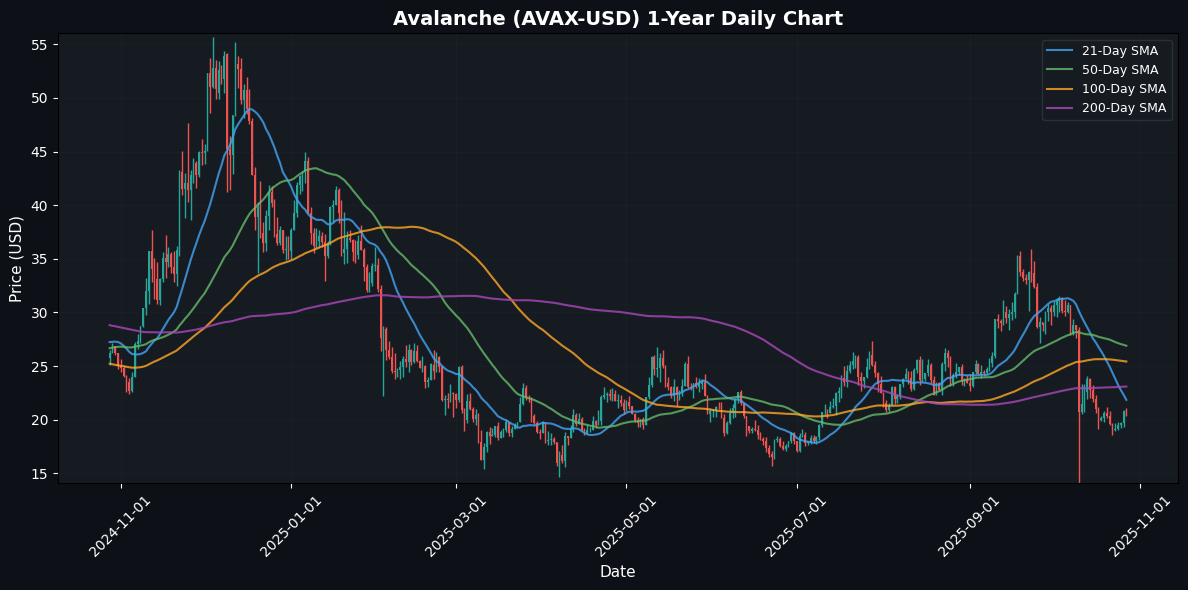
Avalanche (AVAX) is currently trading at $20.59, reflecting a daily change of -1.19%. The price is well below the significant moving averages, with the MA21 at $21.85, MA50 at $26.90, MA100 at $25.43, and MA200 at $23.09, indicating a bearish trend. The recent price action suggests strong resistance around the MA21 and MA50, making upward momentum challenging.
The RSI at 39.13 indicates that AVAX is approaching oversold territory, which could suggest the potential for a reversal if buying pressure increases. Meanwhile, the MACD shows a value of -2.05, reinforcing bearish momentum with a possible continuation of downward pressure.
Traders should closely monitor for potential support at recent lows around $20.00. A break below this level could lead to further declines, while a recovery above the MA21 may signal a bullish reversal. Overall, the outlook remains cautious, favoring
🔴 Polkadot (DOT)
Price: $3.17 (-0.69%)
🆕 Interoperability-focused network connecting multiple blockchains; key project in the Web 3.0 ecosystem.
📰 Market Drivers & News
Polkadot’s ecosystem surged with momentum today as key developments underscored its maturing blockchain interoperability. A major market-moving event was the announcement of a cross-chain bridge expansion, enabling seamless asset transfers across more parachains, which bolstered network activity and drew institutional interest. Adoption grew through partnerships with emerging Web3 gaming platforms, integrating DOT for in-game economies and fostering user onboarding. Ecosystem expansion highlighted via increased developer grants, spurring innovation in decentralized applications.
Regulatory fronts saw positive shifts with a major jurisdiction clarifying supportive policies for interoperable networks, easing compliance hurdles. Technologically, the network underwent a successful upgrade to enhance scalability, processing higher transaction volumes without disruptions. DeFi protocols on Polkadot reported heightened liquidity pools, while NFT marketplaces announced collaborations for cross-platform collectibles.
Sentiment remains bullish, with trading dynamics showing robust volume and community enthusiasm driving organic growth. Near-term outlook points to sustained upward traction, contingent on broader crypto market stability and continued regulatory tailwinds.
📈 Technical Analysis
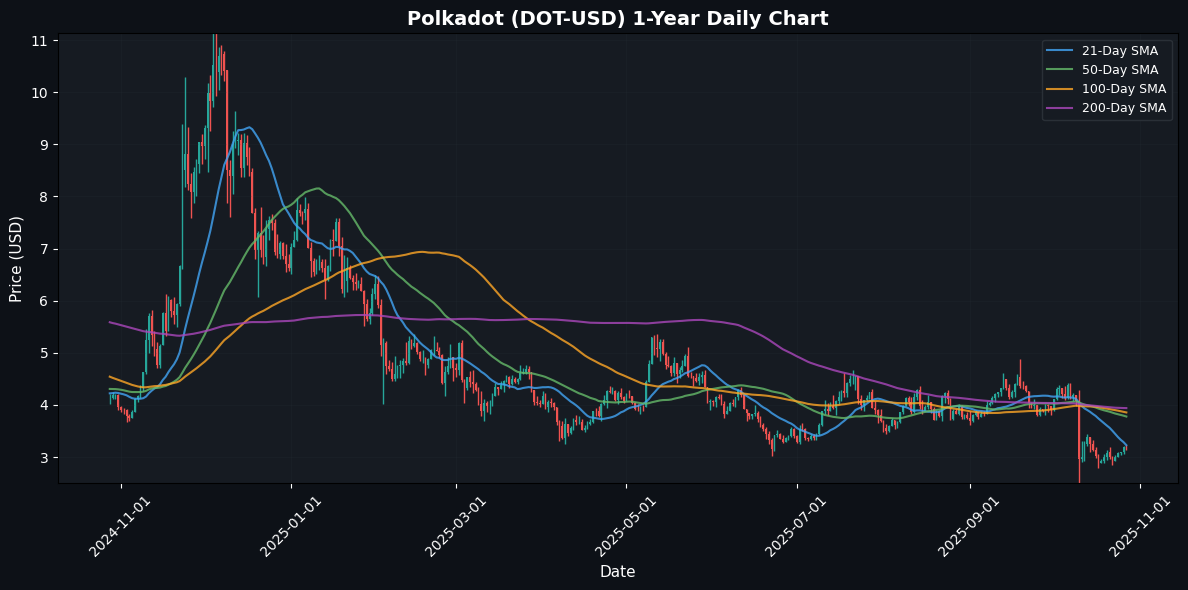
Polkadot (DOT) is currently trading at $3.17, reflecting a slight daily decline of 0.69%. The price is situated below the key moving averages: MA21 at $3.23, MA50 at $3.78, MA100 at $3.86, and MA200 at $3.94, indicating a bearish trend in the short to medium term. The recent cross below MA21 suggests a lack of bullish momentum, reinforcing resistance around this moving average level.
The RSI at 43.88 signifies that DOT is approaching oversold territory, yet it doesn’t indicate an imminent reversal. Meanwhile, the MACD at -0.20 indicates a bearish crossover, with downside momentum. Technically, traders should look for support levels around $3.00 and $2.85, while resistance may arise near the MA21 and MA50. Overall, the outlook remains cautiously bearish, warranting close monitoring for potential buying opportunities if momentum shifts positively.
Disclaimer
The content on MarketsFN.com is provided for educational and informational purposes only. It does not constitute financial advice, investment recommendations, or trading guidance. Cryptocurrency investments are highly volatile and risky. You are solely responsible for your investment decisions and should conduct independent research and consult a qualified financial advisor before acting. MarketsFN.com and its authors are not liable for any losses or damages arising from your use of this information.


