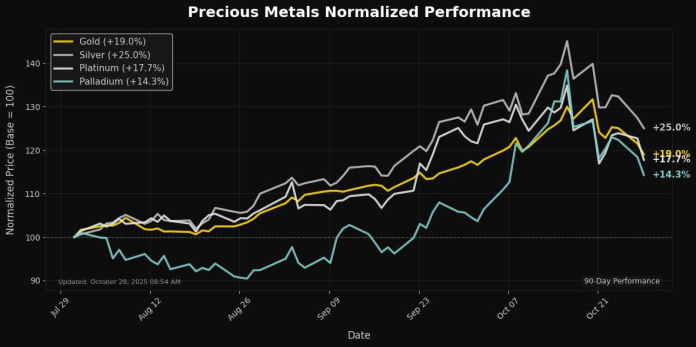
Precious Metals Update: Palladium Plunges 4.64% – RSI at 48
📊 Market Overview
Report Date: October 28, 2025
| Metal | Price | Daily Change (%) | MA21 | MA50 | MA100 | MA200 | RSI | MACD |
|---|---|---|---|---|---|---|---|---|
| Gold | $3918.70 | -2.50% | $4040.32 | $3775.50 | $3562.74 | $3314.92 | 47.03 | 80.18 |
| Silver | $45.71 | -2.34% | $48.30 | $44.28 | $40.79 | $36.72 | 45.60 | 0.84 |
| Platinum | $1514.70 | -4.47% | $1609.14 | $1491.08 | $1420.01 | $1204.33 | 45.34 | 15.62 |
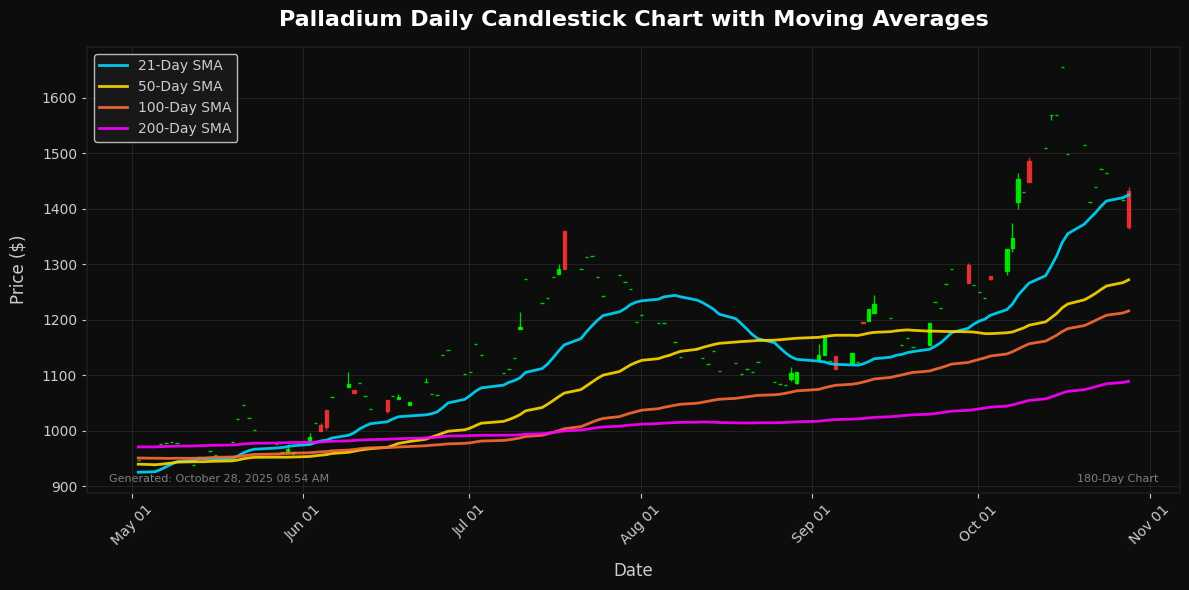
| Palladium | $1367.00 | -4.64% | $1424.77 | $1272.02 | $1216.00 | $1089.41 | 47.87 | 46.88 |
🔸 Gold
Market News
In the last 12 hours since October 27, 2025, 08:53 PM, the gold market has shown no significant recent developments, remaining in a phase of quiet consolidation amid broader economic signals. Prices have held steady without notable volatility, as investors appear to await clearer indicators on global trade dynamics and central bank policies. Geopolitical tensions in key regions have not escalated, contributing to subdued demand trends, while supply chains from major producers continue uninterrupted. This lull has fostered a cautious investor sentiment, with positions neither aggressively building nor unwinding. Near-term implications suggest gold could test support levels if uncertainty lingers, but any fresh catalysts—such as policy announcements—might quickly reignite momentum, potentially driving prices toward resistance thresholds. Overall, the absence of catalysts points to a stable, watchful stance in the immediate outlook.
Technical Analysis
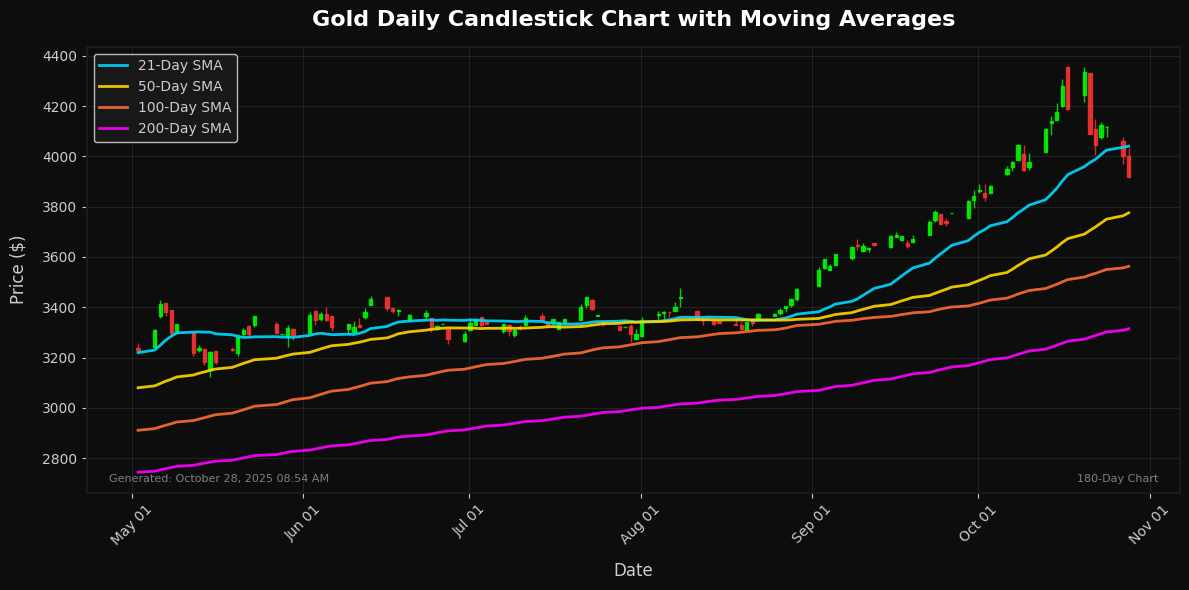
Gold is currently trading at $3918.70, reflecting a daily decline of 2.50%. The recent price action indicates bearish momentum, with the current value positioned between key moving averages: above the MA200 at $3314.92 but below the MA50 at $3775.50 and the MA21 at $4040.32. This placement suggests that resistance is found near the MA21, while potential support is indicated by the MA50.
The RSI at 47.03 shows that gold is approaching oversold territory, which may offer a buying opportunity if it maintains above the MA100 at $3562.74. The MACD reading of 80.18 suggests a positive trend, though the recent price action points to weakening momentum. In the near term, traders should watch for a decisive breakout above $4040.32 for bullish momentum or a breakdown below $3775.50 to confirm further downside potential. Overall, caution is advised as volatility persists.
🔸 Silver
Market News
No significant recent developments.
Technical Analysis
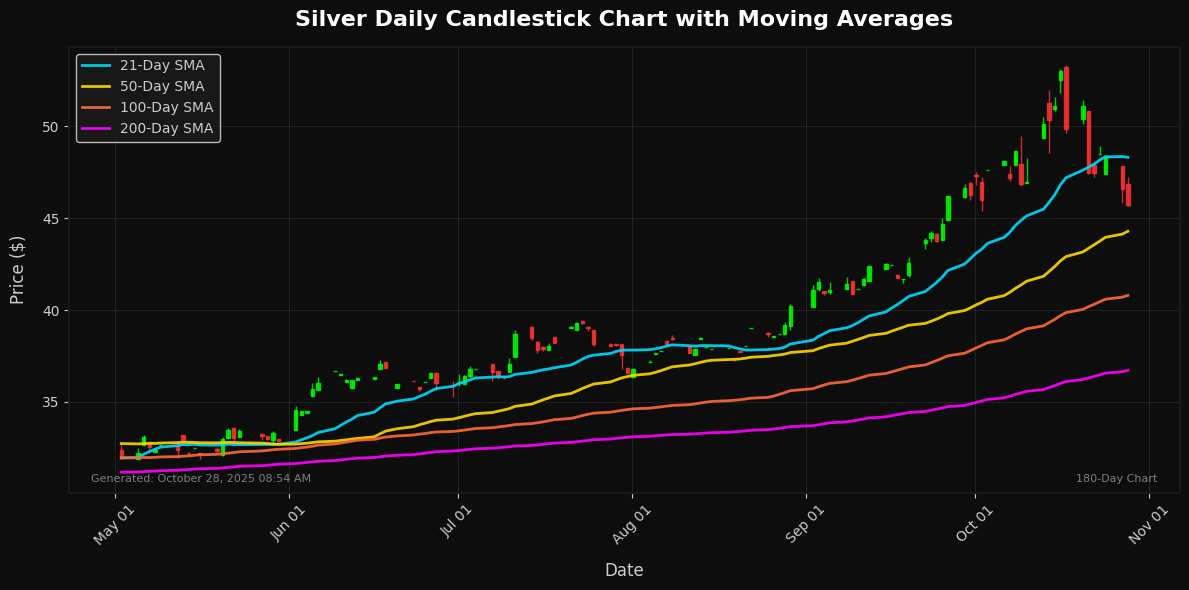
As of the latest trading session, Silver is priced at $45.71, reflecting a daily decline of 2.34%. The recent bearish movement suggests a potential reversal of the uptrend established earlier this year. The 21-day moving average (MA21) at $48.30 acts as a key resistance level, while the 50-day MA at $44.28 serves as initial support. Should the price breach this level, further support could be found at the 100-day MA of $40.79.
The Relative Strength Index (RSI) at 45.60 indicates that Silver is neither overbought nor oversold, suggesting a balanced momentum. The MACD reading of 0.84 demonstrates bullish momentum but is showing signs of potential weakening as the trend cools.
Overall, the outlook for Silver remains cautious; a close below the 50-day MA may signal further downside risks, while a reclaim of the MA21 could ignite renewed buying interest. Traders should closely
🔸 Platinum
Market News
No significant recent developments in the past 12 hours.
Technical Analysis
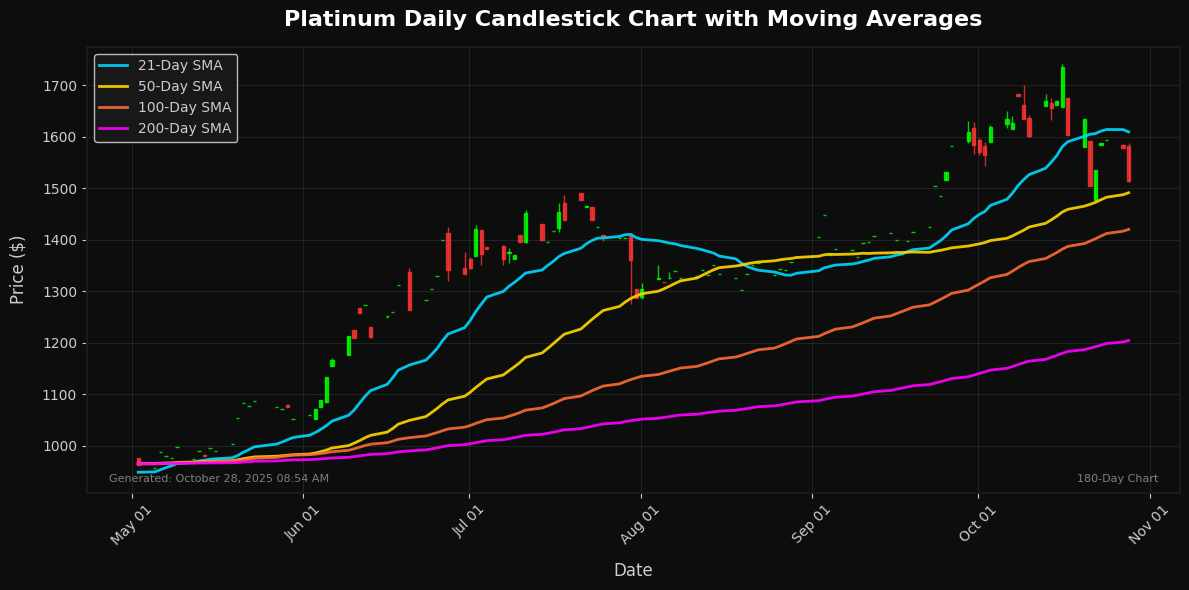
Platinum is currently trading at $1514.70, reflecting a daily decline of 4.47%. The asset’s recent price movement suggests a bearish trend as it sits below the 21-day moving average (MA21) of $1609.14, indicating potential resistance above current levels. Meanwhile, the 50-day moving average (MA50) at $1491.08 serves as an immediate support level, while the longer-term support can be found at the MA100 of $1420.01.
The Relative Strength Index (RSI) at 45.34 indicates a neutral momentum situation, showing limited buying pressure, while the MACD at 15.62 implies some bullish momentum, albeit weakening. Overall, if prices remain below the MA21, further downside towards the MA50 and possibly the MA100 becomes plausible. A break above $1609.14 could signal a trend reversal. Traders should monitor these moving averages closely for signs of potential market shifts.
🔸 Palladium
Market News
No significant recent developments in the past 12 hours.
Technical Analysis
Palladium is currently trading at $1367.00, reflecting a daily decline of 4.64%. This downturn positions the metal near its short-term moving averages. The MA21 at $1424.77 serves as immediate resistance, while the MA50 at $1272.02 provides critical support. The longer-term MAs (MA100 at $1216.00 and MA200 at $1089.41) indicate a bullish trend over the past months but suggest potential bearish sentiment in the near term given the current price action.
The RSI is at 47.87, indicating a neutral momentum, while the MACD at 46.88 hints at a weakening bullish trend. This combination suggests that palladium could consolidate around current levels before deciding on a direction. A sustained break above $1425 could reignite bullish sentiment, while a drop below $1272 would reinforce a bearish outlook. Traders should monitor these key levels closely for potential trading opportunities.
Disclaimer
The content on MarketsFN.com is provided for educational and informational purposes only. It does not constitute financial advice, investment recommendations, or trading guidance. All investments involve risks, and past performance does not guarantee future results. You are solely responsible for your investment decisions and should conduct independent research and consult a qualified financial advisor before acting. MarketsFN.com and its authors are not liable for any losses or damages arising from your use of this information.


