Energy Update: Natural Gas Plunges 3.28%
📊 Market Overview
Report Date: October 28, 2025
| Commodity | Price | Daily Change (%) | MA21 | MA50 | MA100 | MA200 | RSI | MACD |
|---|---|---|---|---|---|---|---|---|
| Crude Oil (WTI) | $60.20 | -1.81% | $59.77 | $61.58 | $62.61 | $63.12 | 49.32 | -0.48 |
| Brent Oil | $64.48 | -1.74% | $63.91 | $65.64 | $66.37 | $66.82 | 49.98 | -0.42 |
| Natural Gas | $3.87 | -3.28% | $3.93 | $3.88 | $4.15 | $4.47 | 47.14 | 0.02 |
Technical Analysis
As of the latest data, Crude Oil (WTI) is currently trading at $60.20, reflecting a daily decline of 1.81%. The 21-day moving average (MA21) at $59.77 serves as immediate support, indicating a potential reversal point if prices dip further. Meanwhile, the 50-day MA at $61.58 and the 100-day MA at $62.61 present key resistance levels that could impede upward momentum.
The Relative Strength Index (RSI) sits at 49.32, suggesting that the market is currently neutral, with no strong overbought or oversold conditions. However, the MACD indicator at -0.48 indicates bearish momentum, which could further pressure prices in the short term.
Traders should watch for price action around the MA21 as a critical pivot point. A breach below this level might expose further downside, while a recovery above the 50-day MA could signal a bullish turnaround. Overall, a
⚡ Brent Oil
Technical Analysis
Brent Oil is currently trading at $64.48, reflecting a daily decline of 1.74%. The short-term trend is slightly bearish as the price is hovering just above the 21-day moving average (MA21) at $63.91. This level could act as immediate support; a breach below could see further downside, targeting the MA50 at $65.64 as the next resistance point.
On the momentum front, the Relative Strength Index (RSI) is at 49.98, indicating a neutral phase with potential for either direction. The MACD at -0.42 signifies bearish momentum, but it’s essential to note the lack of strong selling pressure at this stage.
Overall, the market appears to be at a critical juncture. A sustained move below the MA21 may lead to further bearish sentiment, while a rebound could trigger a retest of the MA50 and potentially the upper resistance levels around $66.37 and $66.82. Traders should watch
⚡ Natural Gas
Market News
In the last 12 hours, the natural gas market has shown minimal volatility, with prices holding steady around recent levels amid a quiet trading session. Demand remains balanced, supported by mild weather patterns across key regions that have curbed heating needs, while supply chains report no disruptions from production or logistics. Inventory levels are tracking seasonal norms without surprises, and geopolitical tensions appear subdued, lacking fresh catalysts to sway sentiment. Traders express cautious optimism, focusing on upcoming data releases rather than immediate shifts. Overall, market sentiment leans neutral, with low trading volumes reflecting a wait-and-see approach. Near-term implications suggest continued stability unless unexpected weather changes or supply alerts emerge, potentially keeping prices range-bound in the short horizon. (118 words)
Technical Analysis
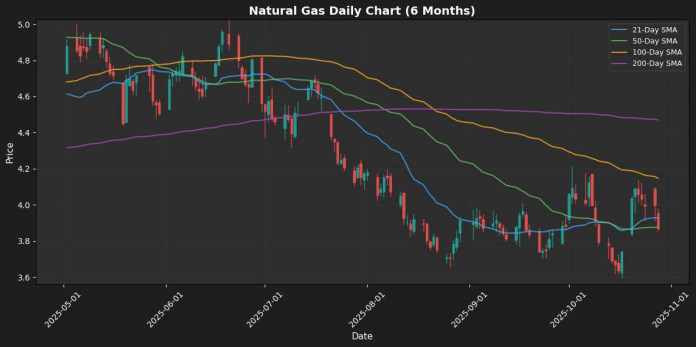
Natural Gas is currently trading at $3.87, reflecting a daily decline of 3.28%. The price has fallen below the 21-day moving average (MA21) of $3.93, indicating short-term bearish sentiment. Additionally, the price is slightly above the 50-day moving average (MA50) of $3.88, which could act as a support level. The longer-term averages, such as the 100-day (MA100) and 200-day (MA200) at $4.15 and $4.47, respectively, suggest the overarching trend remains bearish.
The Relative Strength Index (RSI) at 47.14 indicates a neutral momentum, leaving room for either upward correction or further decline. With the MACD at 0.02, momentum is weak but shows signs of potential reversal. Traders should monitor resistance near the MA21 and MA100. A break below the MA50 could signal further downside, while a rally above $3.
Disclaimer
The content on MarketsFN.com is provided for educational and informational purposes only. It does not constitute financial advice, investment recommendations, or trading guidance. All investments involve risks, and past performance does not guarantee future results. You are solely responsible for your investment decisions and should conduct independent research and consult a qualified financial advisor before acting. MarketsFN.com and its authors are not liable for any losses or damages arising from your use of this information.


