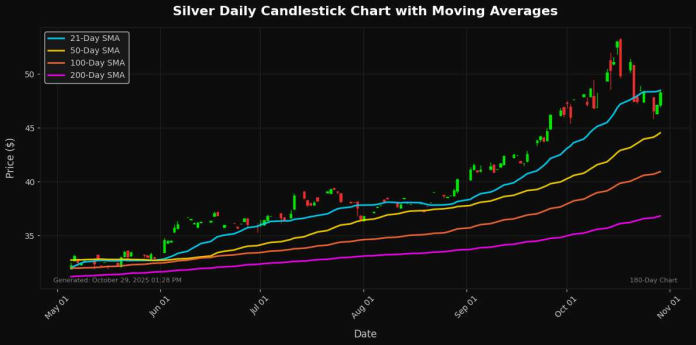
Precious Metals Update: Silver Rallies 2.01% – RSI at 54
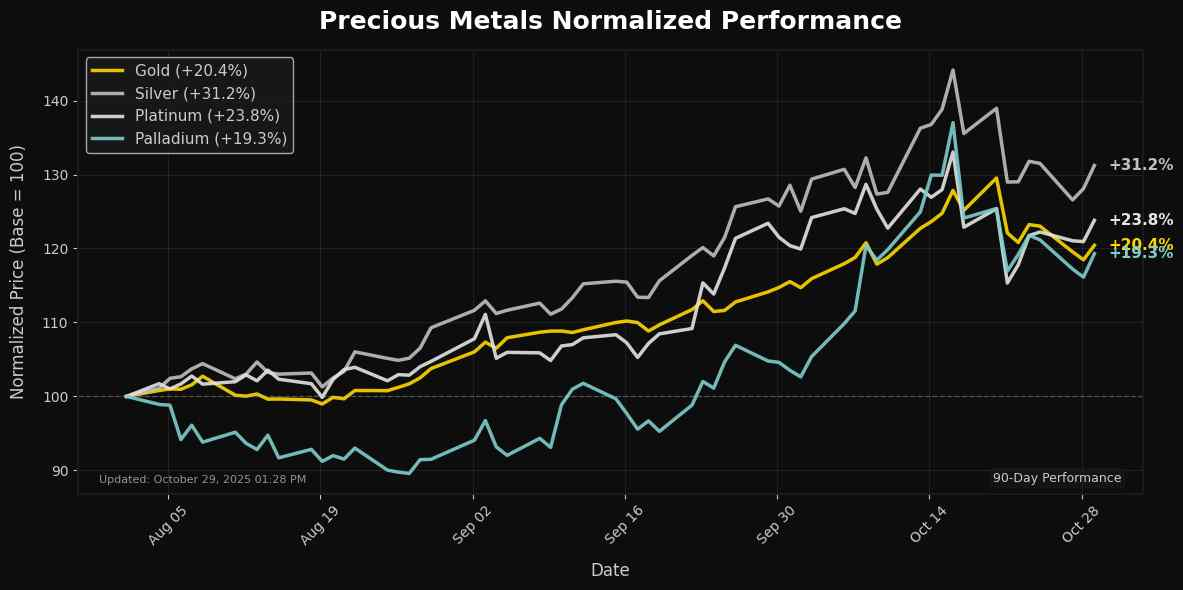
📊 Market Overview
Report Date: October 29, 2025
| Metal | Price | Daily Change (%) | MA21 | MA50 | MA100 | MA200 | RSI | MACD |
|---|---|---|---|---|---|---|---|---|
| Gold | $4031.60 | +1.23% | $4051.67 | $3790.81 | $3570.21 | $3321.93 | 52.97 | 74.91 |
| Silver | $48.28 | +2.01% | $48.47 | $44.53 | $40.92 | $36.82 | 53.61 | 0.89 |
| Platinum | $1614.50 | +1.87% | $1613.53 | $1498.57 | $1424.65 | $1208.04 | 54.36 | 20.85 |
| Palladium | $1441.00 | +1.59% | $1434.92 | $1279.52 | $1220.16 | $1092.12 | 54.35 | 45.61 |
🔸 Gold
Technical Analysis
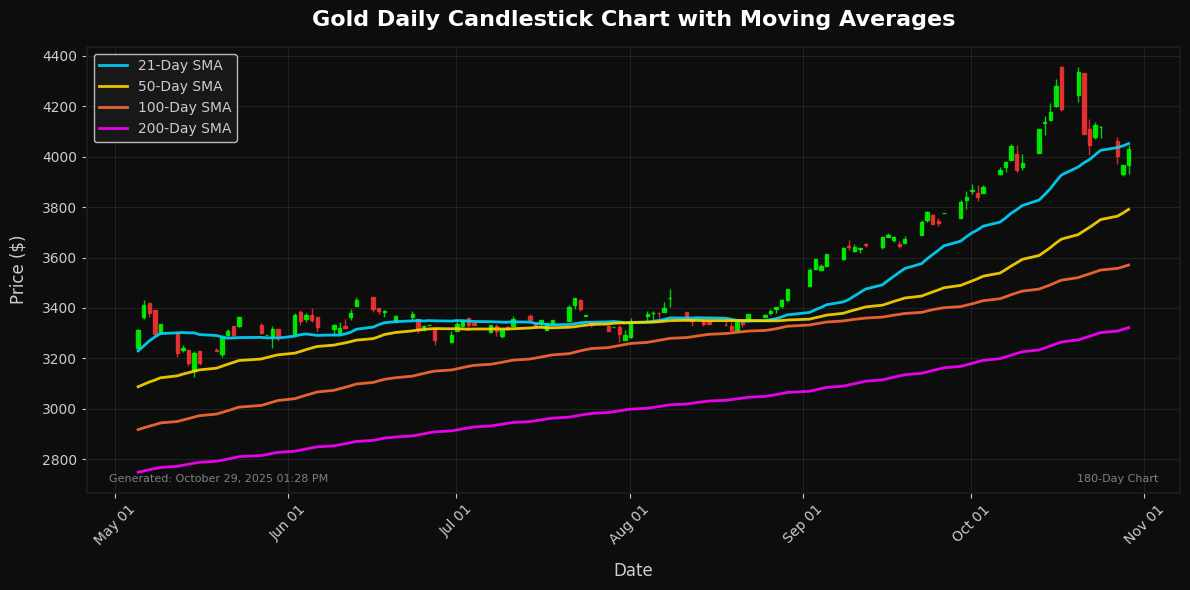
As of the latest trading session, Gold is priced at $4031.60, reflecting a daily increase of 1.23%. The asset is currently situated between key moving averages, with the 21-day MA at $4051.67 acting as immediate resistance and the 50-day MA at $3790.81 providing strong support. The proximity of the current price to the 21-day MA suggests a consolidation phase, signaling potential for a breakout or reversal.
Momentum indicators show a bullish sentiment; the RSI stands at 52.97, indicating that Gold is neither overbought nor oversold, while the MACD at 74.91 reflects a strong upward momentum. Should Gold breach the resistance of $4051.67, it could target higher levels, potentially moving towards the 100-day MA at $3570.21. Conversely, a drop below $3790.81 may expose it to further declines. Overall, the outlook remains cautiously optimistic, hinging on macroeconomic
🔸 Silver
Technical Analysis
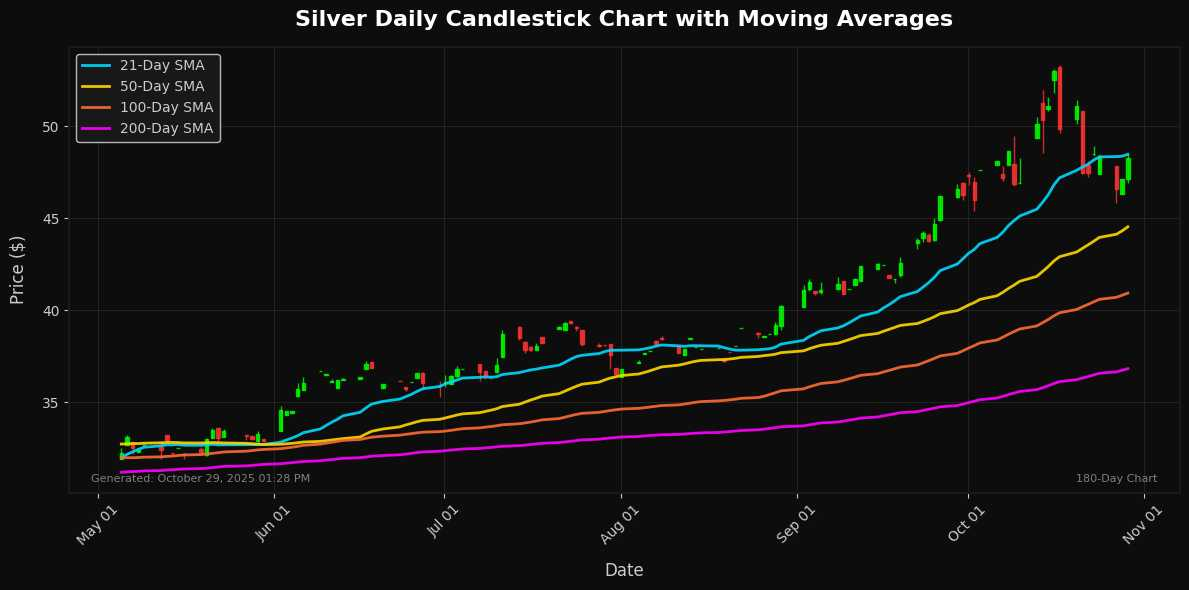
As of the current price of $48.28, silver exhibits a daily increase of 2.01%, reflecting a strong upward momentum in the short term. The price is currently positioned near the 21-day moving average (MA21) of $48.47, indicating potential short-term support and a key level for traders to monitor. Support levels can also be observed at longer-term MAs, with the 50-day MA at $44.53 acting as a significant level if a pullback occurs.
The Relative Strength Index (RSI) stands at 53.61, suggesting that silver is neither overbought nor oversold, allowing for further upward movement without immediate concerns of exhaustion. Additionally, the MACD value of 0.89 indicates bullish momentum, supporting a positive outlook in the near term.
Investors should look for potential resistance at the $50 psychological level. Overall, the outlook remains optimistic, bolstered by strong technicals and current price action, but caution is warranted
🔸 Platinum
Technical Analysis
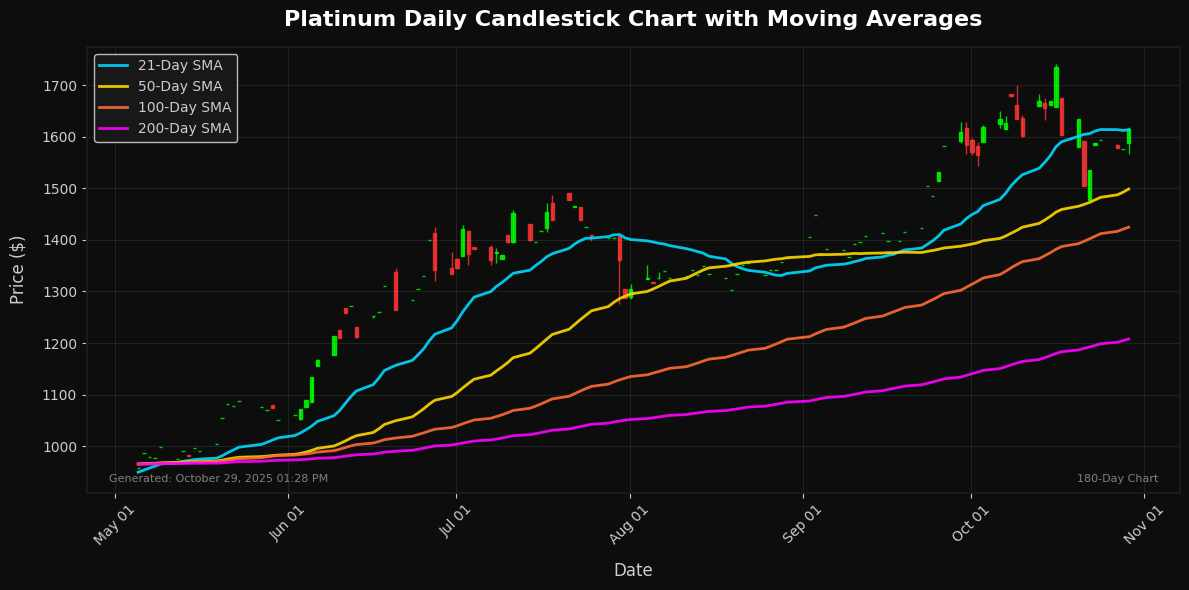
Platinum is currently trading at $1614.50, reflecting a daily increase of 1.87%. The price has successfully breached the 21-day moving average (MA21) of $1613.53, indicating bullish momentum as it aligns above both the 50-day (MA50 at $1498.57) and the 100-day moving averages (MA100 at $1424.65). The RSI at 54.36 suggests that platinum is positioned in neutral territory, indicating potential for continued upward momentum without reaching overbought conditions.
The MACD value of 20.85 reinforces this positive outlook, indicating strengthening bullish momentum. Immediate support is evident around the MA21 level, while resistance can be observed near psychological barriers or recent highs. Overall, if bullish sentiment persists and platinum holds above recent averages, it may challenge higher resistance levels, potentially paving the way towards $1650-$1700. Investors should remain cautious of potential retracements near these targets.
🔸 Palladium
Market News
No significant recent developments in the past 12 hours have emerged regarding Palladium precious metal markets on October 29, 2025. Prices have remained relatively stable, hovering around recent levels without notable fluctuations driven by geopolitical tensions, economic uncertainty, supply disruptions, or shifts in demand trends. Investor sentiment appears cautious but unchanged, with no fresh catalysts prompting buying or selling pressure in the automotive or industrial sectors. This lull suggests a consolidation phase, potentially setting the stage for volatility if upcoming global economic indicators or trade updates introduce new variables in the near term.
Technical Analysis
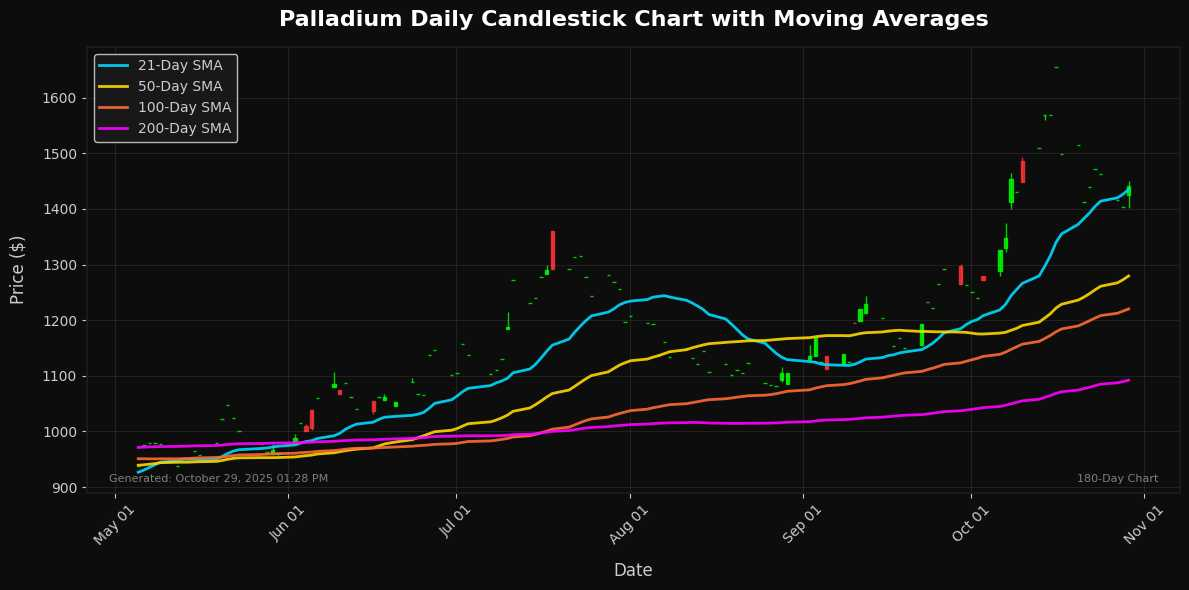
Palladium is currently priced at $1441.00, exhibiting a daily increase of 1.59%. The recent price action indicates strong bullish momentum, as it is trading above its 21-day moving average (MA21) of $1434.92, suggesting short-term strength. Notably, the transformative gains in the MA50 ($1279.52), MA100 ($1220.16), and the MA200 ($1092.12) further underscore a robust long-term bullish trend.
The Relative Strength Index (RSI) stands at 54.35, indicating that palladium is neither overbought nor oversold, which implies continued momentum potential in the near term. The MACD reading of 45.61 further corroborates this positive sentiment, suggesting that the upward trend could persist.
Support levels are found near the MA21, while resistance may arise at psychological or round numbers above the current price. Overall, palladium appears poised for further gains, provided it maintains
Disclaimer
The content on MarketsFN.com is provided for educational and informational purposes only. It does not constitute financial advice, investment recommendations, or trading guidance. All investments involve risks, and past performance does not guarantee future results. You are solely responsible for your investment decisions and should conduct independent research and consult a qualified financial advisor before acting. MarketsFN.com and its authors are not liable for any losses or damages arising from your use of this information.


