Ubiquiti Inc. (UI) Post Earning Analysis
Ubiquiti, Inc., founded by Robert J. Pera in 2003 and based in New York, specializes in the sale of networking equipment and associated software platforms. The company operates through two main segments: Enterprise Technology and Service Provider Technology, offering innovative products and solutions that empower a broad range of customers from businesses to service providers.
Ubiquiti Inc. stock recently experienced a significant drop, as highlighted in a Motley Fool article dated November 7, 2025. Despite this downturn, the company reported strong financial results for the first quarter of fiscal 2026 on the same day. According to reports from Zacks and Associated Press Finance, Ubiquiti’s Q1 earnings and revenues exceeded expectations, with detailed financial results released via Business Wire. This positive performance contrasts sharply with the overall tech sector’s struggles, noted in TheStreet’s reports from November 7, which describe a broader tech sell-off and a decline in consumer confidence impacting market indices like the Nasdaq and Russell 2000.
The juxtaposition of Ubiquiti’s robust quarterly financial performance against its stock’s sudden crash could indicate investor reactions to broader market trends or possibly specific concerns not directly related to the company’s recent financial outcomes. The impact on Ubiquiti’s stock remains notable and warrants close observation for potential recovery or further declines aligned with market or internal company factors.
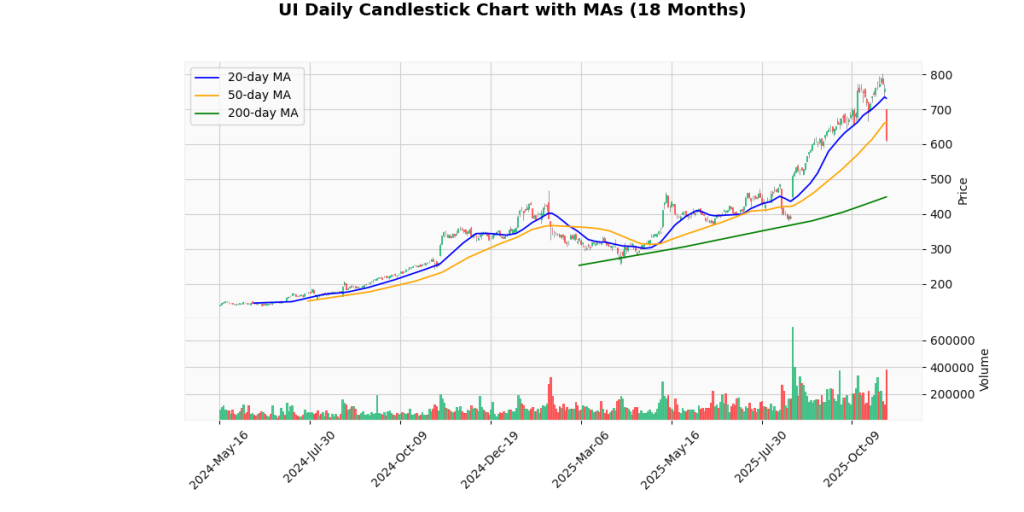
The current price of the asset is $612.19, reflecting a significant drop of -19.4% today. This decline places the asset near its recent week low of $606.67, only slightly above it by 0.91%. The asset has experienced substantial volatility, as indicated by its 52-week range, with a high of $803.6 and a low of $243.43. This year, the price has also fluctuated markedly, ranging from a high of $803.6 to a low of $254.26.
The asset’s price is well below both the 20-day and 50-day moving averages by -16.31% and -7.52% respectively, suggesting a short-term bearish trend. However, it remains 36.41% above the 200-day moving average, indicating a longer-term upward trend.
The Relative Strength Index (RSI) of 34.78 suggests that the asset is approaching oversold territory, potentially signaling a buying opportunity if other conditions align. The Moving Average Convergence Divergence (MACD) of 19.97 also supports the notion of recent bearish momentum. These indicators, combined with the asset’s performance relative to its moving averages and highs/lows, suggest a cautious approach for investors, with potential for rebound if broader market conditions stabilize.
Ubiquiti Inc. (NYSE: UI) reported its financial results for the first quarter of fiscal year 2026 on November 7, 2025. The company posted revenues of $733.8 million, marking a 33.3% increase year-over-year from $550.3 million in Q1 2025, though this represents a slight decrease of 3.3% from the previous quarter’s $759.2 million. GAAP diluted earnings per share (EPS) stood at $3.43, up significantly by 61.8% from $2.12 in the same quarter the previous year but down from $4.41 in Q4 2025. Non-GAAP diluted EPS was reported at $3.46, also showing a substantial year-over-year increase.
Gross profit reached $337.4 million with a gross margin of 46.0%, improving both quarterly and annually. Operating income slightly increased to $261.7 million from $261.4 million in the preceding quarter and from $169.2 million year-over-year. GAAP net income was $207.9 million, a 62.4% increase from the prior year.
Segment-wise, Enterprise Technology revenue was $657.1 million, up 39.6% year-over-year, while Service Provider Technology saw a slight decline. Geographically, revenue increases were notable across North America, Europe, the Middle East, Africa, and Asia Pacific regions.
The company also declared a quarterly cash dividend of $0.80 per share, payable on November 24, 2025. Increases in research and development and administrative expenses were also reported, alongside a significant reduction in net interest expense and other costs.
Earnings Trend Table
| Date | Estimate EPS | Reported EPS | Surprise % | |
|---|---|---|---|---|
| 0 | 2025-08-22 | 2.23 | 3.54 | 58.74 |
| 1 | 2025-05-09 | 1.97 | 3.00 | 52.28 |
| 2 | 2025-02-07 | 2.14 | 2.28 | 6.54 |
| 3 | 2024-11-08 | 1.63 | 2.14 | 31.29 |
| 4 | 2024-08-23 | 1.73 | 1.74 | 0.58 |
| 5 | 2024-05-10 | 1.56 | 1.28 | -17.95 |
| 6 | 2024-02-09 | 1.64 | 1.38 | -15.75 |
| 7 | 2023-11-03 | 1.90 | 1.47 | -22.63 |
Dividend Payments Table
| Date | Dividend |
|---|---|
| 2025-09-02 | 0.8 |
| 2025-05-19 | 0.6 |
| 2025-02-18 | 0.6 |
| 2024-11-18 | 0.6 |
| 2024-09-03 | 0.6 |
| 2024-05-17 | 0.6 |
| 2024-02-16 | 0.6 |
| 2023-11-10 | 0.6 |

Disclaimer
The content on MarketsFN.com is provided for educational and informational purposes only. It does not constitute financial advice, investment recommendations, or trading guidance. All investments involve risks, and past performance does not guarantee future results. You are solely responsible for your investment decisions and should conduct independent research and consult a qualified financial advisor before acting. MarketsFN.com and its authors are not liable for any losses or damages arising from your use of this information.


