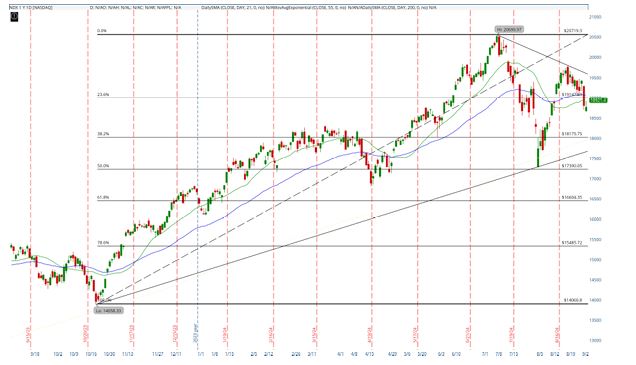
The NASDAQ-100 Index (NDX) reached a record high of 20,690.97 in July 2024 before starting a downward trend. Currently, the index is trading around 18,921.39, after finding support at the 38.2% Fibonacci retracement level, which is approximately 18,175.75. This level has provided some stability following the recent decline. The index is also trading just below the 21-day Simple Moving Average (SMA), which is currently at 19,152.13, suggesting that the short-term trend remains under pressure.
Large Trend
The broader trend for the NASDAQ-100 is still bullish, with the index trading well above the 200-day SMA, which is at 18,101.72. This long-term moving average has been a strong support level throughout the year. The index’s position above the 55-day Exponential Moving Average (EMA), currently at 19,211.73, also indicates that the medium-term trend is still positive, despite the recent pullback. The Fibonacci retracement levels drawn from the October 2022 low of 14,058.33 to the recent high provide key support and resistance levels. The index has recently tested and held above the 38.2% retracement level at 18,175.75, which is a positive sign for the continuation of the broader uptrend.
Supports and Resistances
The NASDAQ-100 index is currently at a critical point, with the 38.2% Fibonacci retracement level at 18,175.75 acting as a strong support. If the index can hold above this level and break back above the 21-day SMA at 19,152.13, it could signal a resumption of the uptrend. The next resistance level would be around 19,500, followed by the recent high of 20,690.97 .
However, if the index fails to hold the 18,175.75 support level, it could lead to a deeper correction. The 50% Fibonacci retracement level at 17,390.05 would be the next major support level, followed by the 200-day SMA at 18,101.72. A break below these levels could signal a shift in the long-term trend from bullish to neutral or bearish.
Traders should closely monitor the index’s behavior around these key levels. A successful defense of the 38.2% retracement level could lead to a recovery, while a break below it could indicate further downside risk in the near term.


