# RUSSELL2000 Technical Analysis Recap
The Russell 2000 Index is a prominent small-cap stock market index representing the bottom two-thirds of the Russell 3000 Index. It tracks approximately 2,000 small-cap U.S. companies, offering a comprehensive overview of that segment of the American economy. The index is widely regarded as a key barometer for the performance of smaller, domestically focused businesses across various industries.
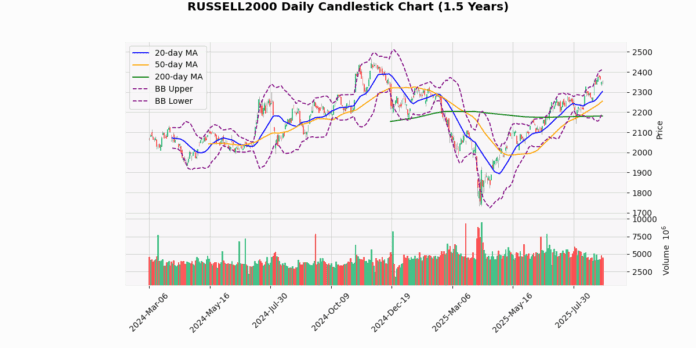
The Russell 2000 index is currently priced at 2349.97, showing a modest decline of 0.1% today. This movement places the index above its 20-day (2303.12), 50-day (2254.93), and 200-day (2181.0) moving averages, indicating a bullish trend over these periods. The index’s price is 2.03%, 4.21%, and 7.75% above the 20, 50, and 200-day moving averages, respectively, reinforcing this positive trajectory.
Analyzing the Bollinger Bands, the index is trading closer to the upper band (2413.02) than the lower band (2193.22), but it has not breached either, suggesting a lack of extreme volatility in the short term. The current price is below the upper band by 2.61%, which may indicate some resistance near this level.
The Relative Strength Index (RSI) at 60.54 does not signal an overbought condition (typically RSI > 70), suggesting there is still room for upward price movement before the index becomes overextended.
The Moving Average Convergence Divergence (MACD) at 35.83 with a signal line at 32.45 shows a positive momentum as the MACD is above its signal line, indicating a bullish signal. This is further supported by the fact that the index is currently trading above its recent 3-day low of 2329.95 but below its 3-day high of 2382.13, suggesting some consolidation within this range.
The index’s current price is significantly above its 52-week low (1732.99) by 35.6% and its Year-To-Date low, showing strong gains over the longer term. However, it remains below the 52-week high (2466.49) and YTD high (2384.01) by -4.72% and -1.43%, respectively, indicating some resistance near these peaks.
The Average True Range (ATR) at 30.6 points to a moderate level of recent daily volatility, which aligns with the current price movements within the Bollinger Bands.
In summary, the Russell 2000 exhibits a bullish trend with potential resistance near the upper Bollinger Band and recent highs. The MACD suggests continued positive momentum, while the RSI indicates the index is not yet overbought, offering potential for further gains unless new resistance levels are tested.
## Technical Metrics
| Metric | Value |
|---|---|
| Current Price | 2349.97 |
| Today’s Change (%) | -0.1 |
| 20-day MA | 2303.12 |
| % from 20-day MA | 2.03 |
| 50-day MA | 2254.93 |
| % from 50-day MA | 4.21 |
| 200-day MA | 2181.00 |
| % from 200-day MA | 7.75 |
| Bollinger Upper | 2413.02 |
| % from BB Upper | -2.61 |
| Bollinger Lower | 2193.22 |
| % from BB Lower | 7.15 |
| RSI (14) | 60.54 |
| MACD | 35.83 |
| MACD Signal | 32.45 |
| 3-day High | 2382.13 |
| % from 3-day High | -1.35 |
| 3-day Low | 2329.95 |
| % from 3-day Low | 0.86 |
| 52-week High | 2466.49 |
| % from 52-week High | -4.72 |
| 52-week Low | 1732.99 |
| % from 52-week Low | 35.6 |
| YTD High | 2384.01 |
| % from YTD High | -1.43 |
| YTD Low | 1732.99 |
| % from YTD Low | 35.6 |
| ATR (14) | 30.6 |
The technical outlook for the Russell 2000 index suggests a moderately bullish sentiment as it trades above all key moving averages (20-day, 50-day, and 200-day), indicating sustained upward momentum over short, medium, and long-term periods. The index’s current price of 2349.97 is positioned above the middle Bollinger Band but below the upper band, suggesting that while the market is not in an overbought territory, it is nearing the higher end of its recent price range.
The Relative Strength Index (RSI) at 60.54 points towards a moderately bullish momentum without entering the overbought zone (above 70). Additionally, the MACD value of 35.83 above its signal line at 32.45 supports the presence of bullish momentum. However, the proximity of the MACD to its signal line indicates that while the upward trend is intact, it might not be exceedingly strong.
The Average True Range (ATR) of 30.6 reflects moderate volatility, consistent with the typical movement range expected in the index. Potential resistance can be anticipated near the recent 3-day high of 2382.13 and the upper Bollinger Band at 2413.02. Support might be found near the 20-day moving average of 2303.12 and further at the lower Bollinger Band at 2193.22.
Overall, the Russell 2000’s technical indicators suggest a continuation of the current uptrend, but traders should watch for fluctuations in volatility and potential resistance challenges near recent highs.


