# DJIA Technical Analysis Recap
The Dow Jones Industrial Average (DJIA), also known as the Dow 30, is a stock market index that measures the stock performance of 30 prominent companies listed on stock exchanges in the United States. Established in 1896, it is one of the oldest and most widely recognized indexes, often used as a barometer for the overall health of the U.S. stock market and economy.
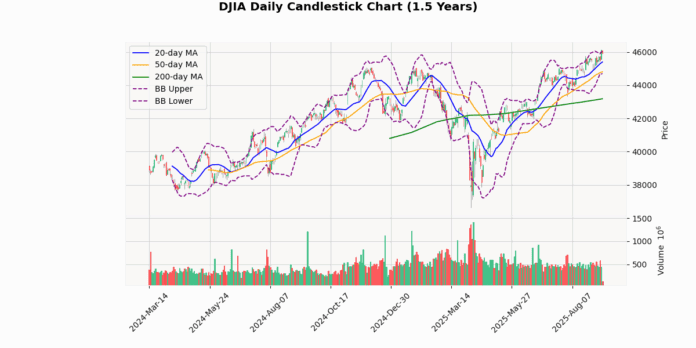
The DJIA currently stands at 45,926.79, marking a slight decline of 0.39% today. This movement places the index just below its upper Bollinger Band (46,090.33) and above all its moving averages (20-day at 45,396.22, 50-day at 44,808.36, and 200-day at 43,178.5), indicating a generally bullish trend over the short to medium term. The index’s position relative to its moving averages, with a 1.17% increase over the 20-day MA and a 6.36% increase over the 200-day MA, reinforces this bullish sentiment.
The Bollinger Bands show a relatively narrow range between the upper and lower bands (46,090.33 and 44,702.12, respectively), suggesting moderate volatility. The proximity of the current price to the upper band also suggests that the index is nearing a potentially overbought territory, although it has not breached this band.
The RSI at 61.7 does not yet indicate overbought conditions (typically above 70), but it is approaching that threshold, suggesting caution among buyers. The MACD at 339.3, above its signal line at 320.49, confirms the ongoing bullish momentum, as evidenced by the positive crossover.
The index’s recent performance, reaching a 3-day high of 46,137.2 and maintaining levels close to this peak, underscores its strong upward momentum. However, the slight decline from this peak suggests some resistance near the 52-week and YTD highs, which are both set at 46,137.2.
The ATR (Average True Range) of 392.18 points to a moderate level of intraday volatility, aligning with the movements within the Bollinger Bands.
In summary, the DJIA exhibits a strong bullish trend with caution advised as it approaches overbought conditions. The proximity to the upper Bollinger Band and the high RSI value suggest that while the upward momentum is strong, a consolidation or mild pullback might occur as the index navigates near its recent highs. Investors should watch for any potential MACD bearish crossovers or RSI movements above 70 as signals for a possible shift in momentum.
## Technical Chart

## Technical Metrics
| Metric | Value |
|---|---|
| Current Price | 45926.8 |
| Today’s Change (%) | -0.39 |
| 20-day MA | 45396.2 |
| % from 20-day MA | 1.17 |
| 50-day MA | 44808.4 |
| % from 50-day MA | 2.5 |
| 200-day MA | 43178.5 |
| % from 200-day MA | 6.36 |
| Bollinger Upper | 46090.3 |
| % from BB Upper | -0.35 |
| Bollinger Lower | 44702.1 |
| % from BB Lower | 2.74 |
| RSI (14) | 61.7 |
| MACD | 339.3 |
| MACD Signal | 320.49 |
| 3-day High | 46137.2 |
| % from 3-day High | -0.46 |
| 3-day Low | 45380.1 |
| % from 3-day Low | 1.2 |
| 52-week High | 46137.2 |
| % from 52-week High | -0.46 |
| 52-week Low | 36611.8 |
| % from 52-week Low | 25.44 |
| YTD High | 46137.2 |
| % from YTD High | -0.46 |
| YTD Low | 36611.8 |
| % from YTD Low | 25.44 |
| ATR (14) | 392.18 |
The technical outlook for the DJIA indicates a generally bullish sentiment as the index is currently trading above its key moving averages (20-day, 50-day, and 200-day), suggesting a strong upward trend over the short, medium, and long term. The index’s current price is slightly below the upper Bollinger Band and has recently approached its 52-week and year-to-date highs, indicating some resistance around these levels. The proximity to the upper Bollinger Band also suggests that the market might be nearing overbought territory, although the RSI at 61.7 does not yet confirm an extreme overbought condition.
MACD values above the signal line further support the bullish momentum, although investors should watch for potential reversals if the MACD diverges negatively. The Average True Range (ATR) suggests moderate volatility, which is consistent with the recent price movements within a defined range.
Immediate support and resistance levels can be identified around the lower Bollinger Band at 44702.12 and the recent high at 46137.2, respectively. A break beyond these levels could indicate a stronger directional move. Overall, market sentiment appears positive, but caution is warranted near resistance levels and potential overbought conditions.


