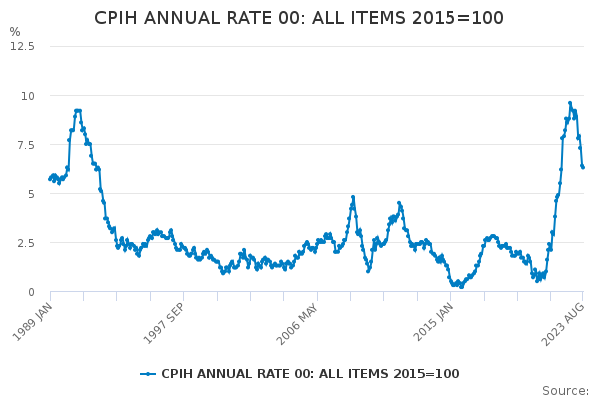
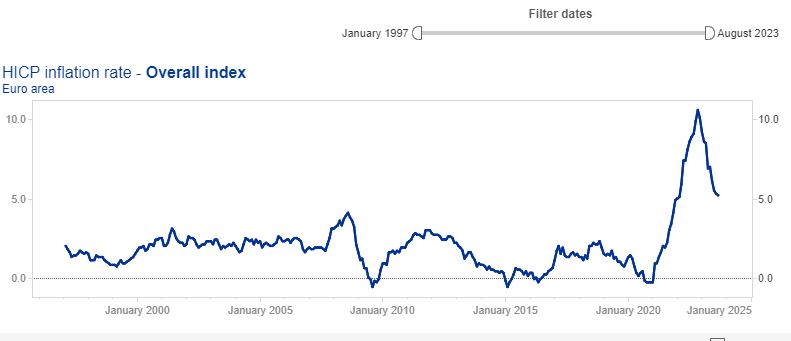
The pair spent half year in a downtrend, where the British pound rose thanks to an hawkish Bank of England. Inflation rate rose above the level reached on 1990. With inflation rate near 10% there was only one option available: hiking rates and avoid a structural higher inflation expectation.

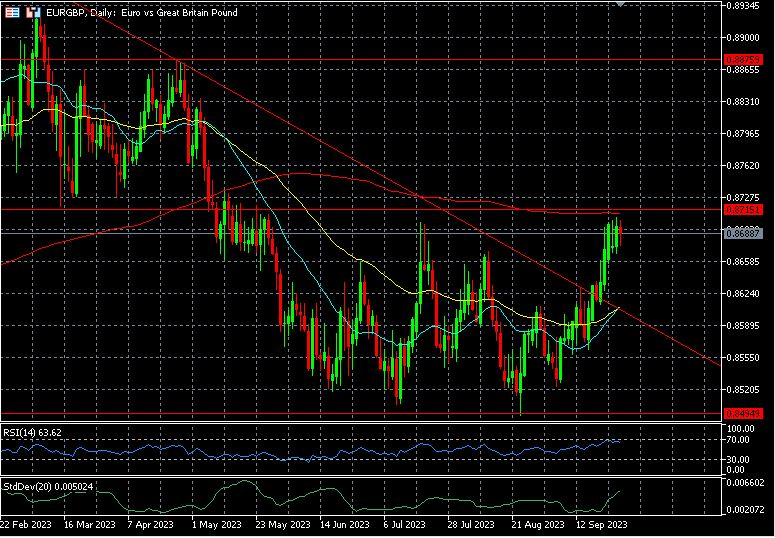
During the summer however inflation peaked in UK, leaving the BoE with a more pragmatic approach. 12 months inflation rate was at 6.3% on August, while inflation has peaked in Eurozone as well, but a combination of both technical and fundamental factors made difficult for EUR/GBP to drop below 0.8450, its 2023 low.

At the moment the rate is testing its 200 day SMA after the recent breakout of the supply line linking lower highs. A breakout of area 0.8725 is likely to create selling pressure on GBP with next key resistance at 0.89 and then 0.9230 where price spikes are possible in this area.

If the pair would retrace beneath the dynamic resistance (which now is a support) where there are also the 21 day SMA and 55 day EMA as a dynamic supports, a bearish leg is likely to materialize, with test at 0.8450 and then 0.8330.


