## Forex and Global News
In today’s forex market, the U.S. dollar (USD) remains in focus as geopolitical tensions and economic developments shape investor sentiment. The anticipation of a potential meeting between President Trump and Chinese leader Xi Jinping next year has introduced cautious optimism, which may influence the USD against major currencies. Meanwhile, European stocks are poised to rise following strong performances in U.S. equities, particularly after Nvidia’s announcement of a significant investment in OpenAI, which has bolstered market confidence.
The euro (EUR) and British pound (GBP) are under pressure amid concerns over domestic policies, including France’s renewed push for a wealth tax, which could affect economic stability in the Eurozone. Additionally, drone incursions causing airport disruptions in Copenhagen and Oslo have raised concerns about regional security, impacting market sentiment.
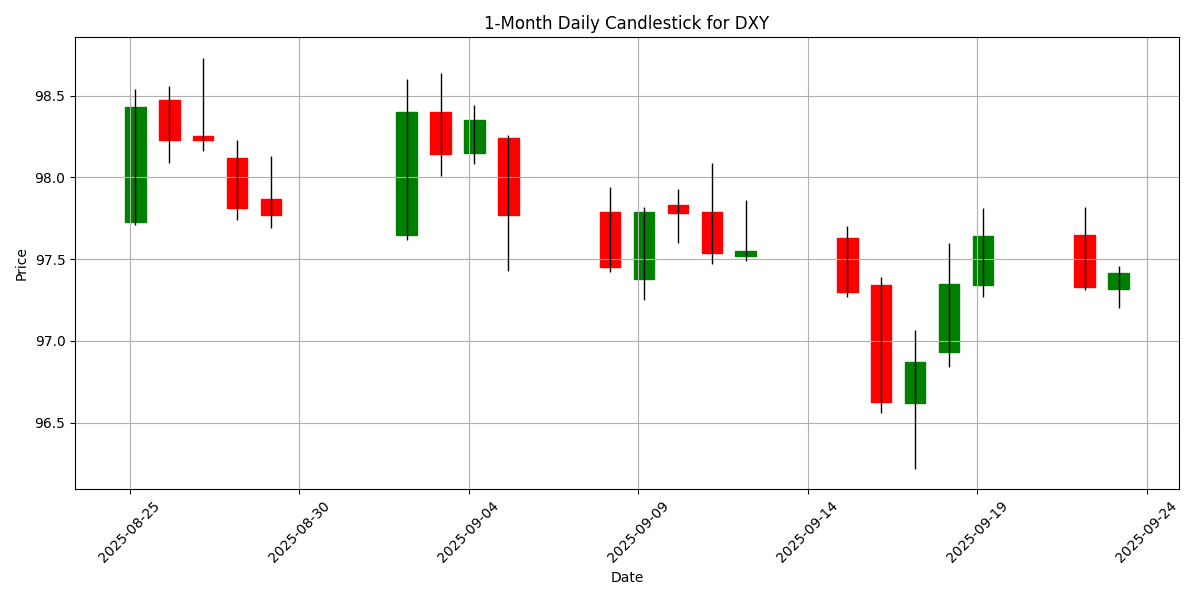
As of now, the DXY is trading at 97.42, reflecting a daily change of 0.1182%. Overall, the forex market is navigating through a complex web of geopolitical events and economic indicators, leading to a cautious but optimistic outlook for the USD.
## Economic Calendar Events Today
All times are in US Eastern Time (New York).
| Date | Time | Cur | Imp | Event | Actual | Forecast |
|---|---|---|---|---|---|---|
| 2025-09-23 | 01:00 | Medium | Core CPI (YoY) (Aug) | 0.30% | 0.40% | |
| 2025-09-23 | 01:00 | Medium | CPI (YoY) (Aug) | 0.5% | 0.6% | |
| 2025-09-23 | 03:15 | 🇪🇺 | Medium | HCOB France Manufacturing PMI (Sep) | 48.1 | 50.2 |
| 2025-09-23 | 03:15 | 🇪🇺 | Medium | HCOB France Services PMI (Sep) | 48.9 | 49.7 |
| 2025-09-23 | 03:30 | 🇸🇪 | Medium | Interest Rate Decision | 1.75% | 2.00% |
| 2025-09-23 | 03:30 | 🇪🇺 | Medium | HCOB Germany Manufacturing PMI (Sep) | 48.5 | 50.0 |
| 2025-09-23 | 03:30 | 🇪🇺 | Medium | HCOB Germany Services PMI (Sep) | 52.5 | 49.5 |
| 2025-09-23 | 04:00 | 🇪🇺 | Medium | HCOB Eurozone Manufacturing PMI (Sep) | 50.7 | |
| 2025-09-23 | 04:00 | 🇪🇺 | Medium | HCOB Eurozone Composite PMI (Sep) | 51.1 | |
| 2025-09-23 | 04:00 | 🇪🇺 | Medium | HCOB Eurozone Services PMI (Sep) | 50.6 | |
| 2025-09-23 | 04:30 | 🇬🇧 | Medium | S&P Global Composite PMI (Sep) | 52.7 | |
| 2025-09-23 | 04:30 | 🇬🇧 | Medium | S&P Global Manufacturing PMI (Sep) | 47.1 | |
| 2025-09-23 | 04:30 | 🇬🇧 | Medium | S&P Global Services PMI (Sep) | 53.4 | |
| 2025-09-23 | 05:00 | 🇬🇧 | Medium | BoE MPC Member Pill Speaks | ||
| 2025-09-23 | 08:30 | 🇺🇸 | Medium | Current Account (Q2) | -259.0B | |
| 2025-09-23 | 08:30 | 🇨🇦 | Medium | New Housing Price Index (MoM) (Aug) | 0.0% | |
| 2025-09-23 | 09:00 | 🇺🇸 | Medium | FOMC Member Bowman Speaks | ||
| 2025-09-23 | 09:45 | 🇺🇸 | High | S&P Global Manufacturing PMI (Sep) | 52.2 | |
| 2025-09-23 | 09:45 | 🇺🇸 | Medium | S&P Global Composite PMI (Sep) | 54.6 | |
| 2025-09-23 | 09:45 | 🇺🇸 | High | S&P Global Services PMI (Sep) | 54.0 | |
| 2025-09-23 | 09:50 | 🇺🇸 | High | U.S. President Trump Speaks | ||
| 2025-09-23 | 10:00 | 🇺🇸 | Medium | FOMC Member Bostic Speaks | ||
| 2025-09-23 | 12:35 | 🇺🇸 | High | Fed Chair Powell Speaks | ||
| 2025-09-23 | 13:00 | 🇺🇸 | Medium | 2-Year Note Auction | ||
| 2025-09-23 | 14:15 | 🇨🇦 | Medium | BoC Gov Macklem Speaks | ||
| 2025-09-23 | 16:30 | 🇺🇸 | Medium | API Weekly Crude Oil Stock | ||
| 2025-09-23 | 18:00 | 🇪🇺 | Medium | German Buba Mauderer Speaks | ||
| 2025-09-23 | 19:20 | 🇺🇸 | High | U.S. President Trump Speaks | ||
| 2025-09-23 | 20:30 | 🇯🇵 | Medium | au Jibun Bank Services PMI (Sep) |
On September 23, 2025, key economic indicators are set to influence FX markets significantly. Early in the day, Singapore’s Core CPI and CPI for August fell short of forecasts, with actuals at 0.30% and 0.50%, respectively, compared to expectations of 0.40% and 0.60%. This lower inflation data may exert downward pressure on the Singapore Dollar (SGD) as it suggests a weakening economic environment.
In the Eurozone, the HCOB France Manufacturing and Services PMIs both disappointed, recording 48.1 and 48.9 against forecasts of 50.2 and 49.7, respectively. Similarly, Germany’s Manufacturing PMI at 48.5, below the 50.0 forecast, further highlights economic contraction risks, likely leading to bearish sentiment for the Euro (EUR).
Conversely, Germany’s Services PMI exceeded expectations at 52.5, which could mitigate some negative sentiment. The Eurozone Composite PMI results, due later, will be pivotal for EUR movements.
In the U.S., the S&P Global Manufacturing PMI is anticipated at 52.2, and the Composite PMI at 54.6, both suggesting resilience. These figures could bolster the U.S. Dollar (USD) if they align with or exceed expectations, especially amid upcoming speeches from key Federal Reserve members.
## Major FX Group
| Name | Symbol | Price | Daily (%) | 5D (%) | 1W (%) | 1M (%) | 3M (%) | 6M (%) | YTD (%) | 12M (%) | MA50 | MA100 | MA200 | RSI | MACD |
|---|---|---|---|---|---|---|---|---|---|---|---|---|---|---|---|
| EUR/USD – Euro / U.S. Dollar | EURUSD | 1.1799 | -0.0508 | -0.2312 | 0.2998 | 1.6012 | 1.6083 | 9.8393 | 13.38 | 5.7179 | 1.1674 | 1.1575 | 1.1125 | 63.88 | 0.0037 |
| USD/JPY – U.S. Dollar / Japanese Yen | USDJPY | 147.76 | 0.0487 | 0.5950 | 0.2442 | -0.4185 | 1.9371 | -1.7997 | -5.8792 | 2.6117 | 147.68 | 146.22 | 148.70 | 57.21 | 0.0126 |
| GBP/USD – British Pound / U.S. Dollar | GBPUSD | 1.3513 | -0.0222 | -0.8565 | -0.6592 | 0.6975 | -0.7484 | 4.9338 | 7.6810 | 1.4948 | 1.3469 | 1.3485 | 1.3106 | 60.47 | 0.0021 |
| USD/CHF – U.S. Dollar / Swiss Franc | USDCHF | 0.7925 | 0.0379 | 0.5277 | -0.2718 | -1.9996 | -1.5711 | -10.3669 | -12.2603 | -6.8633 | 0.8016 | 0.8088 | 0.8463 | 37.06 | -0.0032 |
| AUD/USD – Australian Dollar / U.S. Dollar | AUDUSD | 0.6590 | -0.1818 | -0.9395 | -1.2438 | 2.5602 | 1.4471 | 4.8192 | 5.9486 | -3.2305 | 0.6538 | 0.6514 | 0.6398 | 59.39 | 0.0030 |
| USD/CAD – U.S. Dollar / Canadian Dollar | USDCAD | 1.3839 | 0.1157 | 0.5018 | 0.4719 | -0.4417 | 0.8188 | -3.1899 | -3.5596 | 2.0259 | 1.3774 | 1.3759 | 1.4012 | 54.48 | 0.0001 |
| NZD/USD – New Zealand Dollar / U.S. Dollar | NZDUSD | 0.5850 | -0.3577 | -1.4187 | -1.9955 | 0.4755 | -2.6835 | 2.2908 | 3.7287 | -6.1929 | 0.5924 | 0.5961 | 0.5838 | 48.55 | -0.0006 |
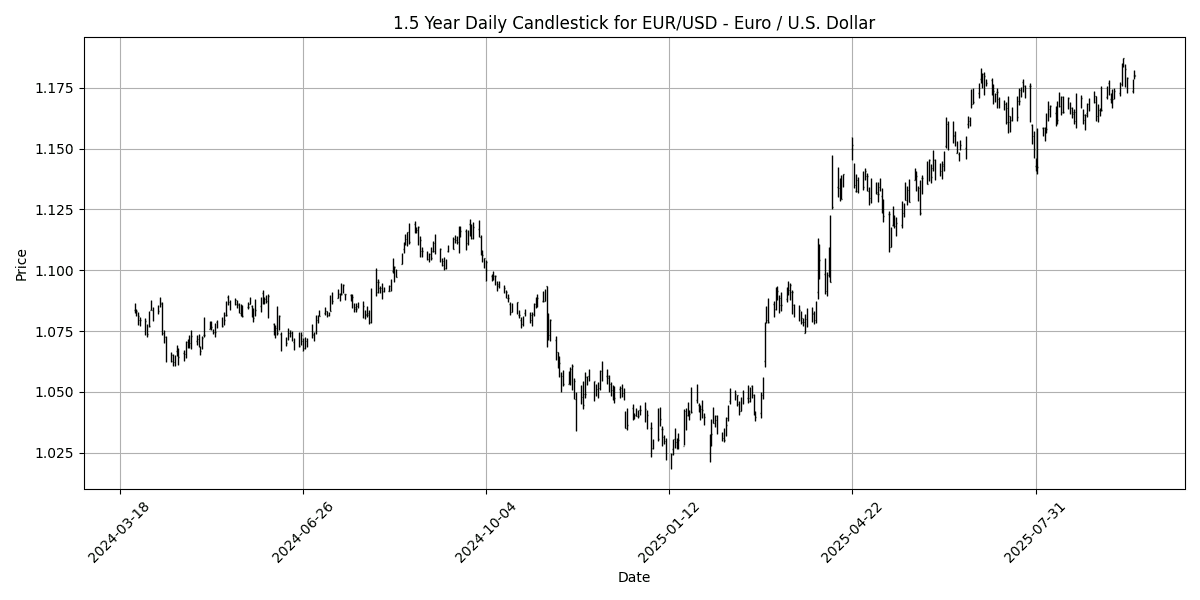
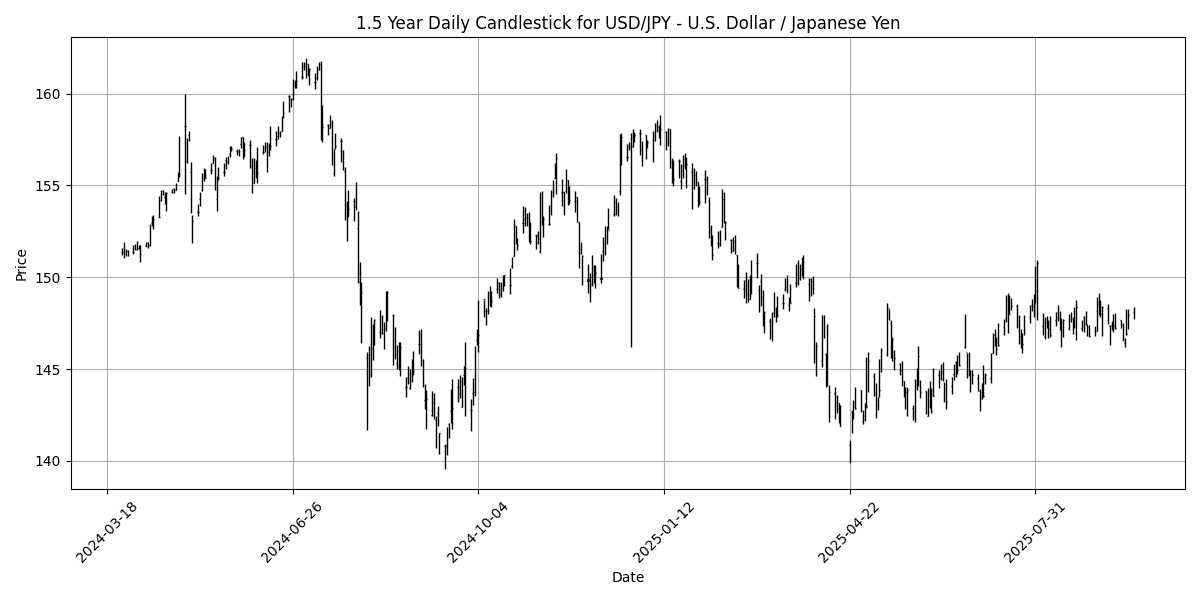
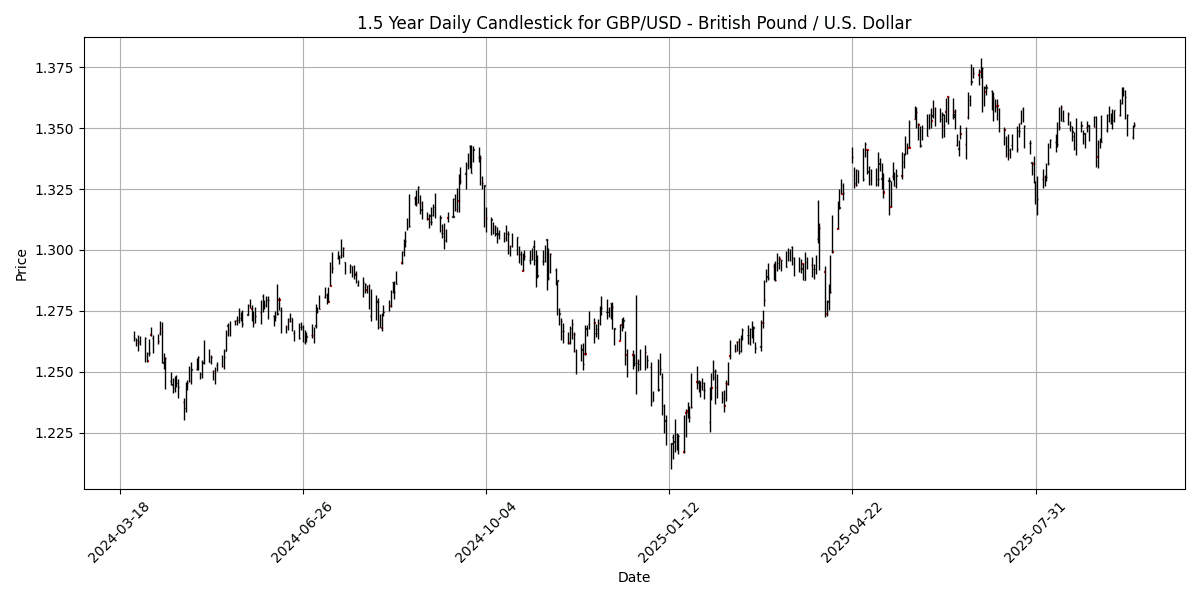
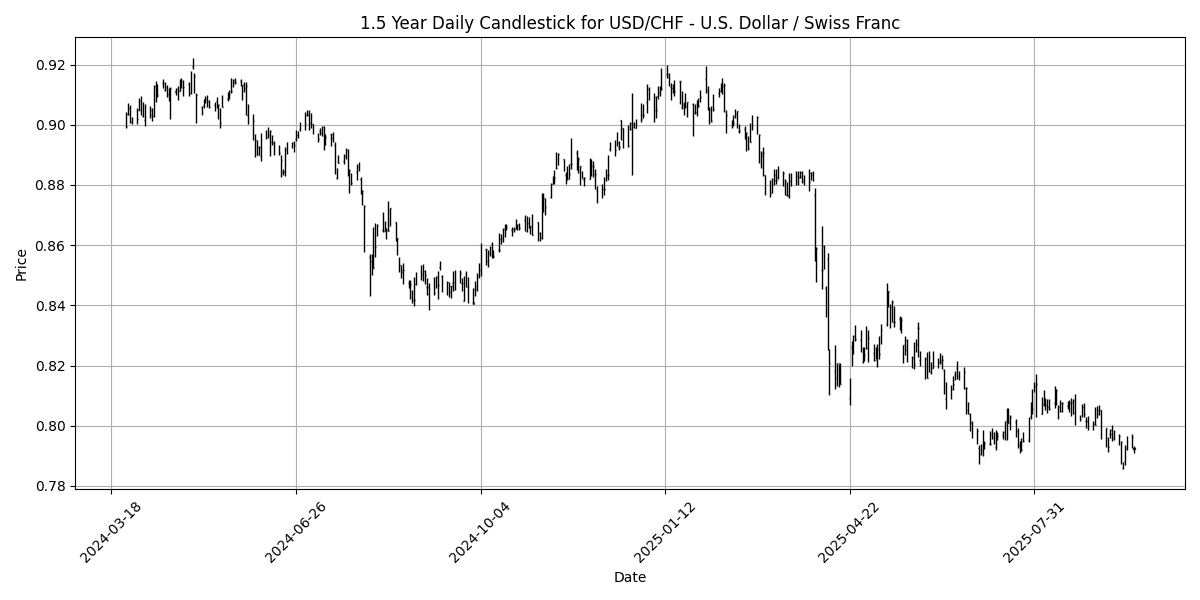
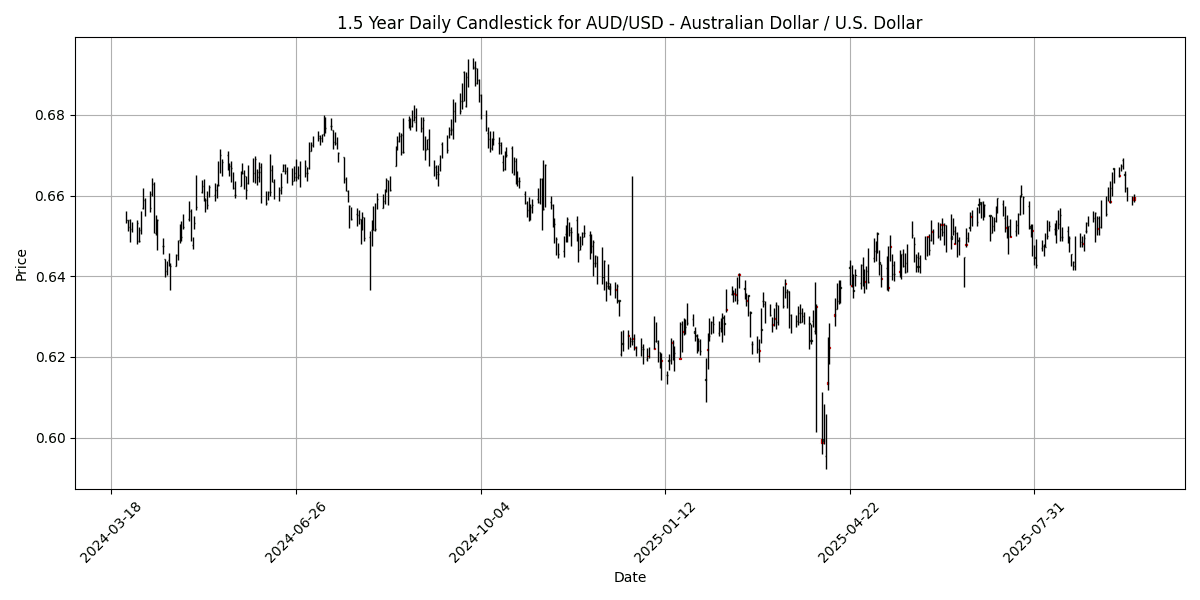
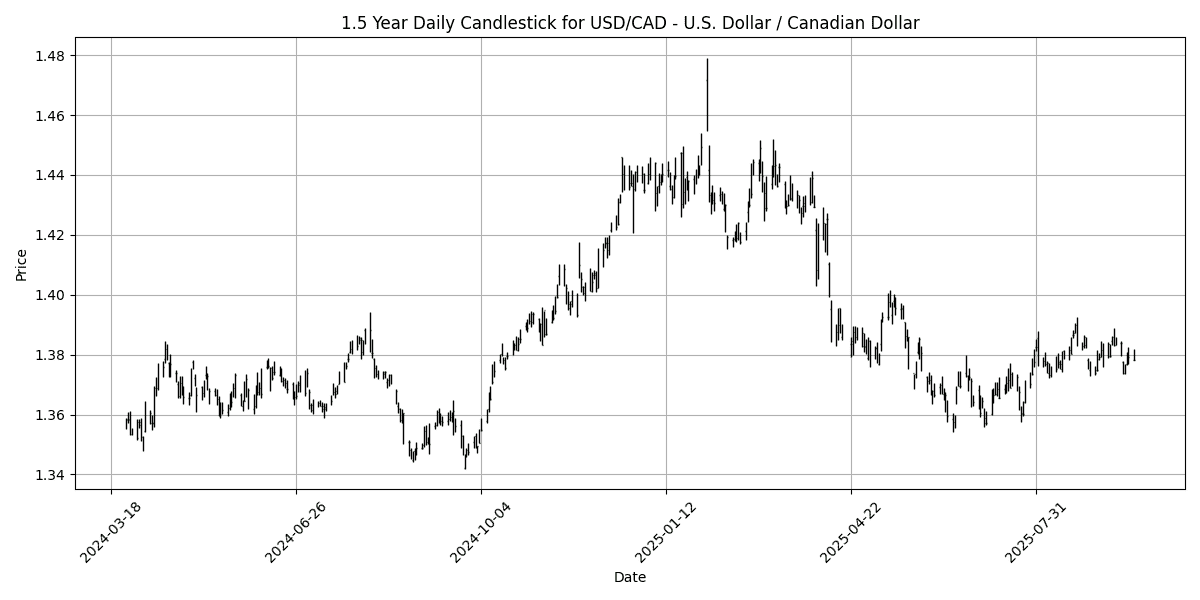
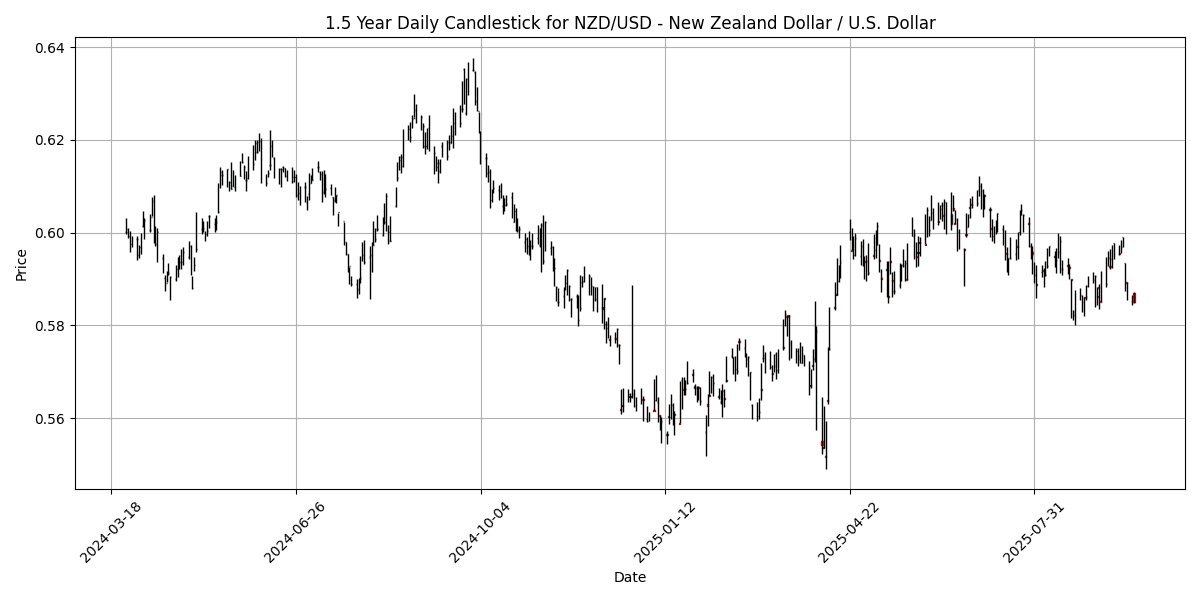
Analyzing the current market conditions for key FX pairs reveals significant insights into overbought and oversold scenarios. The EUR/USD pair, with an RSI of 63.88, remains below the overbought threshold, indicating potential for upward momentum, supported by a positive MACD of 0.0037. Similarly, the GBP/USD and AUD/USD pairs display healthy RSI levels (60.47 and 59.39, respectively) and positive MACD figures, suggesting bullish sentiment.
Conversely, the USD/CHF pair is notably oversold, with an RSI of 37.06 and a negative MACD of -0.0032, indicating bearish pressure and potential for a corrective rebound. The NZD/USD, with its RSI at 48.55 and a slightly negative MACD, also suggests a lack of strong momentum. Overall, while several pairs exhibit bullish tendencies, the USD/CHF stands out as a candidate for potential recovery due to its oversold condition, warranting close
## Cross FX Group
| Name | Symbol | Price | Daily (%) | 5D (%) | 1W (%) | 1M (%) | 3M (%) | 6M (%) | YTD (%) | 12M (%) | MA50 | MA100 | MA200 | RSI | MACD |
|---|---|---|---|---|---|---|---|---|---|---|---|---|---|---|---|
| EUR/GBP | EURGBP | 0.8728 | -0.0458 | 0.5970 | 0.9297 | 0.8551 | 2.3380 | 4.6397 | 5.2593 | 4.1254 | 0.8666 | 0.8580 | 0.8481 | 64.56 | 0.0011 |
| EUR/JPY | EURJPY | 174.29 | -0.0006 | 0.3350 | 0.5156 | 1.1462 | 3.5603 | 7.8394 | 6.6738 | 8.4493 | 172.35 | 169.18 | 165.13 | 62.26 | 0.5471 |
| EUR/CHF | EURCHF | 0.9347 | -0.0214 | 0.2660 | -0.0021 | -0.4622 | -0.0235 | -1.5815 | -0.5532 | -1.5629 | 0.9356 | 0.9358 | 0.9391 | 43.04 | -0.0008 |
| EUR/AUD | EURAUD | 1.7900 | 0.1007 | 0.7021 | 1.5453 | -0.9523 | 0.1147 | 4.7709 | 6.9806 | 9.2283 | 1.7856 | 1.7768 | 1.7378 | 53.98 | -0.0025 |
| GBP/JPY | GBPJPY | 199.69 | 0.0511 | -0.2537 | -0.4025 | 0.3039 | 1.1908 | 3.0599 | 1.3675 | 4.1606 | 198.89 | 197.22 | 194.68 | 57.30 | 0.3519 |
| GBP/CHF | GBPCHF | 1.0709 | 0.0374 | -0.3267 | -0.9187 | -1.2986 | -2.3035 | -5.9409 | -5.5102 | -5.4577 | 1.0795 | 1.0905 | 1.1072 | 40.12 | -0.0027 |
| AUD/JPY | AUDJPY | 97.36 | -0.1067 | -0.3664 | -1.0197 | 2.1188 | 3.4293 | 2.9274 | -0.2725 | -0.7172 | 96.52 | 95.22 | 95.07 | 65.78 | 0.5147 |
| AUD/NZD | AUDNZD | 1.1264 | 0.2046 | 0.4790 | 0.7585 | 2.0724 | 4.2654 | 2.4721 | 2.1497 | 3.1568 | 1.1028 | 1.0924 | 1.0959 | 78.39 | 0.0058 |
| CHF/JPY | CHFJPY | 186.45 | 0.0268 | 0.0790 | 0.5224 | 1.6146 | 3.5811 | 9.5684 | 7.2792 | 10.17 | 184.20 | 180.76 | 175.84 | 65.27 | 0.7604 |
| NZD/JPY | NZDJPY | 86.42 | -0.2907 | -0.8319 | -1.7619 | 0.0544 | -0.7955 | 0.4778 | -2.3756 | -3.7628 | 87.47 | 87.15 | 86.73 | 41.34 | -0.0633 |
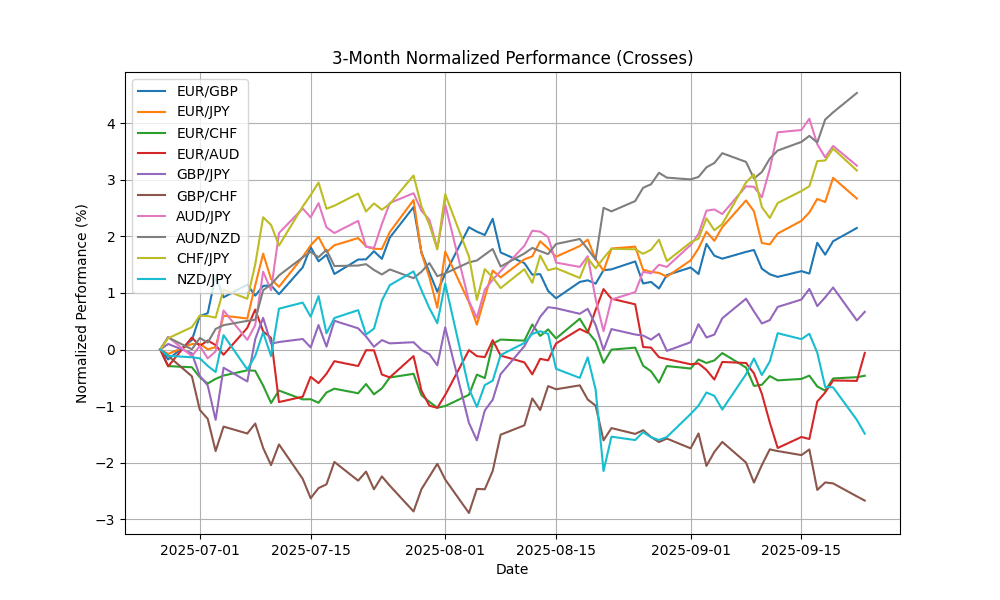
Current analysis of the selected FX pairs indicates a mixed sentiment regarding overbought and oversold conditions. Notably, AUD/NZD is in overbought territory with an RSI of 78.39, suggesting potential price corrections. Conversely, EUR/CHF and GBP/CHF are exhibiting oversold conditions, with RSIs of 43.04 and 40.12 respectively, indicating possible buying opportunities. The MACD readings for most pairs, particularly CHF/JPY and AUD/JPY, remain positive, reinforcing bullish momentum. However, the lack of significant MA crossover signals suggests caution in trend reversals. Traders should closely monitor these dynamics for potential entry or exit points in their strategies.
## Exotics and Emerging
| Name | Symbol | Price | Daily (%) | 5D (%) | 1W (%) | 1M (%) | 3M (%) | 6M (%) | YTD (%) | 12M (%) | MA50 | MA100 | MA200 | RSI | MACD |
|---|---|---|---|---|---|---|---|---|---|---|---|---|---|---|---|
| USD/TRY – U.S. Dollar / Turkish Lira | USDTRY | 41.34 | 0.0191 | 0.1014 | 0.0855 | 0.8179 | 4.3370 | 8.7341 | 17.10 | 21.40 | 40.89 | 40.13 | 38.35 | 79.93 | 0.1528 |
| USD/ZAR – U.S. Dollar / South African Rand | USDZAR | 17.36 | 0.1396 | -0.0955 | -0.0097 | -1.9466 | -2.0467 | -4.9848 | -7.4927 | -0.1826 | 17.65 | 17.77 | 18.13 | 33.20 | -0.0964 |
| USD/THB – U.S. Dollar / Thai Baht | USDTHB | 31.80 | 0.1575 | 0.0629 | -0.0629 | -2.6332 | -2.5437 | -6.4981 | -6.8514 | -3.5194 | 32.25 | 32.47 | 33.20 | 31.11 | -0.1574 |
| USD/SEK – U.S. Dollar / Swedish Krona | USDSEK | 9.3652 | 0.2473 | 0.8786 | 0.9330 | -2.5791 | -1.5039 | -7.0036 | -15.0459 | -7.8637 | 9.5242 | 9.5546 | 10.04 | 52.58 | -0.0603 |
| USD/NOK – U.S. Dollar / Norwegian Krone | USDNOK | 9.9181 | 0.0686 | 1.1180 | 0.9898 | -2.5325 | -1.9352 | -6.1985 | -12.4432 | -5.2966 | 10.10 | 10.12 | 10.55 | 39.12 | -0.0731 |
| USD/DKK – U.S. Dollar / Danish Krone | USDDKK | 6.3275 | 0.0411 | 0.2441 | -0.2799 | -1.5573 | -1.5039 | -8.8893 | -11.7109 | -5.3193 | 6.3941 | 6.4481 | 6.7229 | 36.05 | -0.0200 |
| USD/MXN – U.S. Dollar / Mexican Peso | USDMXN | 18.36 | 0.0229 | 0.2687 | -0.0246 | -2.0244 | -3.3423 | -9.3797 | -11.0274 | -5.2618 | 18.64 | 18.87 | 19.58 | 22.67 | -0.0947 |
| USD/PLN – U.S. Dollar / Polish Zloty | USDPLN | 3.6086 | 0.1026 | 0.3219 | -0.0363 | -1.4259 | -1.4286 | -7.3290 | -12.1369 | -5.6395 | 3.6463 | 3.6777 | 3.8197 | 48.81 | -0.0111 |
| USD/HUF – U.S. Dollar / Hungarian Forint | USDHUF | 329.95 | 0.2056 | 0.1305 | -0.3260 | -3.2972 | -4.4830 | -11.4302 | -16.4700 | -6.2642 | 338.60 | 344.44 | 362.46 | 27.78 | -2.6123 |
| USD/CZK – U.S. Dollar / Czech Koruna | USDCZK | 20.56 | 0.2032 | 0.0336 | -0.5009 | -2.8010 | -3.5171 | -11.2184 | -14.8888 | -8.3688 | 20.97 | 21.30 | 22.41 | 44.08 | -0.1143 |
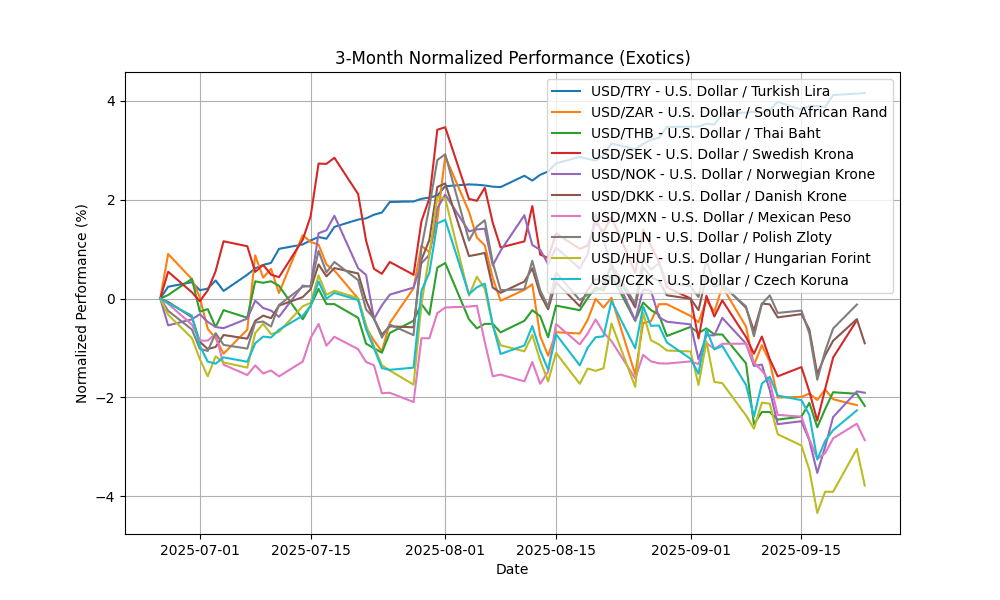
The current analysis of key FX pairs reveals significant overbought and oversold conditions. Notably, USD/TRY exhibits an overbought RSI of 79.93, supported by a positive MACD of 0.1528, suggesting potential for a corrective pullback. In contrast, USD/ZAR and USD/THB are oversold, with RSIs of 33.20 and 31.11, respectively, and negative MACDs, indicating bearish momentum. This trend is echoed across other pairs like USD/MXN and USD/HUF, which show extreme oversold conditions with RSIs of 22.67 and 27.78. Traders should monitor these indicators closely for potential reversals or continuation of trends in these markets.


