## Forex and Global News
In a day marked by significant geopolitical and economic developments, the forex market reacted cautiously. President Trump’s approval of a TikTok deal and the imposition of 100% tariffs on branded drugs unless companies establish U.S. manufacturing plants are expected to influence market dynamics, particularly for the USD. The tariffs are part of a broader strategy to bolster American manufacturing, which could strengthen the dollar in the long term.
Market sentiment remains mixed as investors await the release of the August personal consumption expenditures price index, a key inflation indicator that could sway the Federal Reserve’s monetary policy. Meanwhile, the Chinese Premier’s call for stable U.S.-China relations during his New York visit adds a layer of complexity to the USD’s performance against the JPY and EUR.
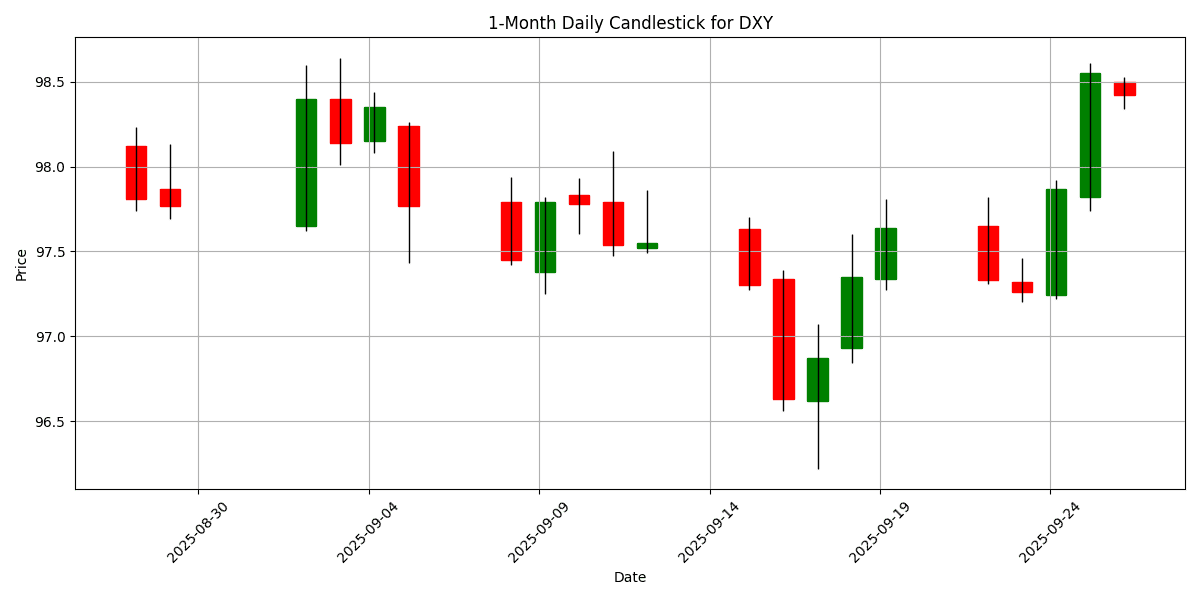
The DXY, a measure of the dollar’s strength, is currently at 98.42, reflecting a daily change of 0.0457%. As geopolitical tensions and economic policies unfold, traders remain vigilant for further developments that could impact major currencies and commodities.
## Economic Calendar Events Today
All times are in US Eastern Time (New York).
| Date | Time | Cur | Imp | Event | Actual | Forecast |
|---|---|---|---|---|---|---|
| 2025-09-26 | 01:30 | 🇯🇵 | Medium | BoJ Board Member Noguchi Speaks | ||
| 2025-09-26 | 03:00 | 🇪🇺 | Medium | Spanish GDP (QoQ) (Q2) | 0.8% | 0.7% |
| 2025-09-26 | 05:30 | 🇪🇺 | Medium | Italian 10-Year BTP Auction | ||
| 2025-09-26 | 05:30 | 🇪🇺 | Medium | ECB President Lagarde Speaks | ||
| 2025-09-26 | 06:00 | 🇪🇺 | Medium | France Jobseekers Total (Aug) | ||
| 2025-09-26 | 08:30 | 🇺🇸 | High | Core PCE Price Index (MoM) (Aug) | 0.2% | |
| 2025-09-26 | 08:30 | 🇺🇸 | High | Core PCE Price Index (YoY) (Aug) | 2.9% | |
| 2025-09-26 | 08:30 | 🇺🇸 | Medium | PCE Price index (YoY) (Aug) | 2.7% | |
| 2025-09-26 | 08:30 | 🇺🇸 | Medium | PCE price index (MoM) (Aug) | 0.3% | |
| 2025-09-26 | 08:30 | 🇺🇸 | Medium | Personal Spending (MoM) (Aug) | 0.5% | |
| 2025-09-26 | 08:30 | 🇨🇦 | Medium | GDP (MoM) (Jul) | 0.1% | |
| 2025-09-26 | 08:30 | 🇨🇦 | Medium | Wholesale Sales (MoM) (Aug) | ||
| 2025-09-26 | 08:31 | 🇨🇦 | Medium | GDP (MoM) (Aug) | ||
| 2025-09-26 | 10:00 | 🇺🇸 | Medium | Michigan 1-Year Inflation Expectations (Sep) | 4.8% | |
| 2025-09-26 | 10:00 | 🇺🇸 | Medium | Michigan 5-Year Inflation Expectations (Sep) | 3.9% | |
| 2025-09-26 | 10:00 | 🇺🇸 | Medium | Michigan Consumer Expectations (Sep) | 51.8 | |
| 2025-09-26 | 10:00 | 🇺🇸 | Medium | Michigan Consumer Sentiment (Sep) | 55.4 | |
| 2025-09-26 | 11:30 | 🇺🇸 | Medium | Atlanta Fed GDPNow (Q3) | 3.3% | |
| 2025-09-26 | 13:00 | 🇺🇸 | Medium | U.S. Baker Hughes Oil Rig Count | ||
| 2025-09-26 | 13:00 | 🇺🇸 | Medium | FOMC Member Bowman Speaks | ||
| 2025-09-26 | 13:00 | 🇺🇸 | Medium | U.S. Baker Hughes Total Rig Count | ||
| 2025-09-26 | 15:30 | 🇬🇧 | Medium | CFTC GBP speculative net positions | ||
| 2025-09-26 | 15:30 | 🇺🇸 | Medium | CFTC Crude Oil speculative net positions | ||
| 2025-09-26 | 15:30 | 🇺🇸 | Medium | CFTC Gold speculative net positions | ||
| 2025-09-26 | 15:30 | 🇺🇸 | Medium | CFTC Nasdaq 100 speculative net positions | ||
| 2025-09-26 | 15:30 | 🇺🇸 | Medium | CFTC S&P 500 speculative net positions | ||
| 2025-09-26 | 15:30 | 🇦🇺 | Medium | CFTC AUD speculative net positions | ||
| 2025-09-26 | 15:30 | 🇧🇷 | Medium | CFTC BRL speculative net positions | ||
| 2025-09-26 | 15:30 | 🇯🇵 | Medium | CFTC JPY speculative net positions | ||
| 2025-09-26 | 15:30 | 🇪🇺 | Medium | CFTC EUR speculative net positions | ||
| 2025-09-26 | 18:00 | 🇺🇸 | Medium | FOMC Member Bostic Speaks |
On September 26, 2025, several key economic events are expected to influence the foreign exchange (FX) markets. Notably, the **Core PCE Price Index** and **PCE Price Index** data, scheduled for release at **8:30 AM ET**, are critical indicators of inflation in the U.S. The forecasts are set at **0.2%** (MoM) and **2.7%** (YoY), with any deviation likely impacting the USD. A higher-than-expected reading could bolster the dollar as it may signal continued Federal Reserve tightening.
The **Michigan Consumer Sentiment** index, also released at **10:00 AM ET**, is projected at **55.4**. A surprise increase here could enhance USD strength, reflecting improved consumer confidence.
In Europe, the **Spanish GDP** report at **3:00 AM ET** showed a robust **0.8%** growth against a forecast of **0.7%**, which may provide support to the EUR. Additionally, **ECB President Lagarde’s** speech at **5:30 AM ET** will be closely monitored for hints on monetary policy direction.
Lastly, **BoJ Board Member Noguchi’s** speech at **1:30 AM ET** could influence JPY sentiment, particularly if any dovish tones are perceived. Overall, these events will be pivotal in shaping currency movements today.
## Major FX Group
| Name | Symbol | Price | Daily (%) | 5D (%) | 1W (%) | 1M (%) | 3M (%) | 6M (%) | YTD (%) | 12M (%) | MA50 | MA100 | MA200 | RSI | MACD |
|---|---|---|---|---|---|---|---|---|---|---|---|---|---|---|---|
| EUR/USD – Euro / U.S. Dollar | EURUSD | 1.1681 | 0.0857 | -0.9334 | -0.9334 | 0.3573 | -0.0959 | 8.1474 | 12.25 | 4.9409 | 1.1681 | 1.1589 | 1.1143 | 47.53 | 0.0025 |
| USD/JPY – U.S. Dollar / Japanese Yen | USDJPY | 149.86 | 0.0875 | 1.2930 | 1.2930 | 1.6262 | 3.5703 | -0.6543 | -4.5447 | 3.5782 | 147.70 | 146.39 | 148.61 | 60.41 | 0.2848 |
| GBP/USD – British Pound / U.S. Dollar | GBPUSD | 1.3353 | 0.0749 | -1.4976 | -1.4976 | -0.9328 | -2.7087 | 3.0958 | 6.4060 | 0.2794 | 1.3471 | 1.3490 | 1.3118 | 39.88 | -0.0005 |
| USD/CHF – U.S. Dollar / Swiss Franc | USDCHF | 0.7993 | -0.0250 | 0.8568 | 0.8568 | -0.5549 | -0.1985 | -9.3147 | -11.5075 | -6.0277 | 0.8013 | 0.8081 | 0.8453 | 39.69 | -0.0029 |
| AUD/USD – Australian Dollar / U.S. Dollar | AUDUSD | 0.6535 | -0.0917 | -1.2527 | -1.2527 | 0.6034 | -0.1726 | 3.7039 | 5.0643 | -4.2013 | 0.6541 | 0.6518 | 0.6401 | 47.38 | 0.0016 |
| USD/CAD – U.S. Dollar / Canadian Dollar | USDCAD | 1.3943 | 0.0215 | 1.0963 | 1.0963 | 0.7923 | 2.1982 | -2.5476 | -2.8349 | 3.4178 | 1.3787 | 1.3761 | 1.4005 | 61.83 | 0.0022 |
| NZD/USD – New Zealand Dollar / U.S. Dollar | NZDUSD | 0.5764 | -0.0693 | -2.1607 | -2.1607 | -1.6114 | -4.8686 | 0.4809 | 2.2038 | -7.8821 | 0.5917 | 0.5957 | 0.5839 | 36.11 | -0.0023 |
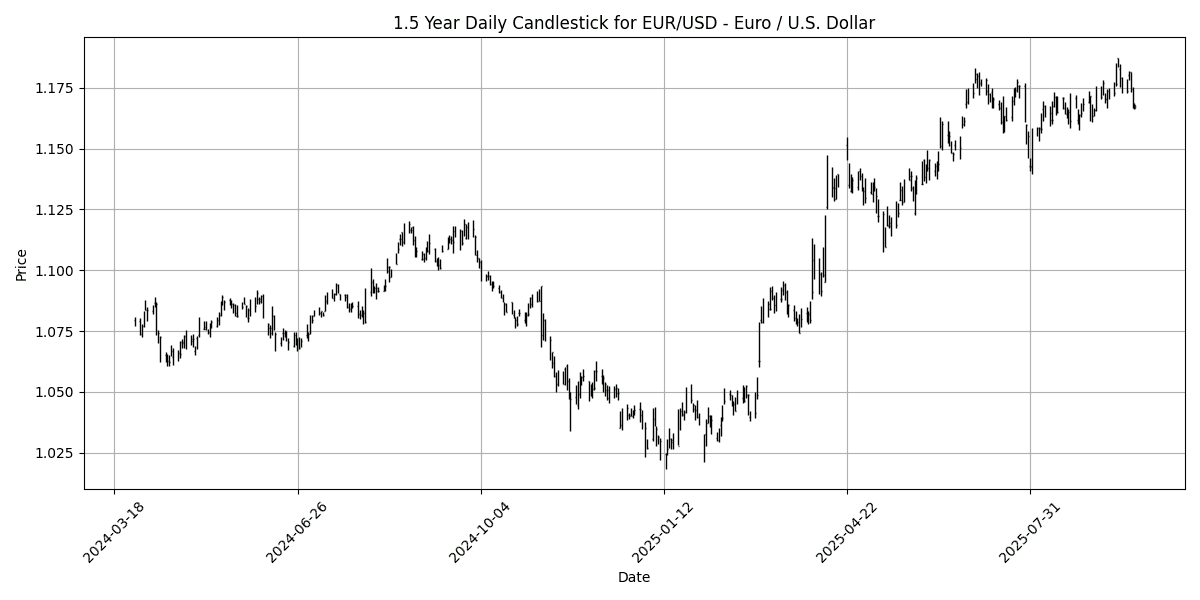
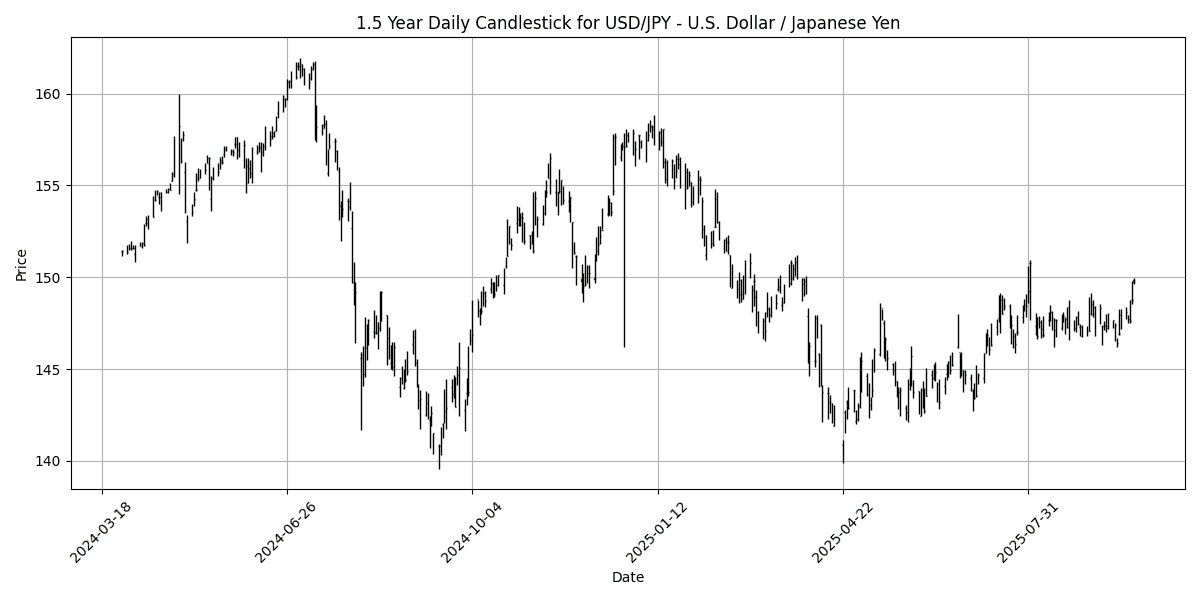
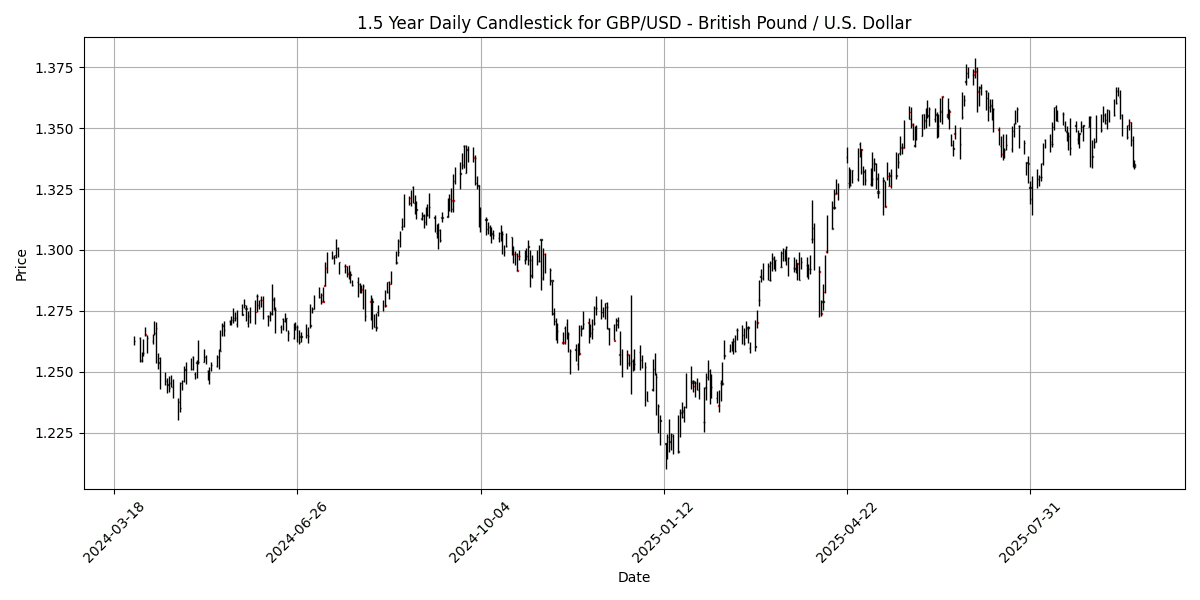
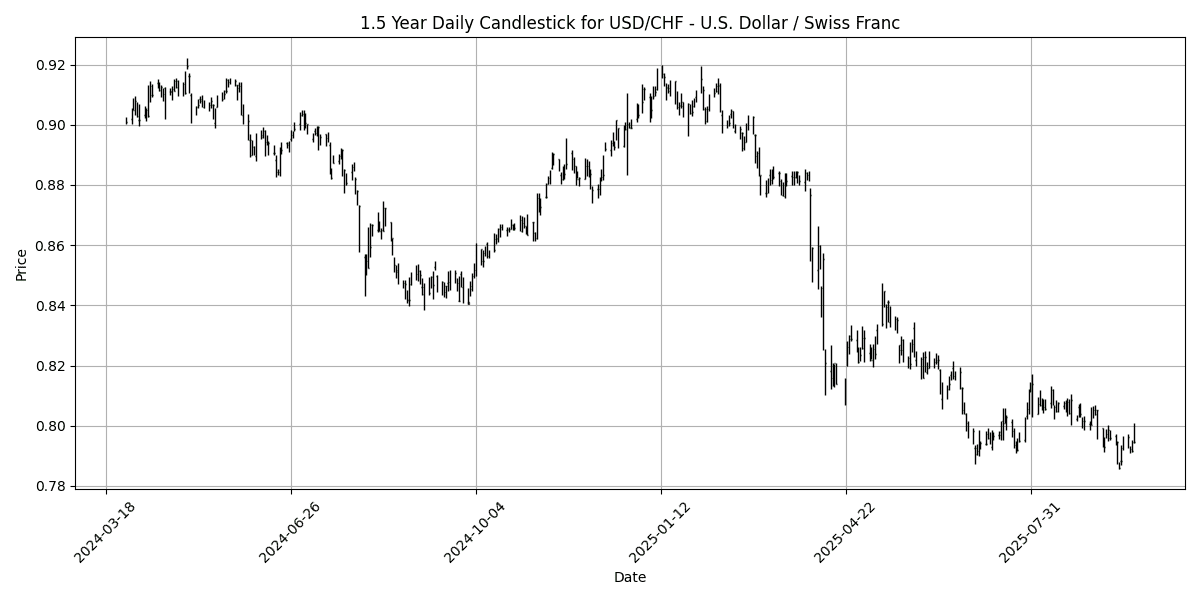
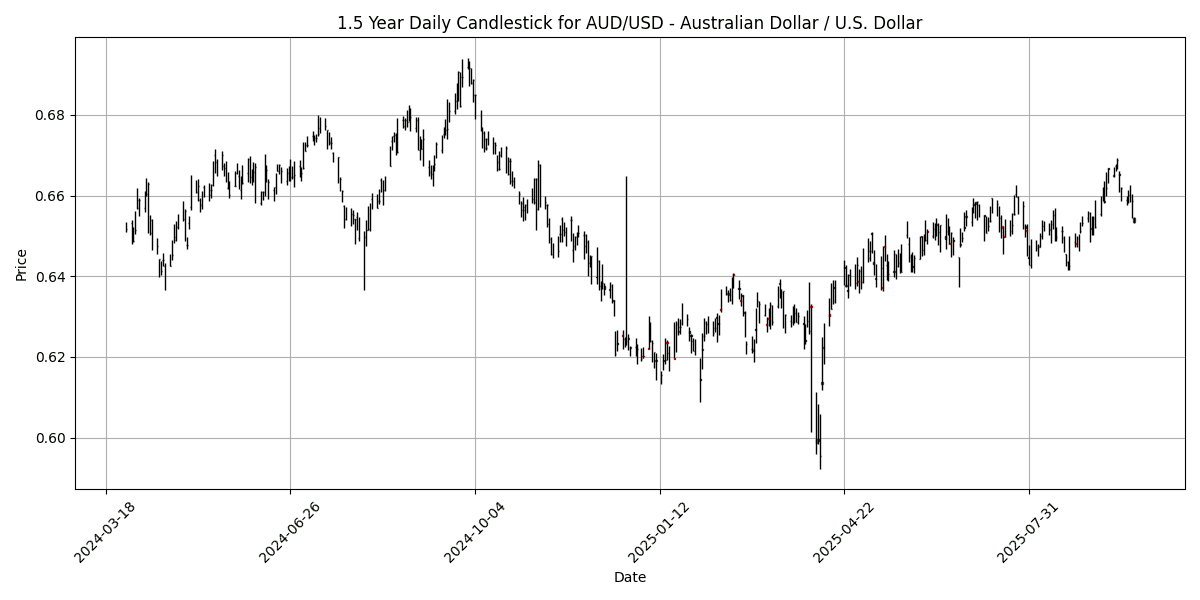
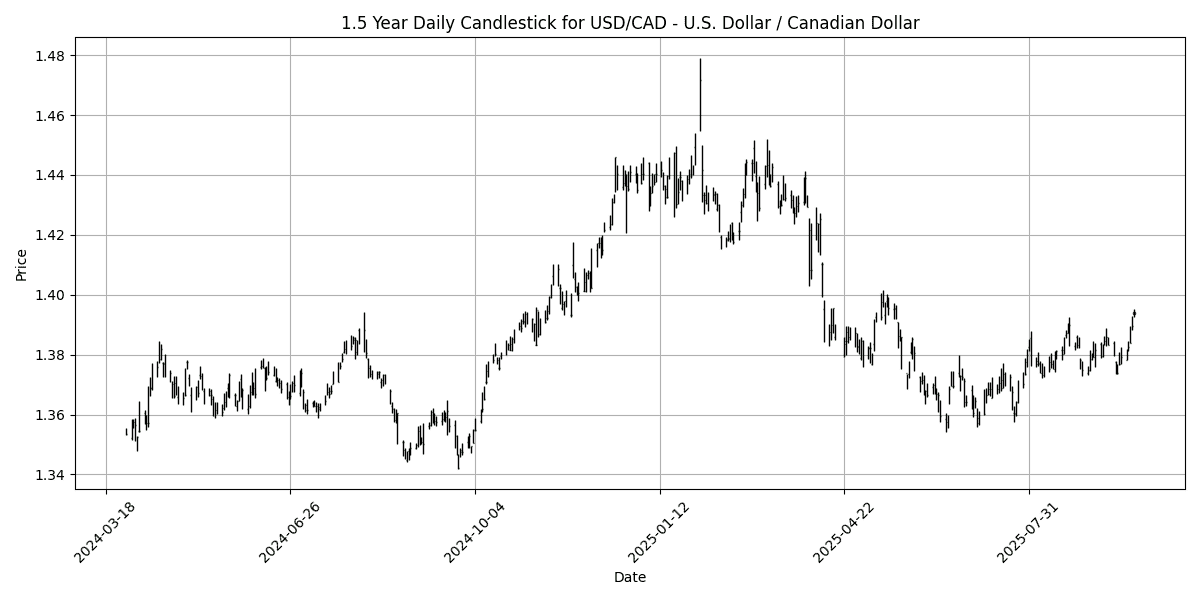
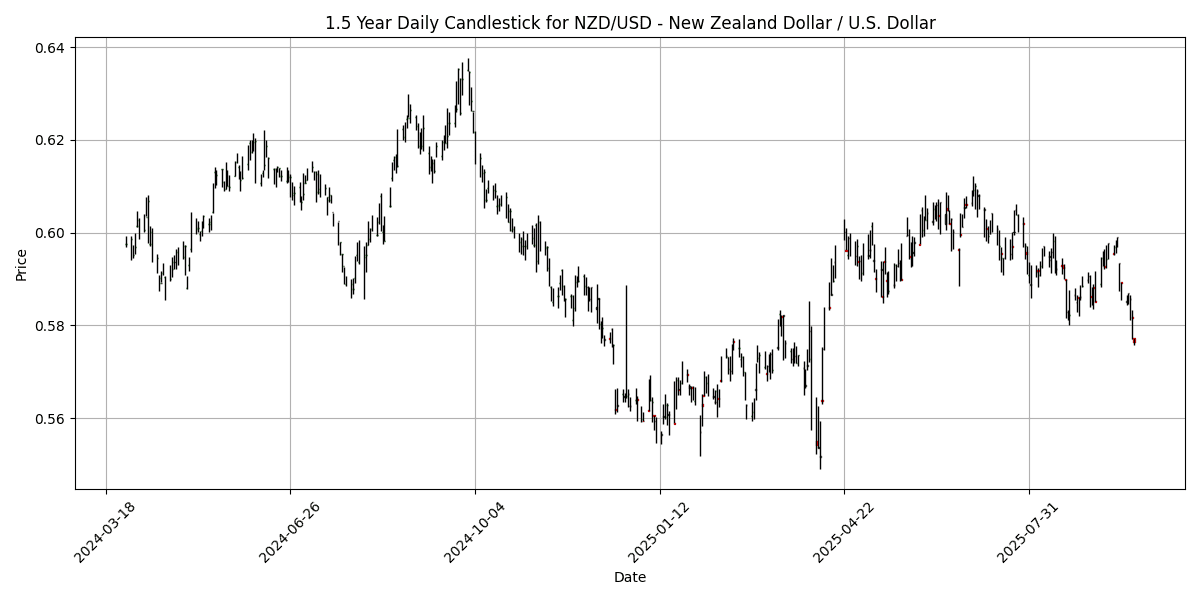
In the current forex landscape, several key pairs exhibit notable technical indicators. The EUR/USD remains neutral with an RSI of 47.53, reflecting a balanced market without overbought or oversold conditions. The MACD is marginally positive, suggesting potential bullish momentum, while moving averages indicate a stable trend.
Contrastingly, the GBP/USD and NZD/USD are in oversold territory, with RSIs at 39.88 and 36.11, respectively. Both pairs show bearish MACD readings, reinforcing the downtrend. The GBP/USD’s moving averages suggest a bearish outlook, emphasizing the need for caution.
The USD/JPY and USD/CAD, with RSIs of 60.41 and 61.83, are nearing overbought levels but still maintain bullish MACD signals. Their moving averages indicate upward momentum, yet traders should watch for potential reversals as they approach overbought conditions.
Overall, while some pairs show bullish potential, the oversold conditions in GBP
## Cross FX Group
| Name | Symbol | Price | Daily (%) | 5D (%) | 1W (%) | 1M (%) | 3M (%) | 6M (%) | YTD (%) | 12M (%) | MA50 | MA100 | MA200 | RSI | MACD |
|---|---|---|---|---|---|---|---|---|---|---|---|---|---|---|---|
| EUR/GBP | EURGBP | 0.8745 | 0.0114 | 0.5577 | 0.5577 | 1.2739 | 2.6649 | 4.8687 | 5.4644 | 4.6253 | 0.8671 | 0.8590 | 0.8491 | 66.05 | 0.0021 |
| EUR/JPY | EURJPY | 174.99 | 0.1620 | 0.3170 | 0.3170 | 1.9619 | 3.4453 | 7.4121 | 7.0991 | 8.6593 | 172.47 | 169.54 | 165.34 | 65.01 | 0.6485 |
| EUR/CHF | EURCHF | 0.9334 | 0.0536 | -0.0910 | -0.0910 | -0.2191 | -0.3097 | -1.9651 | -0.6916 | -1.4122 | 0.9358 | 0.9359 | 0.9390 | 40.06 | -0.0008 |
| EUR/AUD | EURAUD | 1.7876 | 0.1962 | 0.3525 | 0.3525 | -0.2294 | 0.1014 | 4.2971 | 6.8372 | 9.5639 | 1.7857 | 1.7778 | 1.7399 | 50.54 | -0.0006 |
| GBP/JPY | GBPJPY | 200.09 | 0.1476 | -0.2269 | -0.2269 | 0.6909 | 0.7690 | 2.4222 | 1.5706 | 3.8635 | 198.95 | 197.47 | 194.76 | 49.42 | 0.3137 |
| GBP/CHF | GBPCHF | 1.0673 | 0.0469 | -0.6442 | -0.6442 | -1.4733 | -2.8889 | -6.5125 | -5.8279 | -5.7655 | 1.0791 | 1.0895 | 1.1062 | 31.08 | -0.0035 |
| AUD/JPY | AUDJPY | 97.88 | -0.0225 | -0.0255 | -0.0255 | 2.1978 | 3.3470 | 2.9849 | 0.2643 | -0.8207 | 96.60 | 95.41 | 95.07 | 59.23 | 0.4221 |
| AUD/NZD | AUDNZD | 1.1334 | -0.0265 | 0.9800 | 0.9800 | 2.2288 | 4.9931 | 3.1855 | 2.7845 | 4.0485 | 1.1055 | 1.0942 | 1.0964 | 81.78 | 0.0071 |
| CHF/JPY | CHFJPY | 187.47 | 0.1143 | 0.4218 | 0.4218 | 2.1883 | 3.7844 | 9.5658 | 7.8655 | 10.22 | 184.34 | 181.25 | 176.14 | 65.45 | 0.8953 |
| NZD/JPY | NZDJPY | 86.35 | 0.0151 | -0.9031 | -0.9031 | -0.0139 | -1.4573 | -0.1803 | -2.4524 | -4.6076 | 87.37 | 87.17 | 86.70 | 34.28 | -0.1768 |
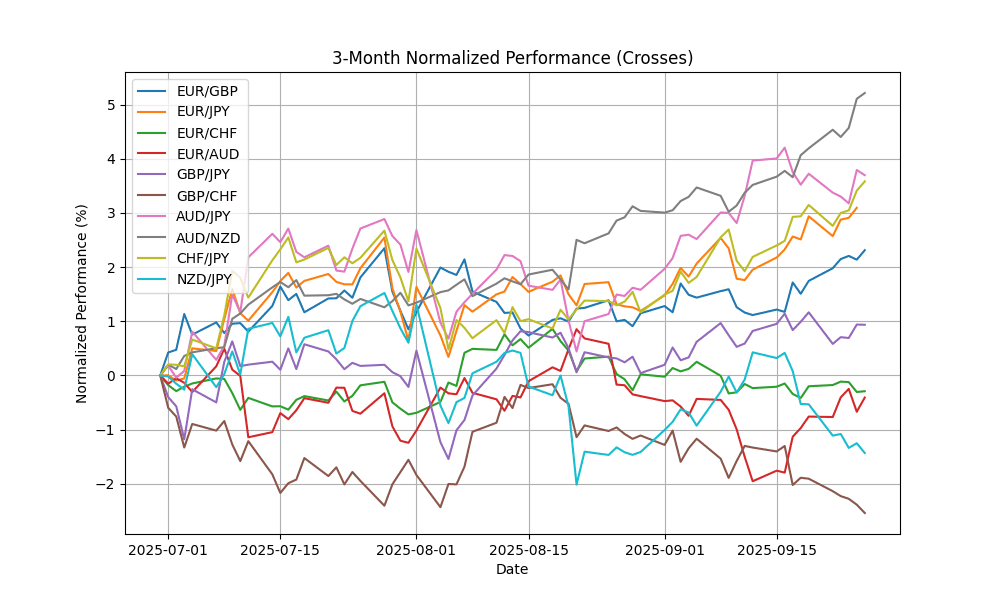
In the current analysis of key FX pairs, AUD/NZD is notably overbought with an RSI of 81.78, suggesting potential for a price correction. Conversely, GBP/CHF exhibits oversold conditions with an RSI of 31.08 and a negative MACD, indicating bearish momentum. EUR/CHF also shows signs of weakness, with an RSI of 40.06 and a negative MACD, reinforcing its bearish outlook. Other pairs like EUR/GBP and EUR/JPY remain neutral, with RSIs below 70, while GBP/JPY and AUD/JPY reflect moderate bullish sentiment. Traders should watch for potential reversals in the overbought and oversold pairs as market conditions evolve.
## Exotics and Emerging
| Name | Symbol | Price | Daily (%) | 5D (%) | 1W (%) | 1M (%) | 3M (%) | 6M (%) | YTD (%) | 12M (%) | MA50 | MA100 | MA200 | RSI | MACD |
|---|---|---|---|---|---|---|---|---|---|---|---|---|---|---|---|
| USD/TRY – U.S. Dollar / Turkish Lira | USDTRY | 41.57 | 0.0607 | 0.4114 | 0.4114 | 1.2915 | 4.2987 | 9.3787 | 17.74 | 21.68 | 40.94 | 40.18 | 38.41 | 77.45 | 0.1494 |
| USD/ZAR – U.S. Dollar / South African Rand | USDZAR | 17.45 | 0.0797 | 0.6376 | 0.6376 | -0.9621 | -2.2939 | -4.1441 | -7.0024 | 1.0803 | 17.61 | 17.74 | 18.12 | 41.35 | -0.0863 |
| USD/THB – U.S. Dollar / Thai Baht | USDTHB | 32.23 | 0.1243 | 1.0662 | 1.0662 | -0.6167 | -0.9222 | -4.6732 | -5.5918 | -1.6479 | 32.22 | 32.45 | 33.17 | 54.55 | -0.0848 |
| USD/SEK – U.S. Dollar / Swedish Krona | USDSEK | 9.4378 | -0.1787 | 1.0069 | 1.0069 | -1.2474 | -0.7383 | -5.5139 | -14.3873 | -7.2899 | 9.4994 | 9.5435 | 10.01 | 54.32 | -0.0356 |
| USD/NOK – U.S. Dollar / Norwegian Krone | USDNOK | 10.03 | 0.0668 | 1.6529 | 1.6529 | -0.9381 | -0.2435 | -4.3027 | -11.4377 | -5.1285 | 10.09 | 10.11 | 10.53 | 51.00 | -0.0476 |
| USD/DKK – U.S. Dollar / Danish Krone | USDDKK | 6.3914 | -0.0750 | 0.9583 | 0.9583 | -0.3378 | 0.1646 | -7.4756 | -10.8193 | -4.6074 | 6.3907 | 6.4431 | 6.7152 | 42.93 | -0.0185 |
| USD/MXN – U.S. Dollar / Mexican Peso | USDMXN | 18.46 | -0.0752 | 0.5277 | 0.5277 | -1.0583 | -2.2126 | -8.9779 | -10.5229 | -5.9863 | 18.62 | 18.83 | 19.56 | 32.94 | -0.0801 |
| USD/PLN – U.S. Dollar / Polish Zloty | USDPLN | 3.6549 | -0.0875 | 1.1468 | 1.1468 | -0.0503 | 0.7834 | -5.6356 | -11.0096 | -4.6758 | 3.6435 | 3.6718 | 3.8110 | 55.01 | -0.0060 |
| USD/HUF – U.S. Dollar / Hungarian Forint | USDHUF | 335.56 | 0.0394 | 1.8370 | 1.8370 | -1.3125 | -1.8250 | -9.6871 | -15.0493 | -5.4267 | 338.10 | 343.93 | 361.88 | 41.83 | -2.3325 |
| USD/CZK – U.S. Dollar / Czech Koruna | USDCZK | 20.82 | 0.0831 | 1.0889 | 1.0889 | -1.0586 | -1.5121 | -9.7941 | -13.8005 | -7.7460 | 20.93 | 21.24 | 22.34 | 51.10 | -0.0922 |
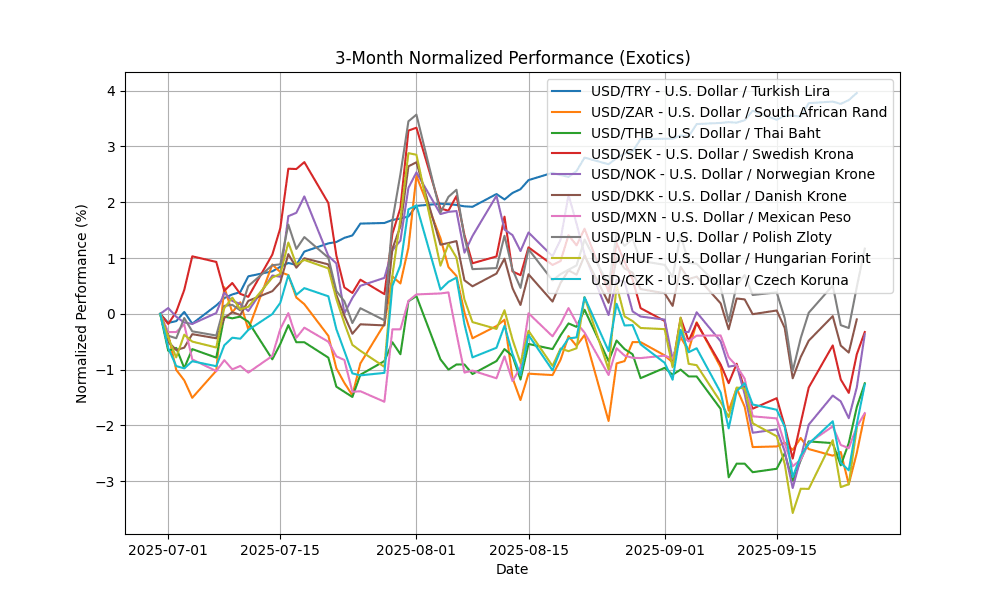
The USD/TRY is currently exhibiting overbought conditions, with an RSI of 77.45 and a positive MACD of 0.1494, suggesting potential price corrections ahead. The moving averages indicate a strong bullish trend, yet caution is warranted due to the extreme RSI level. Conversely, the USD/ZAR and USD/MXN are in oversold territory, with RSIs of 41.35 and 32.94, respectively, coupled with negative MACD readings, indicating bearish momentum. These pairs may present buying opportunities as they approach support levels. Overall, market participants should closely monitor the USD/TRY for potential reversals while considering entry points in the oversold pairs.


