Top 10 Performers
Advanced Micro Devices Inc (AMD) (7.65%)
Recent News (Last 24 Hours)
The recent flurry of news surrounding major tech stocks, particularly AMD and Nvidia, has significant implications for their stock performance. AMD’s groundbreaking partnership with OpenAI, as highlighted in multiple sources including Motley Fool and MarketBeat, suggests a potential doubling of its stock value. This partnership, which redraws the AI map, could significantly boost AMD’s long-term revenue and market positioning, making it a strong buy for investors looking at AI growth.
Nvidia, on the other hand, is making strategic investments in Elon Musk’s xAI, as reported by Barrons.com and Bloomberg. This move, coupled with Nvidia’s involvement in AI developments, could bolster its stock as it continues to be a key player in AI chip technology.
However, there are concerns about an AI bubble, with Fortune and Barrons.com discussing the potential risks of a market correction reminiscent of the dotcom crash. This sentiment could introduce volatility to stocks heavily invested in AI, like Nvidia and AMD.
Overall, while the AI sector presents substantial growth opportunities for these tech giants, investors should be cautious of the potential for overvaluation in this rapidly evolving market.
Technical Analysis
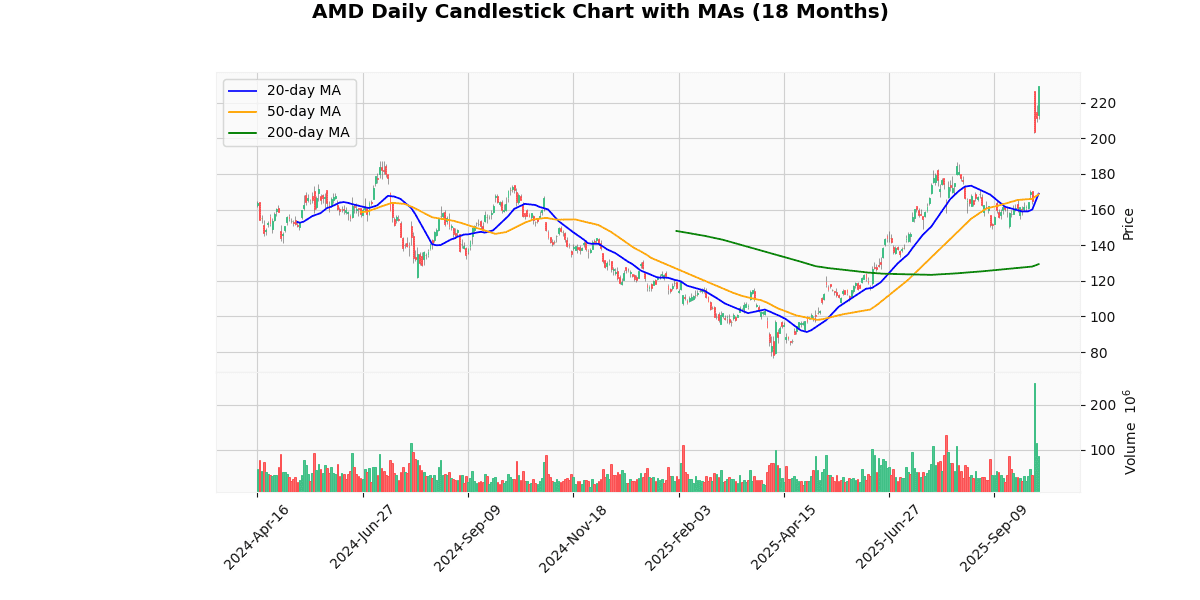
The current price of the asset at $229.68 indicates a significant uptrend when compared to its moving averages: 20-day MA at $168.95, 50-day MA at $168.56, and 200-day MA at $129.38. This substantial premium above all three key moving averages suggests a strong bullish momentum in the short, medium, and long term. The consistent increase across these averages, with the 200-day MA being the lowest, highlights a steady upward trajectory over an extended period. The fact that the current price is well above the 20-day and 50-day MAs, which are nearly identical, indicates that recent trading sessions have seen particularly strong buying interest, potentially signaling continued investor confidence and a positive market sentiment. Investors might view these indicators as a robust entry point if the momentum is expected to sustain, albeit with considerations for potential corrections due to the sharp rise.
Recent Ratings
| Date | Status | Outer | Rating | Price |
|---|---|---|---|---|
| 2025-10-08 | Upgrade | DZ Bank | Hold → Buy | $250 |
| 2025-10-07 00:00:00 | Upgrade | Jefferies | Hold → Buy | $300 |
| 2025-09-11 00:00:00 | Downgrade | Erste Group | Buy → Hold | |
| 2025-09-04 00:00:00 | Downgrade | Seaport Research Partners | Buy → Neutral |
ON Semiconductor Corp (ON) (5.06%)
Technical Analysis
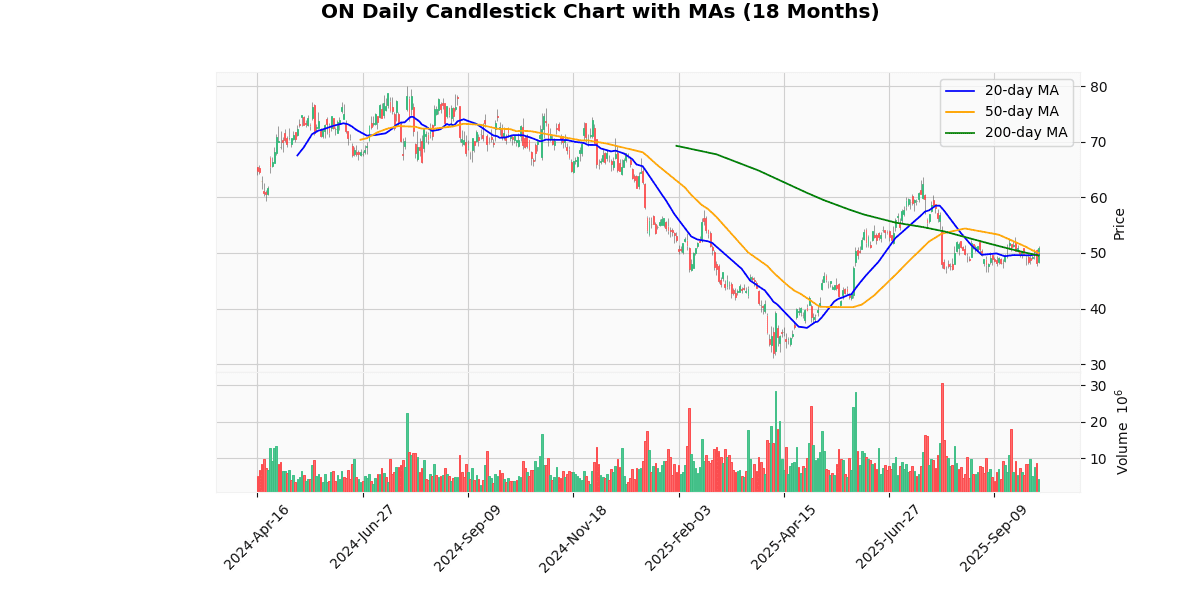
The current price of the asset at $50.85 shows a positive trajectory when compared to its moving averages (MA) across different time frames: 20-day MA at $49.76, 50-day MA at $49.98, and 200-day MA at $49.52. This indicates a bullish trend as the current price is positioned above all selected moving averages, suggesting a consistent upward momentum in the short, medium, and long term. The fact that the current price surpasses the 20-day and 50-day MAs by approximately 1% and 2% respectively, reinforces the strength of the current uptrend. Additionally, the price being above the 200-day MA, which often acts as a benchmark for long-term market sentiment, further solidifies a positive outlook for the asset. Investors might view these indicators as a robust signal for potential continued growth, barring any unforeseen market volatilities.
Recent Ratings
| Date | Status | Outer | Rating | Price |
|---|---|---|---|---|
| 2025-08-05 00:00:00 | Reiterated | TD Cowen | Buy | $68 → $55 |
| 2025-08-05 00:00:00 | Downgrade | BofA Securities | Buy → Neutral | $56 |
| 2025-07-10 00:00:00 | Initiated | Goldman | Neutral | $60 |
| 2025-06-18 00:00:00 | Initiated | Cantor Fitzgerald | Neutral | $55 |
Zscaler Inc (ZS) (4.11%)
Technical Analysis
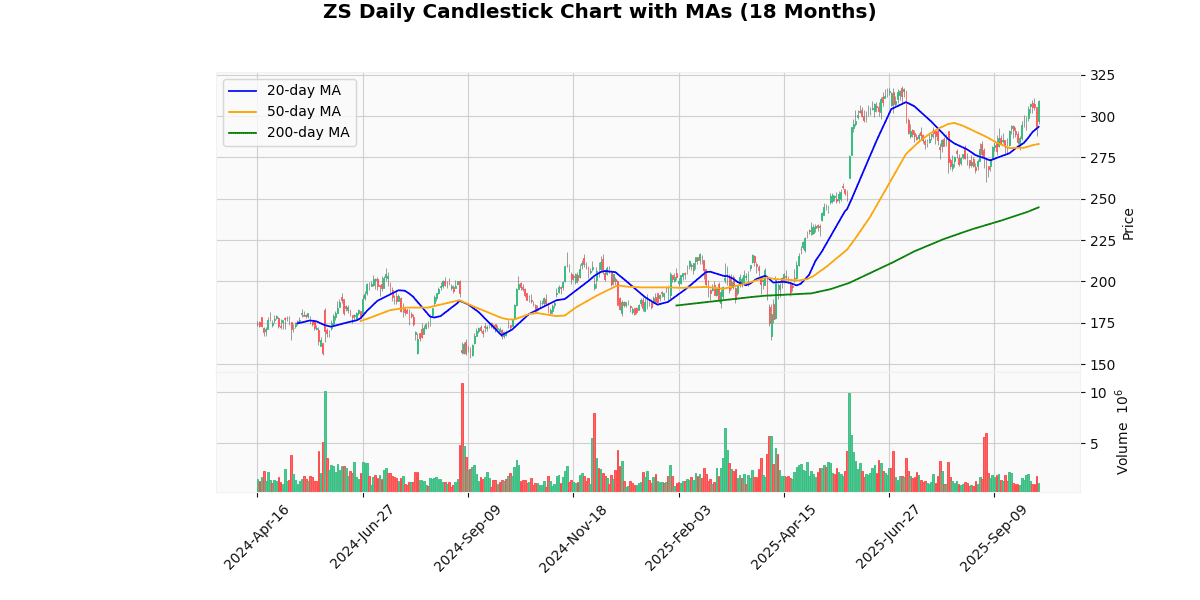
The current price of the asset stands at $308.75, indicating a robust upward trend when analyzed against its moving averages (MAs). The 20-day MA at $293.49 and the 50-day MA at $283.19 both substantiate a short to medium-term bullish momentum, as the current price is positioned well above these levels. This suggests recent trading sessions have been consistently closing higher, reinforcing buyer confidence in the market.
Furthermore, the significant gap between the current price and the 200-day MA of $244.82 highlights a strong long-term uptrend. This disparity suggests that the asset has gained considerable ground over a more extended period, likely driven by fundamental improvements or sustained investor interest.
Overall, the positioning above all key MAs indicates a solid bullish stance in the market, with potential for continued upward movement if the trend persists. Investors should monitor for any signs of reversal but may consider the current trajectory as a confirmation of ongoing positive sentiment.
Recent Ratings
| Date | Status | Outer | Rating | Price |
|---|---|---|---|---|
| 2025-09-03 00:00:00 | Reiterated | BMO Capital Markets | Outperform | $295 → $315 |
| 2025-09-02 00:00:00 | Upgrade | Morgan Stanley | Equal-Weight → Overweight | $320 |
| 2025-08-26 00:00:00 | Initiated | B. Riley Securities | Neutral | $275 |
| 2025-06-13 00:00:00 | Upgrade | Wells Fargo | Equal Weight → Overweight | $385 |
Datadog Inc (DDOG) (3.96%)
Recent News (Last 24 Hours)
Datadog, Inc. (NASDAQ: DDOG) has been the subject of notable financial news recently, impacting its stock performance. On October 8, 2025, Datadog released its “2025 State of Cloud Security Report,” which highlighted an increasing trend among companies to adopt data perimeters in response to rising concerns over credential theft. This report, detailed by Newsfile, underscores Datadog’s pivotal role in addressing critical cybersecurity challenges, potentially enhancing its market position and investor confidence.
Furthermore, on the same day, StockStory reported a positive uptick in Datadog’s stock, suggesting that the market is reacting favorably to the company’s latest developments and possibly its earnings outlook. This rise contrasts with the previous day’s performance, where, as reported by Zacks on October 7, 2025, Datadog experienced a more significant dip than the broader market, highlighting the stock’s volatility and sensitivity to market dynamics.
These developments suggest a mixed but cautiously optimistic outlook for Datadog’s stock. Investors may view the company’s focus on enhancing cloud security as a growth driver amidst increasing digital threats, although the stock’s recent volatility could suggest underlying market uncertainties or investor hesitations about sector-specific risks.
Technical Analysis
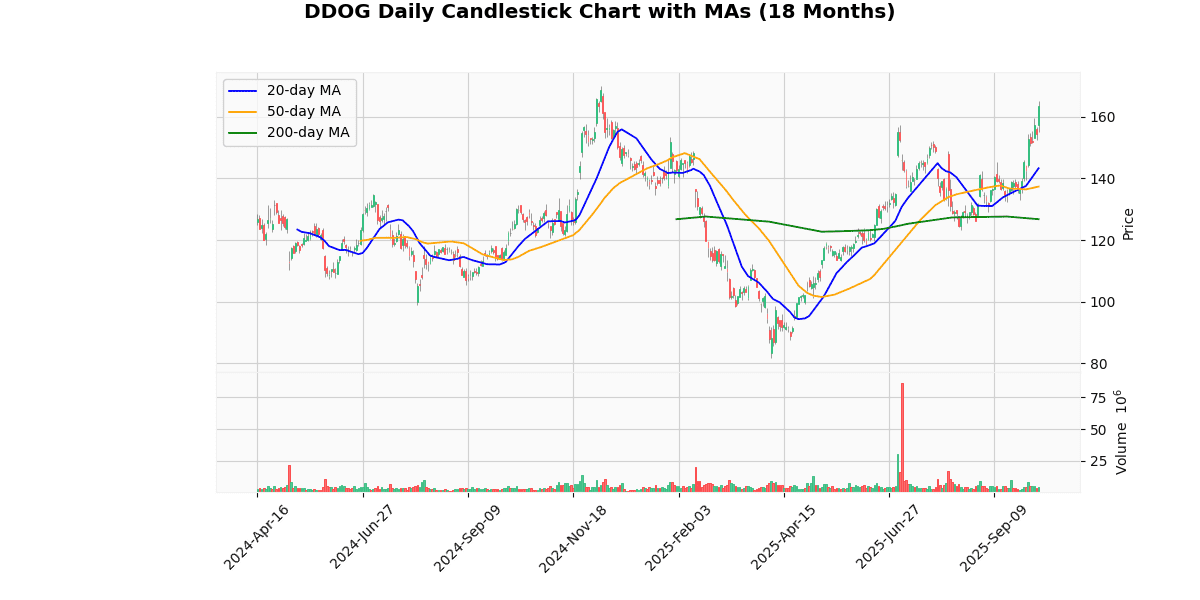
The current price of the asset at $163.32 shows a significant uptrend when analyzed against its moving averages (MAs). The 20-day moving average (MA20) at $143.29 and the 50-day moving average (MA50) at $137.34 both indicate a strong short-term bullish momentum, as the current price is well above these levels. Furthermore, the 200-day moving average (MA200) at $126.76 underscores a robust long-term upward trend. This positioning above all key moving averages suggests that the asset has sustained buying interest and could be experiencing a bullish phase. Investors might view these metrics as a confirmation of continued upward movement, potentially attracting more buying activity in anticipation of further price increases. However, vigilance is advised as such steep inclines could also lead to volatility or corrective pullbacks.
Recent Ratings
| Date | Status | Outer | Rating | Price |
|---|---|---|---|---|
| 2025-10-01 00:00:00 | Initiated | Wells Fargo | Overweight | $190 |
| 2025-08-07 00:00:00 | Reiterated | Monness Crespi & Hardt | Buy | $160 → $185 |
| 2025-07-08 00:00:00 | Downgrade | Guggenheim | Neutral → Sell | $105 |
| 2025-06-12 00:00:00 | Upgrade | Wolfe Research | Peer Perform → Outperform | $150 |
Old Dominion Freight Line Inc (ODFL) (3.85%)
Recent News (Last 24 Hours)
In a recent analysis published by Insider Monkey on October 8, 2025, Old Dominion Freight Line (ODFL) has been highlighted as a promising investment opportunity. The article delves into various factors that position ODFL favorably in the market. This coverage is likely to influence investor sentiment and could potentially lead to an uptick in stock prices due to increased investor interest.
Investors and analysts will be keen on understanding the specifics that make ODFL stand out in the competitive freight and logistics industry, such as operational efficiency, financial robustness, and strategic growth initiatives. Positive media coverage like this often plays a critical role in shaping market perceptions and can lead to increased trading volumes. Current and potential investors should monitor ODFL’s stock closely in the coming days for any signs of movement tied to this news release, keeping an eye on broader market trends and sector-specific developments that might impact the stock further.
Technical Analysis
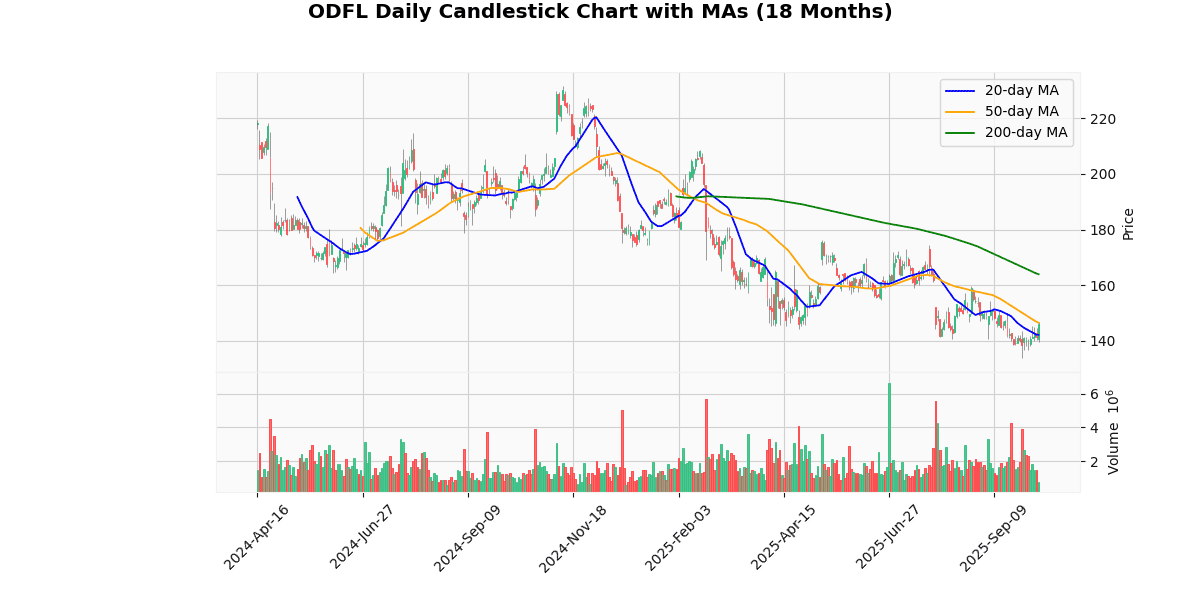
The current price of the asset at $145.98 shows a mixed signal within the context of its moving averages. Notably, the price is slightly below the 50-day moving average (MA50) of $146.50, indicating a potential short-term bearish sentiment or consolidation phase. However, it stands above the 20-day moving average (MA20) of $142.15, suggesting some recent upward momentum. This positioning between the MA20 and MA50 could indicate a tug-of-war between buyers and sellers as they navigate short-term fluctuations.
The significant deviation from the 200-day moving average (MA200) at $163.96 underscores a longer-term downtrend, reflecting a bearish outlook over a more extended period. Investors might view this as a cautionary signal, indicating that the asset has struggled to regain ground lost in previous sessions. Overall, the asset’s current positioning suggests a cautious market sentiment with potential volatility as it attempts to find more stable footing.
Recent Ratings
| Date | Status | Outer | Rating | Price |
|---|---|---|---|---|
| 2025-07-31 00:00:00 | Upgrade | Vertical Research | Hold → Buy | $170 |
| 2025-07-31 00:00:00 | Reiterated | TD Cowen | Hold | $166 → $159 |
| 2025-07-01 00:00:00 | Resumed | Robert W. Baird | Neutral | $164 |
| 2025-06-02 00:00:00 | Upgrade | Goldman | Neutral → Buy | $200 |
Marvell Technology Inc (MRVL) (3.53%)
Recent News (Last 24 Hours)
In a recent analysis by Zacks, published on October 8, 2025, Marvell Technology (MRVL) has been highlighted as a strong momentum stock. This designation is significant as it suggests that Marvell Technology is currently exhibiting upward trend behaviors in its stock performance that could be attractive to momentum investors. Momentum stocks, which are characterized by increasing prices and strong performance metrics, can influence investor sentiment and potentially lead to increased stock prices due to heightened demand.
For investors and stakeholders in Marvell Technology, this classification could signal robust future performance, potentially driven by operational successes or favorable market conditions that have yet to be fully reflected in the stock price. As such, this news might encourage more investors to consider adding MRVL to their portfolios, expecting the momentum to continue and thus, possibly driving the stock’s price higher in the near term.
Technical Analysis
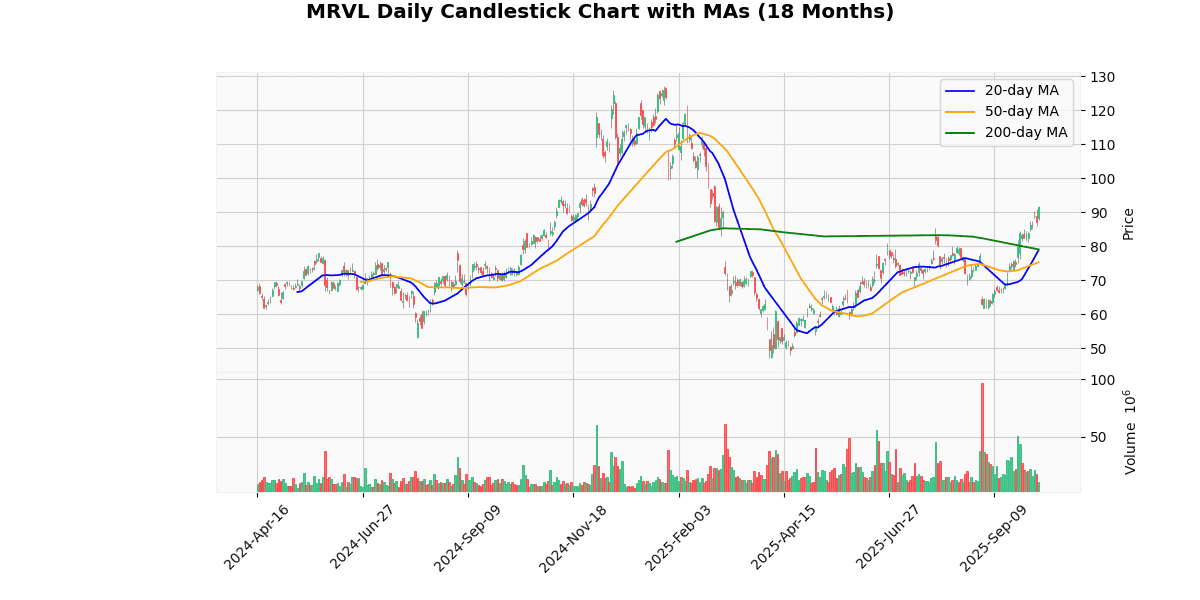
The current price of $91.48 reflects a significant upward trend when analyzed against the moving averages (MAs) over 20, 50, and 200 days. The 20-day MA at $78.85 and the 50-day MA at $75.31 both indicate a strong short-term bullish momentum, as the current price is substantially higher than these averages. Additionally, the 200-day MA at $79.05 further underscores a positive shift in the longer-term market sentiment towards this asset.
This positioning above all three key MAs suggests robust investor confidence and potential continued upward movement. Traders might view these metrics as a confirmation of a strong bullish phase, possibly adjusting their strategies towards buying on dips in anticipation of sustained upward trends. However, vigilance is advised as the significant divergence from the historical averages could also hint at overextension, potentially leading to corrections.
Recent Ratings
| Date | Status | Outer | Rating | Price |
|---|---|---|---|---|
| 2025-10-01 00:00:00 | Downgrade | TD Cowen | Buy → Hold | $85 |
| 2025-08-29 00:00:00 | Reiterated | Needham | Buy | $85 → $80 |
| 2025-08-29 00:00:00 | Downgrade | BofA Securities | Buy → Neutral | $78 |
| 2025-07-10 00:00:00 | Initiated | Goldman | Neutral | $75 |
Applied Materials Inc (AMAT) (3.42%)
Recent News (Last 24 Hours)
The stock market today shows a mixed landscape with significant implications for investors, particularly in the technology and semiconductor sectors. The Dow Jones Industrial Average is up, indicating positive sentiment as the market anticipates the upcoming Federal Reserve report. However, specific sectors face challenges, notably those involved in semiconductor manufacturing.
Shares of ASML and Applied Materials have fallen sharply following a critical report by a U.S. panel concerning sales to China. This downturn is part of a broader trend as U.S. lawmakers intensify scrutiny and call for broader bans on chipmaking tool sales to China, suggesting a tightening of export controls which could significantly impact companies in the semiconductor industry. This regulatory pressure is likely to affect stock valuations for companies like ASML, Applied Materials, NXP Semiconductors, Vishay Intertechnology, Allegro MicroSystems, and Lattice Semiconductor, all of which saw their stocks trade down recently.
Investors should closely monitor the developments in U.S. policy towards semiconductor exports to China, as further restrictions could lead to volatility in the stocks of key players in this sector. Additionally, the upcoming FOMC meeting minutes might provide further direction on the economic outlook, potentially influencing broader market movements.
Technical Analysis
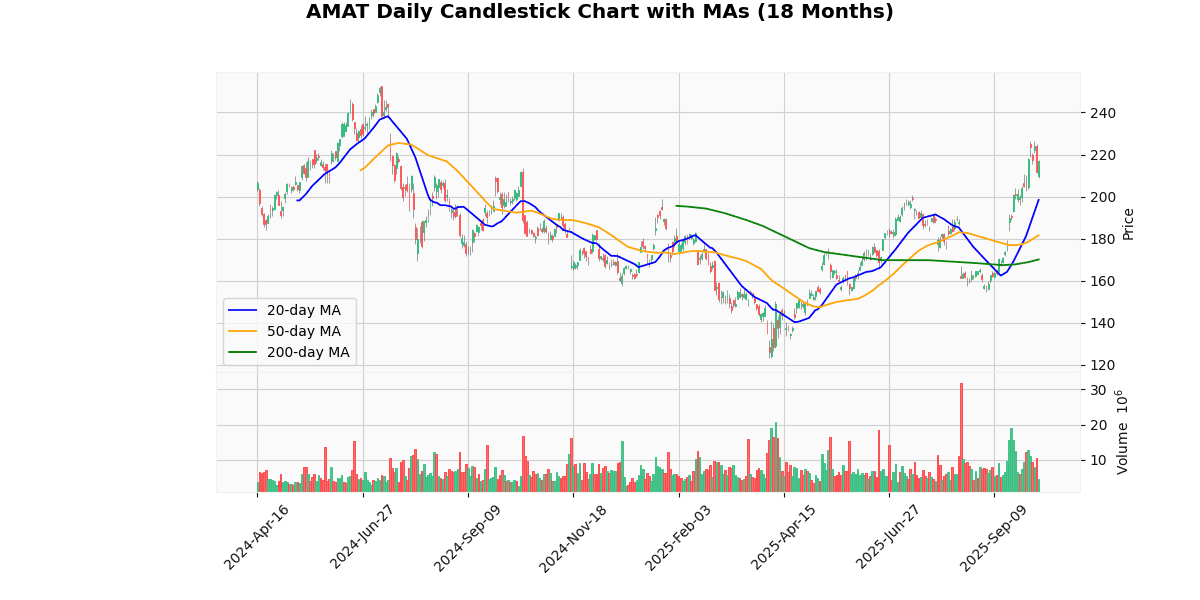
The current price of the asset at $216.81 indicates a robust upward trend when evaluated against its moving averages (MAs). It is trading significantly above its 20-day MA of $198.38, its 50-day MA of $181.59, and its 200-day MA of $170.08. This pattern suggests a strong bullish momentum in the short, medium, and long term. The considerable gap between the current price and all three MAs not only underscores the asset’s recent gains but also indicates that it has consistently outperformed its historical average prices over these periods. Investors might view these metrics as a signal of sustained positive sentiment and potential continued upward movement, although caution is warranted as such steep inclines could also lead to volatility or corrective pullbacks if market conditions change.
Recent Ratings
| Date | Status | Outer | Rating | Price |
|---|---|---|---|---|
| 2025-09-22 00:00:00 | Upgrade | Morgan Stanley | Equal-Weight → Overweight | $209 |
| 2025-09-12 00:00:00 | Downgrade | Mizuho | Outperform → Neutral | $175 |
| 2025-08-20 00:00:00 | Downgrade | Daiwa Securities | Outperform → Neutral | $170 |
| 2025-08-15 00:00:00 | Reiterated | TD Cowen | Buy | $220 → $200 |
NXP Semiconductors NV (NXPI) (2.92%)
Recent News (Last 24 Hours)
NXP Semiconductors is set to release its quarterly earnings soon, an event that is highly anticipated by investors and analysts alike. The upcoming earnings report is crucial as it provides insights into the company’s financial health and operational performance. Investors should closely monitor the earnings results to assess whether NXP Semiconductors has met, exceeded, or fallen short of market expectations. The performance of the company in this quarter could significantly influence the stock’s movement and investor sentiment. Positive earnings results could lead to a surge in stock price due to increased investor confidence, while disappointing results might trigger a decline. Additionally, the earnings report could provide valuable information on the company’s future outlook, including guidance on expected revenue and profit margins, which are key drivers of stock valuation. Investors are advised to review the full details of the earnings report to make informed investment decisions.
Technical Analysis
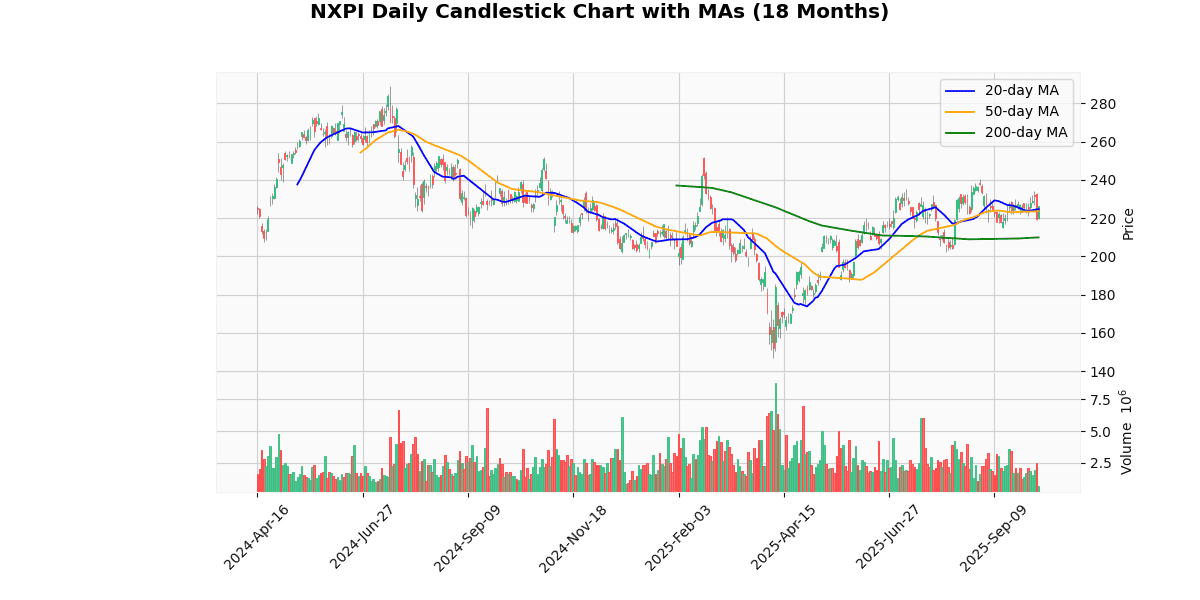
The current price of the asset at $226.33 shows a bullish trend when analyzed against its moving averages (MAs). It is trading above the 20-day MA of $224.76 and the 50-day MA of $223.62, indicating a positive momentum in the short to medium term. This positioning above both the 20-day and 50-day MAs suggests that recent trading sessions have been favorable, and the asset is experiencing upward pressure.
Moreover, the significant gap between the current price and the 200-day MA of $209.98 underscores a strong bullish trend over a longer period. This wide disparity indicates that the asset has sustained a robust gain over recent months, outperforming its longer-term average price level.
Overall, the asset’s current market positioning and its performance relative to these key moving averages suggest continued bullish sentiment, potentially encouraging investors to maintain or seek positions in anticipation of further upward movement.
Recent Ratings
| Date | Status | Outer | Rating | Price |
|---|---|---|---|---|
| 2025-07-10 00:00:00 | Initiated | Goldman | Buy | $276 |
| 2025-04-30 00:00:00 | Reiterated | TD Cowen | Buy | $185 → $210 |
| 2025-02-20 00:00:00 | Upgrade | Citigroup | Neutral → Buy | $210 → $290 |
| 2025-02-12 00:00:00 | Upgrade | Morgan Stanley | Equal-Weight → Overweight | $231 → $257 |
Lam Research Corp (LRCX) (2.82%)
Recent News (Last 24 Hours)
Recent news highlights significant developments in the semiconductor industry that could impact stock performance, particularly for Lam Research (LRCX). On October 8, 2025, Zacks released an article discussing whether it’s worthwhile to invest in Lam Research based on Wall Street’s bullish views, potentially indicating strong future performance for LRCX stock. Additionally, a comparative analysis by Zacks on the same day between LRCX and TSM (Taiwan Semiconductor Manufacturing Company) could influence investors’ decisions, depending on which stock is viewed as a better bet in the current market.
Moreover, geopolitical tensions are evident as U.S. lawmakers have criticized China for circumventing U.S. chip export rules and have called for broader bans on chipmaking tool sales to China. This situation, reported by Bloomberg and Reuters, could lead to increased regulatory scrutiny and potential market restrictions for companies like Lam Research, which may affect their sales and operational efficiency in key markets.
Furthermore, the overall semiconductor sector saw some stocks trading down, including Lam Research, as reported on October 7, 2025, by StockStory. This downturn could be a reaction to the broader industry challenges or market sentiments and warrants close monitoring for potential impacts on LRCX’s stock performance.
Investors should consider these factors and monitor upcoming Federal Open Market Committee (FOMC) meeting minutes and global market conditions to make informed decisions regarding their investments in semiconductor stocks like Lam Research.
Technical Analysis
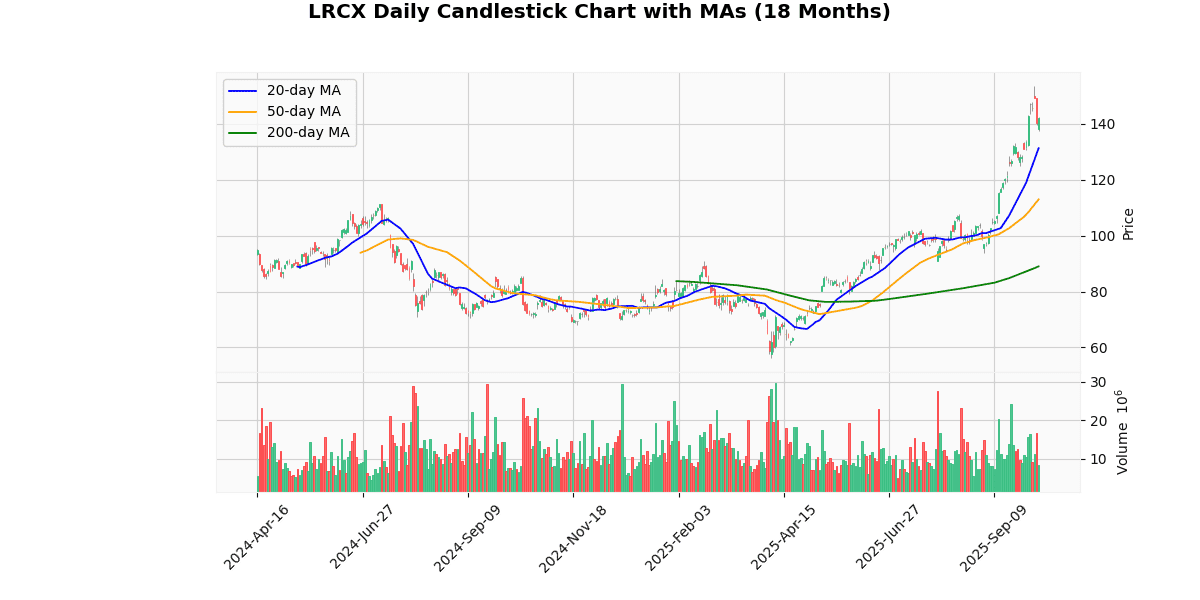
The current price of the asset at $141.97 indicates a strong upward trend when analyzed against its moving averages (MAs). The 20-day MA at $131.31, 50-day MA at $112.98, and 200-day MA at $89.01 all suggest a consistent bullish momentum over short, medium, and long-term periods. The significant gap between the current price and these MAs highlights robust investor confidence and potential ongoing price appreciation. The price being well above the 200-day MA particularly underscores a solid long-term uptrend, reinforcing the asset’s stability and attractiveness to investors looking for growth. Market positioning appears aggressive, with potential for continued upward movement given the current trajectory above all key moving averages. Investors should monitor for any signs of reversion but may find continued bullish signals in the current setup.
Recent Ratings
| Date | Status | Outer | Rating | Price |
|---|---|---|---|---|
| 2025-09-30 00:00:00 | Initiated | HSBC Securities | Hold | $127 |
| 2025-09-29 00:00:00 | Upgrade | Deutsche Bank | Hold → Buy | $150 |
| 2025-09-23 00:00:00 | Downgrade | KeyBanc Capital Markets | Overweight → Sector Weight | |
| 2025-09-22 00:00:00 | Upgrade | Morgan Stanley | Underweight → Equal-Weight | $125 |
Micron Technology Inc (MU) (2.63%)
Recent News (Last 24 Hours)
Micron Technology Inc. (MU) has seen an uptick in its stock performance, largely attributed to its recent expansion in the AI PC memory sector. This strategic move, as reported by Zacks, aims to position Micron at the forefront of the burgeoning AI technology market, potentially serving as a new growth engine for the company. The expansion could enhance Micron’s product offerings and market share in AI-related hardware, aligning with the broader resurgence in AI investments noted by MarketWatch. This resurgence is marked by a strong comeback in AI trading, reflecting heightened investor confidence in AI technologies and their application across various sectors.
The overall sentiment around AI technology firms remains robust, as indicated by Yahoo Finance Video reports, suggesting a sustained investor interest that could benefit companies like Micron that are expanding their AI capabilities. Given these developments, Micron’s stock could see continued investor interest, potentially leading to higher valuations if the AI market expansion continues as anticipated.
Technical Analysis
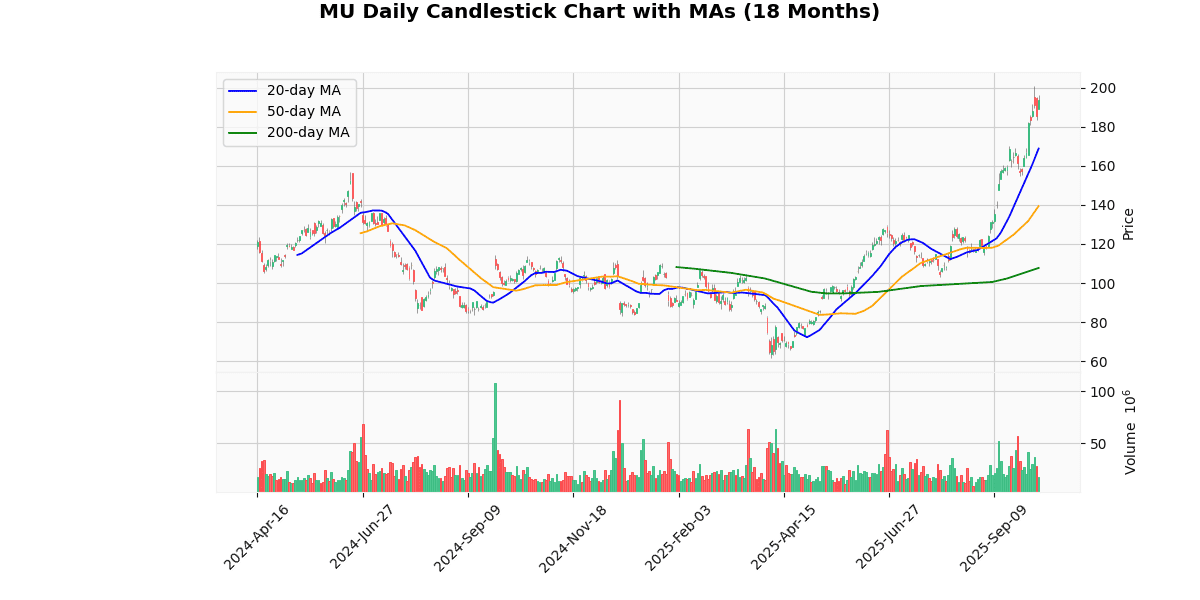
The current price of the asset at $193.58 demonstrates a robust upward trend when compared to its moving averages: 20-day MA at $168.82, 50-day MA at $139.37, and 200-day MA at $107.69. This significant premium above all three key moving averages indicates strong bullish momentum and investor confidence in the asset’s growth potential. The ascending order of the moving averages — with the shortest-term MA being the highest — further reinforces this positive trend, suggesting that the price has been consistently rising over both short and long-term periods. This pattern typically attracts more buying interest as the market perceives ongoing strength. Investors might view these metrics as a confirmation of a sustained upward trajectory, potentially leading to continued bullish market positioning in the near term.
Recent Ratings
| Date | Status | Outer | Rating | Price |
|---|---|---|---|---|
| 2025-10-08 | Reiterated | UBS | Buy | $195 → $225 |
| 2025-10-07 00:00:00 | Initiated | Itau BBA | Outperform | $249 |
| 2025-10-06 00:00:00 | Upgrade | Morgan Stanley | Equal-Weight → Overweight | $220 |
| 2025-09-24 00:00:00 | Reiterated | Wells Fargo | Overweight | $170 → $220 |
Worst 10 Performers
Warner Bros. Discovery Inc (WBD) (-4.70%)
Recent News (Last 24 Hours)
In recent financial news, Disney stock has experienced a significant surge, rising 23.1% over the past six months. Zacks Investment Research highlights three reasons to maintain holdings in Disney despite this rapid appreciation. This analysis suggests that investors might anticipate continued robust performance from Disney, potentially driven by strategic initiatives or strong market positioning that could further enhance shareholder value.
Additionally, Yahoo Finance Video covered top analyst calls impacting stocks such as E.l.f. Beauty, Warner Bros., and FedEx. These insights are crucial as they provide a broader view of market sentiments and specific factors influencing these companies’ stock movements. Analyst perspectives can often lead to short-term volatility based on their forecasts and recommendations, affecting investor behavior and stock prices.
Both pieces of news are vital for investors tracking market trends and individual stock performances, offering a blend of strategic hold advice for Disney and broader market analysis with implications for stocks like E.l.f. Beauty, Warner Bros., and FedEx.
Technical Analysis
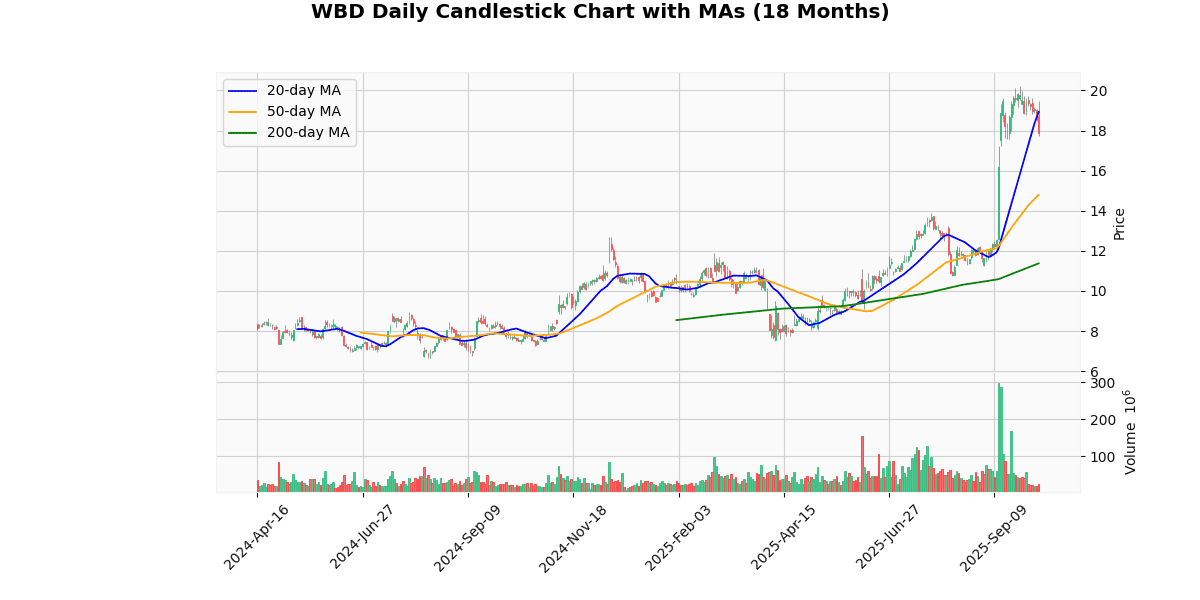
The current price of the asset at $17.79 shows a notable deviation from its short-term and long-term moving averages, indicating varied investor sentiment and potential volatility. The price is currently below the 20-day moving average (MA20) of $18.92, suggesting a recent downtrend or correction phase. However, it remains well above both the 50-day (MA50) at $14.79 and the 200-day (MA200) moving averages at $11.38, highlighting a strong medium to long-term upward trend.
This positioning above the longer-term averages but below the MA20 could suggest that while the longer-term outlook remains bullish, there may be short-term bearish pressure or consolidation. Investors might view the current dip as a buying opportunity, assuming the longer-term bullish trend will resume, but should remain cautious of potential continued short-term volatility.
Recent Ratings
| Date | Status | Outer | Rating | Price |
|---|---|---|---|---|
| 2025-09-26 00:00:00 | Downgrade | KeyBanc Capital Markets | Overweight → Sector Weight | |
| 2025-09-16 00:00:00 | Downgrade | TD Cowen | Buy → Hold | $14 |
| 2025-01-21 00:00:00 | Upgrade | MoffettNathanson | Neutral → Buy | $9 → $13 |
| 2024-11-11 00:00:00 | Upgrade | Wolfe Research | Underperform → Peer Perform |
Baker Hughes Co (BKR) (-2.21%)
Recent News (Last 24 Hours)
Baker Hughes Company (BKR) has been selected to provide liquefaction equipment for Sempra Infrastructure’s Port Arthur LNG Phase 2 project in Texas, as reported on October 8, 2025. This development is significant for Baker Hughes, as it underscores the company’s pivotal role in the expanding LNG sector and its capabilities in supplying critical infrastructure for major energy projects. The involvement in such a substantial project not only enhances Baker Hughes’ portfolio but also is likely to have positive implications for its financial performance, potentially increasing revenue streams and solidifying its market position in the energy sector. This strategic partnership with Sempra Infrastructure could also pave the way for future collaborations and opportunities in the LNG market, further bolstering Baker Hughes’ standing in the industry. Investors should monitor the progress of this project for its potential impact on Baker Hughes’ stock performance.
Technical Analysis
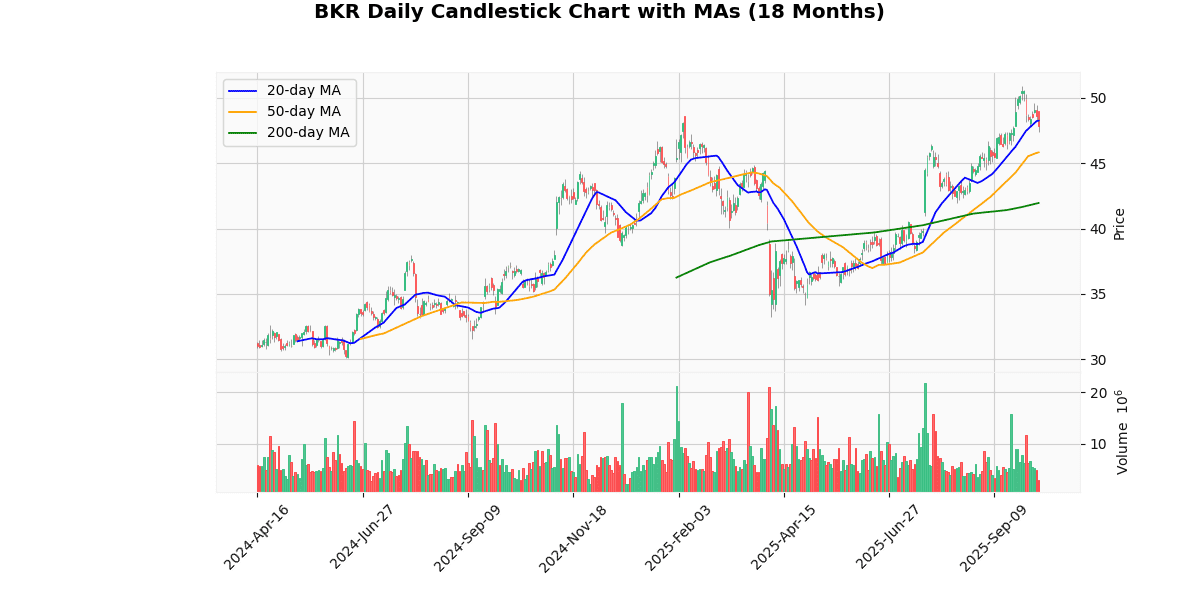
The current price of the asset stands at $47.85, which shows a slight deviation below the 20-day moving average (MA20) of $48.26, indicating a potential short-term bearish sentiment. However, when considering the longer-term moving averages, the price exhibits a bullish trend. It surpasses both the 50-day moving average (MA50) at $45.83 and significantly outperforms the 200-day moving average (MA200) at $41.96. This suggests that despite recent minor pullbacks, the overall momentum over the past months remains positive. The price positioning above both the MA50 and MA200 but below the MA20 could imply a consolidation phase in the short term, possibly preparing for the next directional move. Investors should monitor if the price can sustain above the MA50 to maintain the longer-term bullish outlook.
Recent Ratings
| Date | Status | Outer | Rating | Price |
|---|---|---|---|---|
| 2025-08-20 00:00:00 | Initiated | Melius | Buy | $60 |
| 2025-07-30 00:00:00 | Downgrade | Seaport Research Partners | Buy → Neutral | |
| 2025-07-24 00:00:00 | Reiterated | TD Cowen | Buy | $52 → $54 |
| 2025-04-24 00:00:00 | Reiterated | TD Cowen | Buy | $50 → $49 |
Costar Group Inc (CSGP) (-2.04%)
Technical Analysis
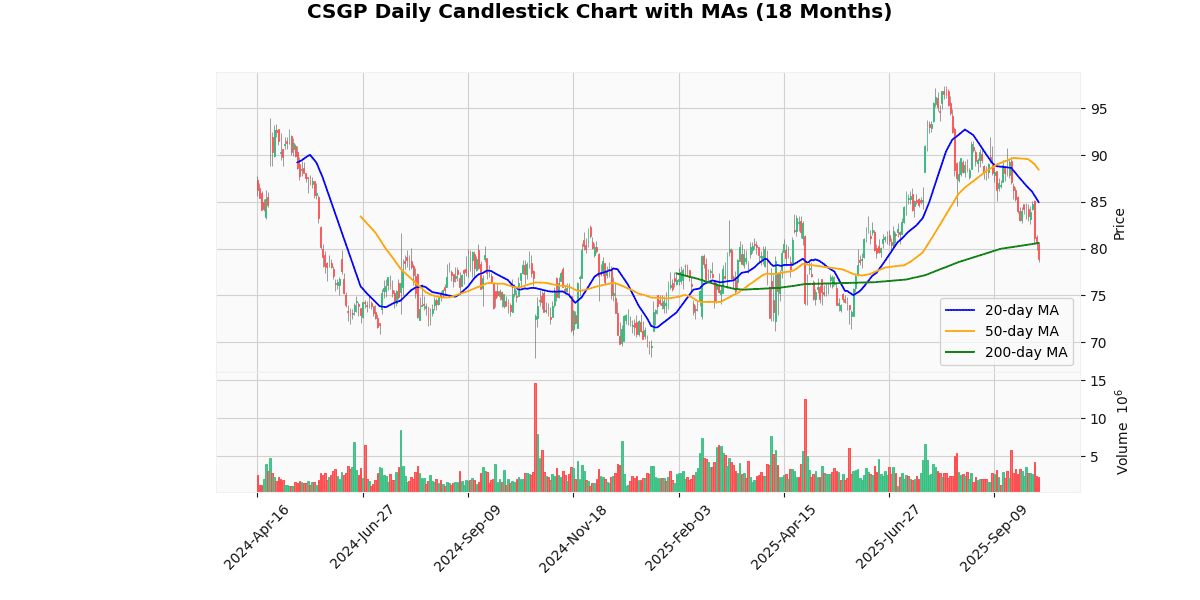
The current price of the asset at $78.79 indicates a bearish trend when analyzed against its moving averages. It is trading below the 20-day moving average (MA20) of $84.96, the 50-day moving average (MA50) of $88.44, and slightly below the 200-day moving average (MA200) of $80.59. This positioning suggests a short to medium-term downward trend as the price is consistently below both the MA20 and MA50, which are critical indicators of recent pricing trends and sentiment. The fact that the current price is also below the MA200, although by a narrower margin, reinforces the bearish outlook, indicating that the longer-term momentum could also be shifting downwards. Investors might view this as a potential signal for a cautious approach, considering the possibility of further declines or a stabilization period before any significant upward movement.
Recent Ratings
| Date | Status | Outer | Rating | Price |
|---|---|---|---|---|
| 2025-10-03 00:00:00 | Resumed | BTIG Research | Neutral | |
| 2025-09-03 00:00:00 | Initiated | Wolfe Research | Outperform | $105 |
| 2025-06-16 00:00:00 | Resumed | Stephens | Overweight | $105 |
| 2025-05-30 00:00:00 | Resumed | BofA Securities | Neutral | $79 |
Take-Two Interactive Software Inc (TTWO) (-2.03%)
Recent News (Last 24 Hours)
Electronic Arts (EA) has recently finalized a massive $55 billion acquisition deal, significantly impacting the gaming industry landscape. This strategic move, as reported by MarketBeat, is expected to enhance EA’s market positioning by potentially expanding its portfolio and leveraging new synergies, thereby creating a more robust competitive edge against other major players in the sector.
In parallel, Take-Two Interactive (TTWO) has shown notable market resilience and performance, as highlighted by Zacks. Despite a general market downturn, TTWO’s stock has ascended, which may be attributed to investor confidence in its stable revenue streams and innovative game offerings. This resilience in a falling market underscores TTWO’s strong operational fundamentals and might attract further investor interest.
Both developments are pivotal and are likely to influence stock valuations. EA’s expansion through acquisition could lead to increased investor confidence and a potential uptick in its stock price, assuming successful integration and synergy realization. Conversely, TTWO’s demonstrated stability and growth amidst market volatility could make it a more attractive investment, possibly leading to an enhanced valuation in the near term. Investors should monitor these dynamics closely as they could have significant implications for portfolio adjustments within the gaming and tech sectors.
Technical Analysis
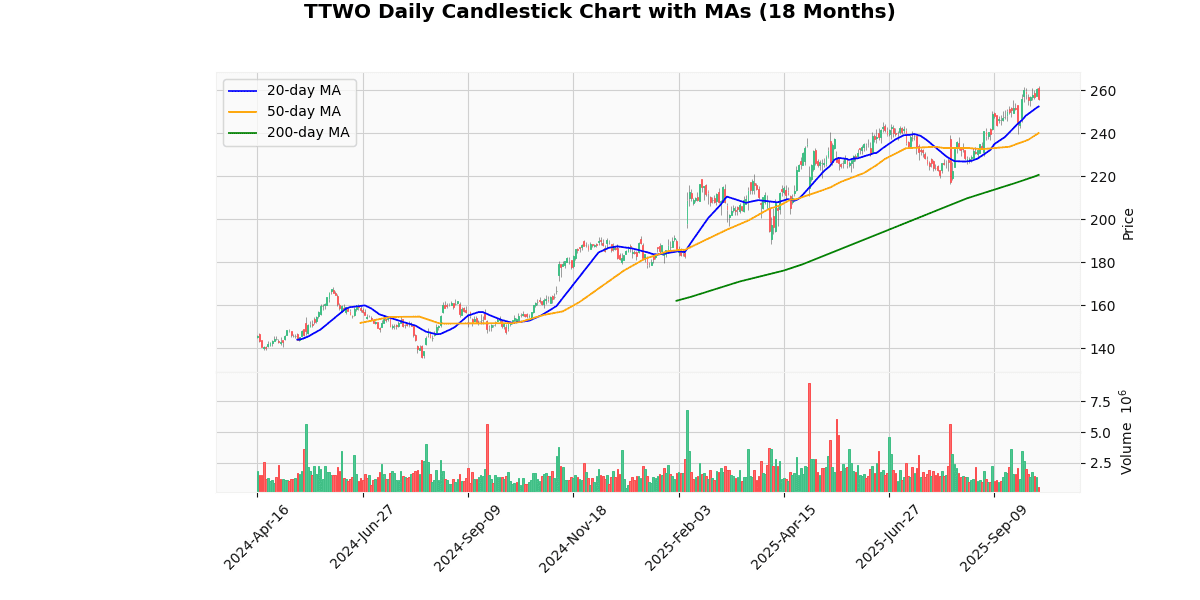
The current price of the asset at $256.18 is exhibiting a bullish trend when analyzed against its moving averages (MAs). It is positioned above the 20-day MA of $252.46, the 50-day MA of $240.12, and significantly higher than the 200-day MA of $220.62. This configuration suggests a strong upward momentum in the short, medium, and long term. The price standing above all three key MAs indicates robust buying interest and could signal continued bullish behavior in upcoming sessions. Investors might view the current positioning as a confirmation of a sustained positive trend, potentially attracting more buyers into the market. However, vigilance is advised as such trends could also prompt profit-taking, leading to possible price corrections. Overall, the market sentiment appears positive, with a potential for further gains if the upward trajectory maintains its course.
Recent Ratings
| Date | Status | Outer | Rating | Price |
|---|---|---|---|---|
| 2025-07-28 00:00:00 | Initiated | Wells Fargo | Overweight | $265 |
| 2025-02-19 00:00:00 | Initiated | DA Davidson | Buy | $250 |
| 2025-01-27 00:00:00 | Upgrade | UBS | Neutral → Buy | $175 → $230 |
| 2024-12-11 00:00:00 | Reiterated | Citigroup | Buy | $200 → $225 |
Strategy Inc (MSTR) (-1.80%)
Recent News (Last 24 Hours)
Recent news indicates significant movements and scrutiny within the cryptocurrency and tech sectors, which could impact investor sentiment and stock performance. Kerrisdale Capital has targeted Tom Lee’s Bitmine Immersion, a company specializing in cryptocurrency mining technology, as its newest short-sell focus. This development, reported by CoinDesk, could lead to increased volatility in Bitmine Immersion’s stock as market participants react to the negative report from a well-known short-seller.
In other news, Zacks has highlighted an optimistic outlook from Wall Street bulls regarding Strategy Inc. (MSTR), suggesting potential upward movement for MSTR’s stock based on current market strategies. This sentiment is supported by another Zacks report pointing out why MSTR is trending, which could influence investor decisions toward buying shares.
Additionally, Benzinga reported a breakout in Ethereum and BitMine, predicting significant price targets for ETH and BMNR. This could lead to increased investor interest in cryptocurrencies and related stocks, potentially benefiting companies involved in these sectors.
Lastly, Decrypt’s coverage of the largest publicly traded firms holding Solana in their treasuries could signal growing institutional acceptance of cryptocurrencies, possibly affecting stocks of companies invested in Solana.
Overall, these developments suggest a dynamic environment for tech and cryptocurrency-related stocks, with potential for both risk and reward influenced by market sentiment, short-seller activities, and broader financial trends.
Technical Analysis
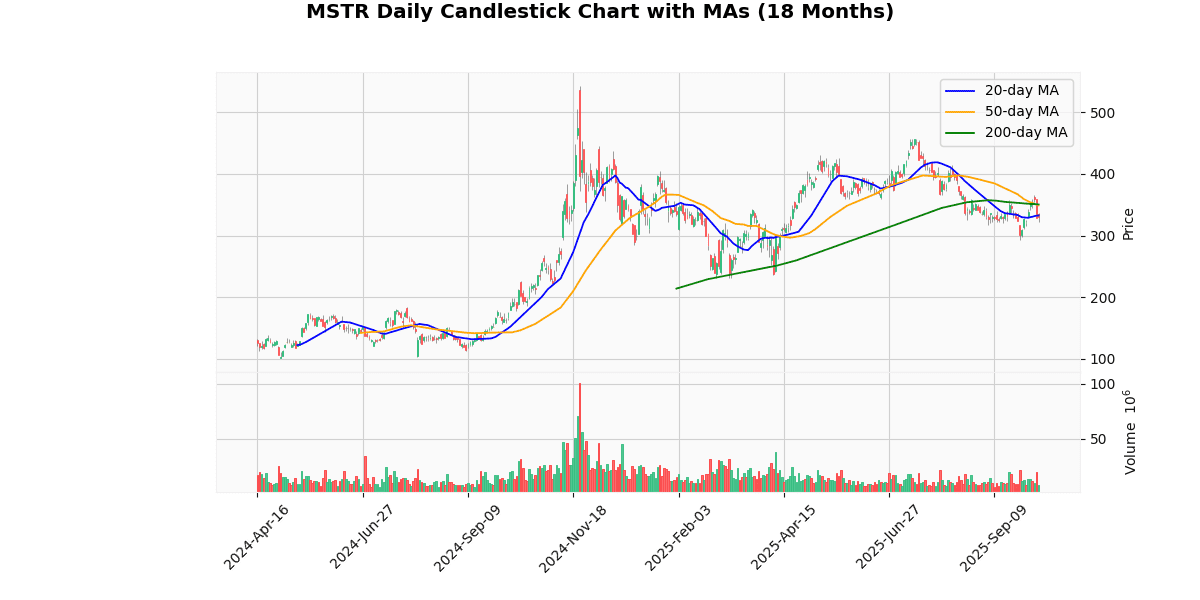
The current price of the asset at $330.64 reflects a downward trend when analyzed against its moving averages (MAs). The 20-day MA at $332.52 and the 50-day MA at $349.07, along with the 200-day MA at $350.42, all sit above the current price, indicating a bearish sentiment in the short to medium term. This positioning suggests that the asset has been underperforming recently and could be facing resistance at these higher moving average levels. The consistent decrease from the 200-day to the 20-day MA further underscores a potential decline in momentum. Investors might view these indicators as a sign of continued bearish pressure, potentially influencing strategies towards seeking defensive positions or awaiting clearer signs of reversal before committing to more aggressive buys.
Recent Ratings
| Date | Status | Outer | Rating | Price |
|---|---|---|---|---|
| 2025-07-15 00:00:00 | Reiterated | Monness Crespi & Hardt | Sell | $175 → $200 |
| 2025-04-29 00:00:00 | Initiated | H.C. Wainwright | Buy | $480 |
| 2025-04-01 00:00:00 | Downgrade | Monness Crespi & Hardt | Neutral → Sell | $220 |
| 2025-03-19 00:00:00 | Initiated | Monness Crespi & Hardt | Neutral |
Charter Communications Inc (CHTR) (-1.73%)
Recent News (Last 24 Hours)
Charter Communications, Inc. (NASDAQ: CHTR) has been featured prominently in recent financial news, indicating potential positive momentum for the company’s stock. Insider Monkey published an analysis presenting a bullish case for CHTR, suggesting that the company’s strategic positioning and operational strengths could drive its market performance. This analysis likely aligns with investor sentiment and could influence stock valuations positively.
Additionally, Charter’s Spectrum News service announced an expansion of its distribution to Xfinity TV customers, as reported by PR Newswire. This expansion could potentially increase Charter’s audience base and advertising revenue, further bolstering its financial outlook and attractiveness to investors.
Furthermore, another report by Insider Monkey highlighted Charter’s leadership in the U.S. connectivity market. This recognition underscores the company’s robust market presence and operational efficiency, which are critical factors that could enhance investor confidence and support a higher stock price.
Overall, these developments suggest a favorable impact on Charter Communications’ market perception and financial health, which could lead to an uptick in its stock performance in the near term.
Technical Analysis
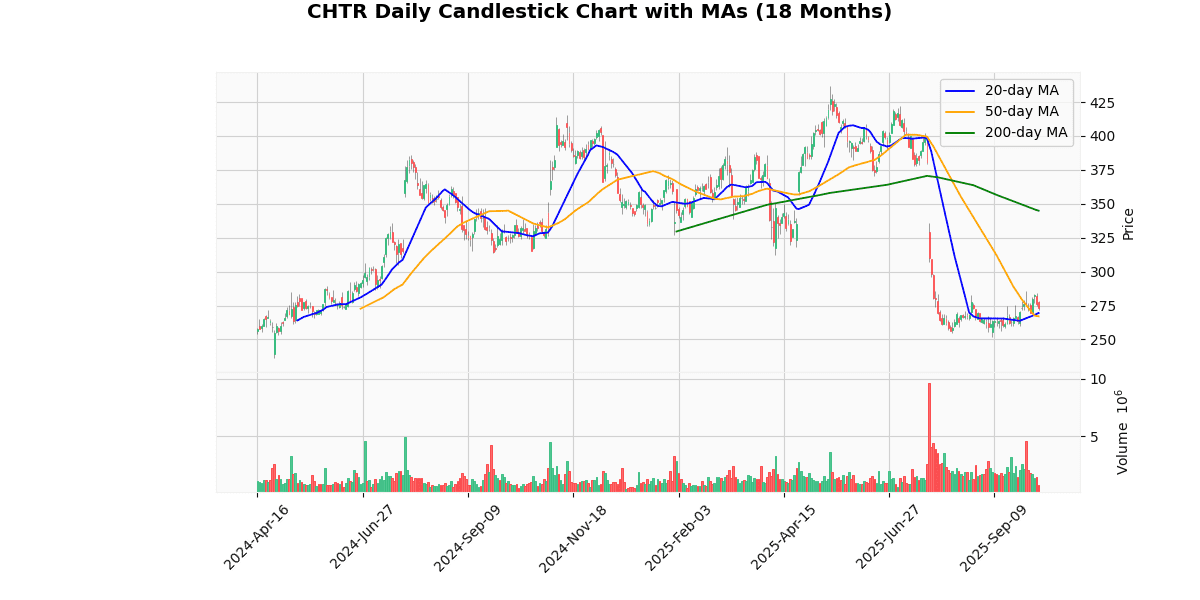
The current price of the asset at $272.57 is exhibiting a short-term upward trend as it stands above both the 20-day moving average (MA20) of $269.51 and the 50-day moving average (MA50) of $267.05. This positioning indicates a bullish sentiment in the near term, suggesting recent investor confidence and potential continued upward movement. However, the price remains significantly below the 200-day moving average (MA200) of $344.91, highlighting a longer-term bearish trend. This substantial disparity between the MA200 and the shorter-term moving averages may signal underlying weaknesses or a market correction phase that has not fully stabilized. Investors should monitor if the price can maintain its position above the MA20 and MA50 for potential consolidation or if it reverts towards the MA200, indicating a broader market reassessment.
Recent Ratings
| Date | Status | Outer | Rating | Price |
|---|---|---|---|---|
| 2025-10-06 00:00:00 | Resumed | Citigroup | Buy | $325 |
| 2025-09-02 00:00:00 | Resumed | Goldman | Sell | $223 |
| 2025-08-21 00:00:00 | Resumed | Wells Fargo | Equal Weight | $300 |
| 2025-07-28 00:00:00 | Upgrade | Bernstein | Mkt Perform → Outperform | $380 |
Autodesk Inc (ADSK) (-1.60%)
Recent News (Last 24 Hours)
In recent financial news, Autodesk, Inc. (NASDAQ: ADSK) has been spotlighted by several analysts and financial institutions. Notably, HSBC has upgraded Autodesk’s stock to “Buy” as of October 8, 2025, signaling a positive shift in market sentiment towards the company. This upgrade could potentially lead to increased investor confidence and a rise in stock price as market participants react to the endorsement from a major financial institution.
Additionally, a comparative review of Q2 performance between Autodesk and its peers in the design software sector was published on October 7, 2025, by StockStory. This analysis provides insights into Autodesk’s market position and operational performance relative to its competitors, which is crucial for investors making informed decisions.
Furthermore, a detailed analyst report from Morningstar Research, released on the same day, offers an in-depth evaluation of Autodesk’s financial health and business strategy. Such a report typically influences institutional investors’ perspectives and can affect the stock’s liquidity and volatility.
Overall, these developments suggest a potentially robust period for Autodesk in the stock market, contingent on broader market conditions and investor reactions to these analyses and upgrades.
Technical Analysis
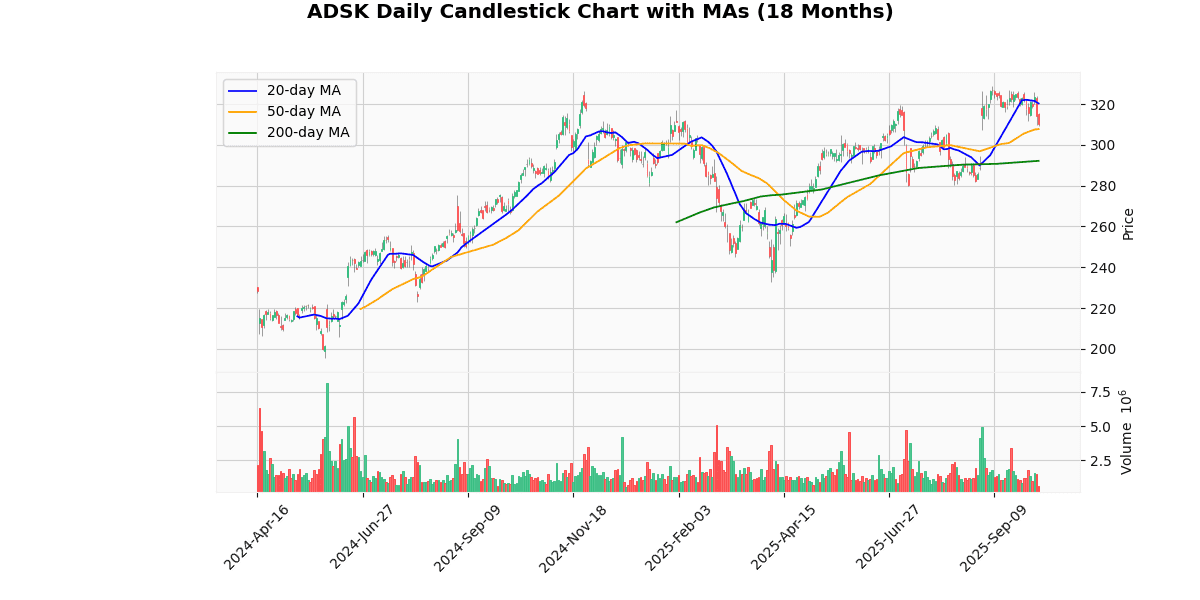
The current price of the asset at $309.95 is positioned between its 20-day and 50-day moving averages, indicating a potential consolidation phase in the short term. The 20-day moving average (MA20) at $320.34 suggests that the asset has recently experienced a downturn, as the current price is below this level. Conversely, the 50-day moving average (MA50) at $307.8, now below the current price, implies that the medium-term trend has been upward, supporting a bullish outlook as the price has moved above this average.
The 200-day moving average (MA200) at $292.21 further underscores a long-term bullish trend, as the current price is significantly above this marker. This could suggest sustained investor confidence over the longer term. Traders might watch for the asset’s behavior relative to its MA20 to gauge short-term directional cues, while the robust positioning above the MA50 and MA200 provides a bullish backdrop.
Recent Ratings
| Date | Status | Outer | Rating | Price |
|---|---|---|---|---|
| 2025-10-01 00:00:00 | Upgrade | HSBC Securities | Hold → Buy | $343 |
| 2025-07-21 00:00:00 | Initiated | Loop Capital | Hold | $320 |
| 2025-07-07 00:00:00 | Upgrade | DA Davidson | Neutral → Buy | $375 |
| 2025-06-27 00:00:00 | Upgrade | Berenberg | Hold → Buy | $365 |
Applovin Corp (APP) (-1.33%)
Recent News (Last 24 Hours)
Recent developments in the stock market, as reported by various sources, indicate a dynamic environment influenced by sector-specific news and broader economic indicators. Notably, a new report from Adjust highlighted the resilience in global mobile app demand, particularly in gaming, which could signal robust performance for tech companies involved in these sectors. This is particularly relevant for stocks like AppLovin, which was mentioned in multiple reports including its powerful rebound on Tuesday as covered by Motley Fool.
Further, the anticipation of the Federal Open Market Committee (FOMC) meeting minutes has led to a slight uptick in S&P futures, suggesting that investors are cautiously optimistic but are waiting for more definitive cues from the Federal Reserve regarding future monetary policy, which could have significant implications for market liquidity and interest rate-sensitive sectors.
Moreover, the daily movements of major stocks such as Tesla, AMD, Ford, and IBM, alongside AppLovin, as reported by Barrons.com and Yahoo Finance, reflect ongoing volatility and investor responsiveness to both corporate and external news, such as the disruption at Ford due to a plant fire. These movements underscore the interconnectedness of different sectors and the importance of staying informed about a broad range of factors that could impact stock performance.
Overall, the stock market currently presents a mixed but cautiously optimistic outlook, with specific opportunities in the tech and mobile app sectors, balanced by broader economic considerations influenced by upcoming federal economic policies.
Technical Analysis
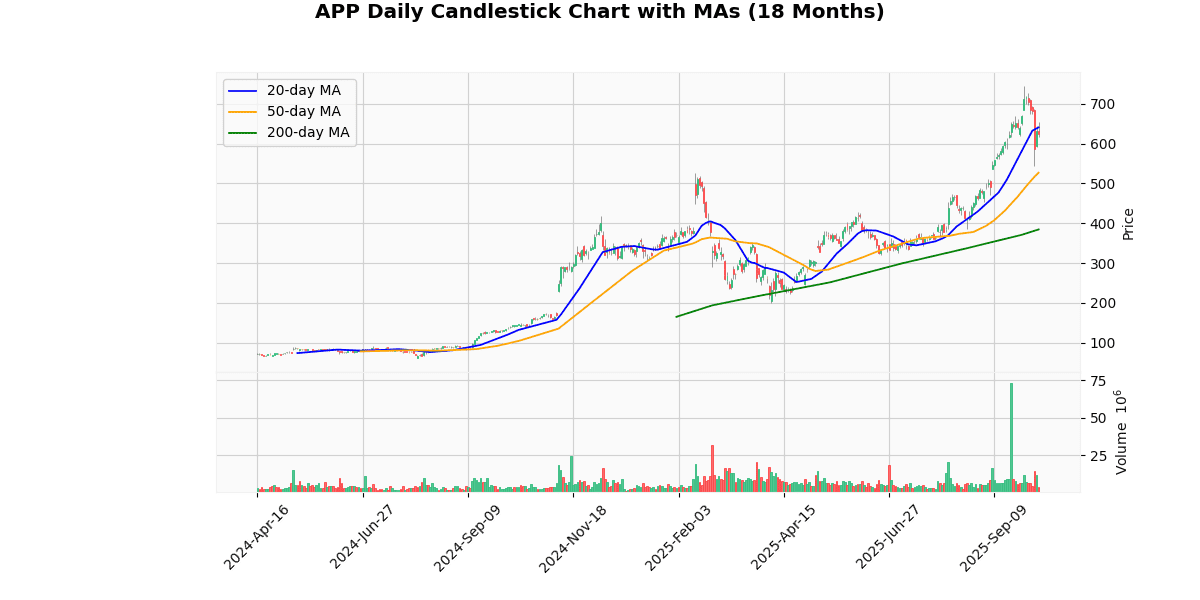
The current price of the asset at $624.72 indicates a recent downturn when compared to the 20-day moving average (MA20) of $640.97, suggesting a short-term bearish sentiment in the market. However, the price remains significantly higher than both the 50-day and 200-day moving averages, at $527.22 and $384.46 respectively. This indicates a strong bullish trend in the medium to long term. The substantial gap between the current price and the MA200 highlights robust price appreciation over a longer period. The proximity of the current price to the MA20, despite being lower, suggests that the price might be experiencing a temporary pullback rather than a reversal of the longer-term upward trend. Investors might view any further dips as buying opportunities, anticipating potential rebounds supported by the overall upward trajectory.
Recent Ratings
| Date | Status | Outer | Rating | Price |
|---|---|---|---|---|
| 2025-07-08 00:00:00 | Initiated | Scotiabank | Sector Outperform | $430 |
| 2025-04-10 00:00:00 | Upgrade | Morgan Stanley | Equal-Weight → Overweight | $350 |
| 2025-03-28 00:00:00 | Initiated | FBN Securities | Outperform | $385 |
| 2025-01-10 00:00:00 | Initiated | The Benchmark Company | Buy | $375 |
PepsiCo Inc (PEP) (-1.18%)
Recent News (Last 24 Hours)
In recent financial news, the stock market is showing positive movement with the Dow Jones Industrial Average on the rise as investors await a crucial Federal Reserve report. This anticipation affects market sentiment broadly, influencing major stocks such as Oracle and Tesla, which are currently seeking stability after recent fluctuations.
Coca-Cola has been highlighted for its performance over the past three months, raising questions among investors whether its current valuation is driven by genuine momentum or if it is becoming overpriced. This analysis could impact investor decisions regarding the beverage giant’s stock.
Additionally, PepsiCo is under the spotlight with upcoming Q3 earnings and recent commentary from Jim Cramer, describing the period as challenging for the company’s shareholders. The outcome of PepsiCo’s earnings report could significantly influence its stock price and investor sentiment, especially following Cramer’s critical remarks.
Moreover, Carlsberg’s strategic move to launch PepsiCo’s Poppi in the UK could have implications for both companies, potentially boosting PepsiCo’s market presence in Europe and impacting stock performance depending on the market’s reception of the new product.
Overall, these developments suggest a cautious but watchful approach from investors, as outcomes from earnings reports and Federal Reserve activities could dictate the next moves in the stock market.
Technical Analysis
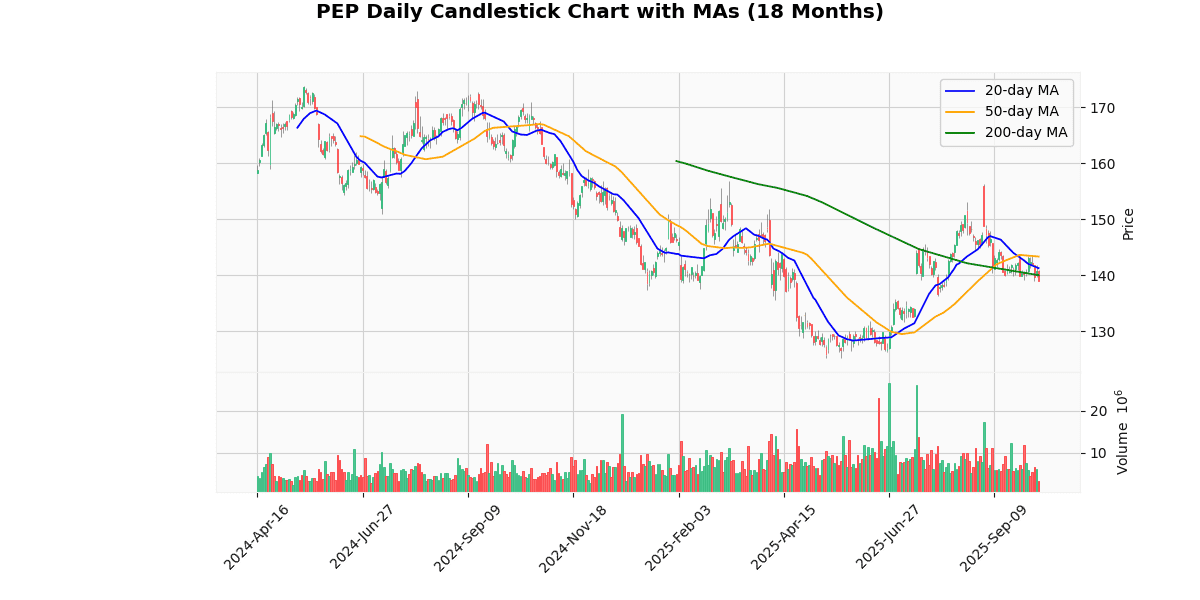
The current price of the asset at $138.87 indicates a bearish trend as it is positioned below all key moving averages: the 20-day MA at $141.25, the 50-day MA at $143.33, and the 200-day MA at $140.00. This alignment suggests that short-term, medium-term, and long-term momentum are all skewed towards a downward trajectory. The price being under the 20-day MA highlights recent negative sentiment and potential resistance around the $141.25 level. The significant gap below the 50-day and 200-day MAs further underscores a bearish outlook, indicating that the market could be adjusting to a lower trading range. Investors should monitor these levels for potential resistance if a price recovery occurs. However, the current setup may also attract bearish strategies or consideration of defensive positioning in the near term.
Recent Ratings
| Date | Status | Outer | Rating | Price |
|---|---|---|---|---|
| 2025-04-15 00:00:00 | Downgrade | BofA Securities | Buy → Neutral | $155 |
| 2025-03-18 00:00:00 | Downgrade | Barclays | Overweight → Equal Weight | $168 → $156 |
| 2025-03-12 00:00:00 | Downgrade | Jefferies | Buy → Hold | $171 → $170 |
| 2025-01-07 00:00:00 | Initiated | Piper Sandler | Overweight | $171 |
Booking Holdings Inc (BKNG) (-1.12%)
Recent News (Last 24 Hours)
In recent financial news, Booking Holdings (BKNG) experienced a notable decline, outpacing the broader market downturn as reported by Zacks on October 7, 2025. This drop could potentially signal concerns specific to the travel sector or internal company challenges, impacting investor sentiment and possibly affecting short-term stock performance.
Additionally, an OpenAI event, which was anticipated to bolster stocks of participating app makers, failed to meet expectations. According to Investor’s Business Daily, lingering concerns overshadowed the event, suggesting that the anticipated positive impact on these companies’ stocks did not materialize. This outcome could influence investor confidence in the tech sector, particularly in companies integrating or relying on AI technologies.
Furthermore, a report from StockStory highlighted a broader downtrend among various online platform stocks, including Booking, Upwork, Revolve, Expedia, and Cars.com. This collective decline might reflect wider market uncertainties or sector-specific issues, potentially leading to increased volatility or a reevaluation of stock valuations in these industries.
Investors should monitor these developments closely, as they could have significant implications for market dynamics and individual stock performances in the near term.
Technical Analysis
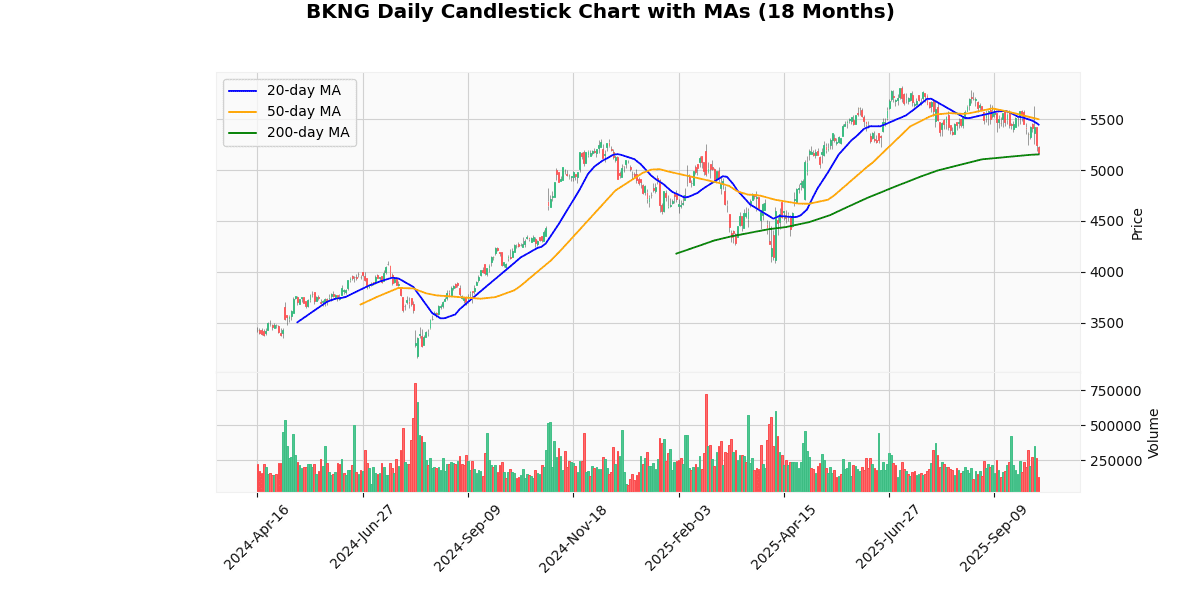
The current price of the asset stands at 5167.99, which indicates a recent downtrend as it is positioned below both the 20-day and 50-day moving averages (MA20 at 5446.24 and MA50 at 5499.23, respectively). This suggests a short-term bearish sentiment in the market, as prices have declined relative to these averages. However, the current price is slightly above the 200-day moving average (MA200 at 5154.08), which could imply that the longer-term trend remains bullish. The proximity of the current price to the MA200 also suggests a potential pivotal point; if the price sustains above this level, it may signal a stabilization and possible upturn in the longer-term trend. Conversely, a consistent drop below the MA200 could confirm a shift towards a longer-term bearish trend. Investors should monitor these levels closely for indications of the asset’s future direction.
Recent Ratings
| Date | Status | Outer | Rating | Price |
|---|---|---|---|---|
| 2025-09-30 00:00:00 | Initiated | Mizuho | Neutral | $5975 |
| 2025-08-05 00:00:00 | Upgrade | Erste Group | Hold → Buy | |
| 2025-07-30 00:00:00 | Downgrade | Wedbush | Outperform → Neutral | $5900 |
| 2025-04-04 00:00:00 | Upgrade | BTIG Research | Neutral → Buy | $5500 |
Disclaimer
The content on MarketsFN.com is provided for educational and informational purposes only. It does not constitute financial advice, investment recommendations, or trading guidance. All investments involve risks, and past performance does not guarantee future results. You are solely responsible for your investment decisions and should conduct independent research and consult a qualified financial advisor before acting. MarketsFN.com and its authors are not liable for any losses or damages arising from your use of this information.


