Bitcoin Dips Below $63.5K as RSI Nears Oversold Territory
· Crypto · QuoteReporter
Bitcoin Dips Below $63.5K as RSI Nears Oversold Territory
Bitcoin (BTC/USD) | July 28, 2026 $63,346.2383 -0.59%
🔍 Technical Analysis
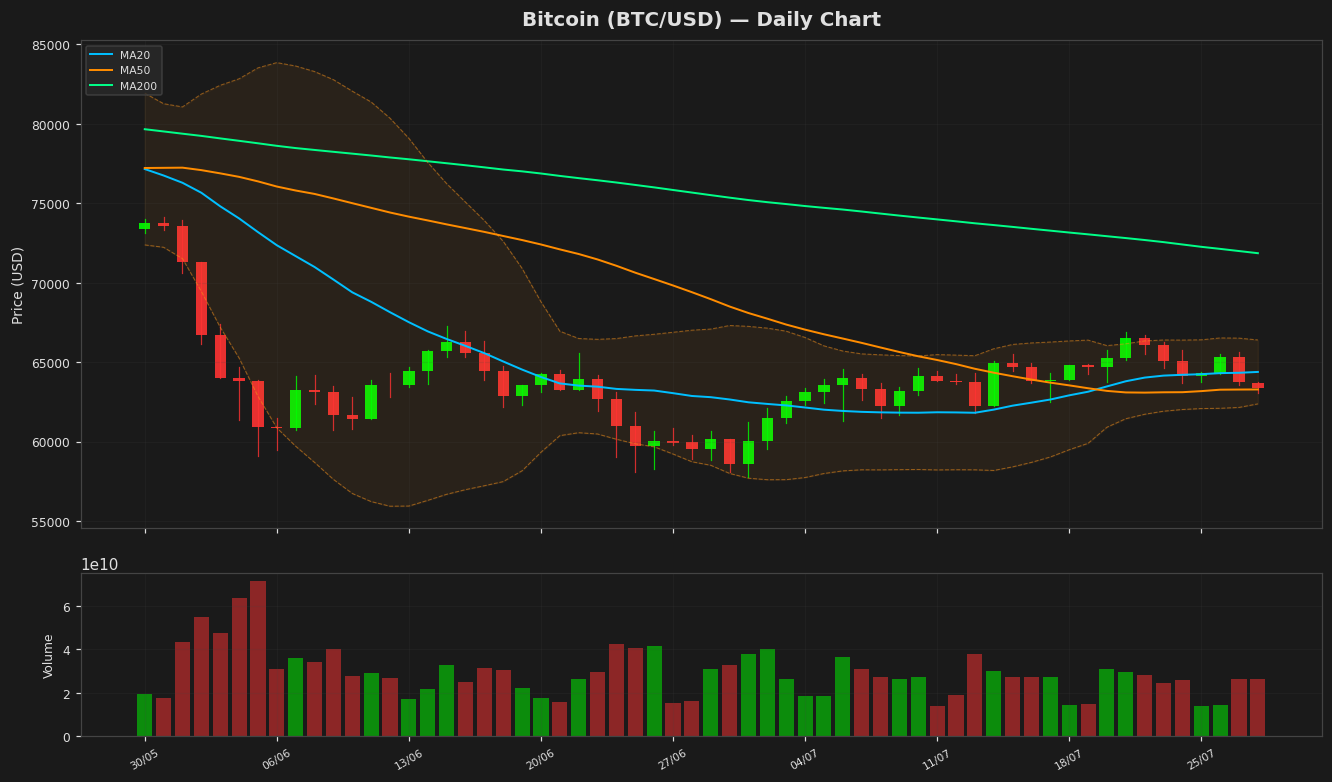
Bitcoin (BTC) is currently trading at $63,346, showing a slight daily decline of 0.59%. The price is hovering below the 20-day moving average (MA20) at $64,383 but remains above the 50-day moving average (MA50) at $63,279, indicating a neutral to slightly bearish short-term trend. The 200-day moving average (MA200) at $71,857 suggests a longer-term bearish bias as the price remains well below this level. Bollinger Bands show the upper band at $66,394 and the lower band at $62,372, with the price near the lower band, signaling potential oversold conditions. The Relative Strength Index (RSI) at 41.73 is in neutral territory, neither overbought nor oversold, but leaning toward weakening momentum. The MACD histogram shows a bearish crossover, with the MACD line at 210.69 below the signal line at 326.30, reinforcing short-term downside pressure. Key support levels to watch are $62,372 (Bollinger Lower Band) and $57,747 (52-week low), while resistance lies at $64,383 (MA20) and $66,394 (Bollinger Upper Band). The Average True Range (ATR) of 1,369 indicates moderate volatility. Bitcoin remains in a consolidation phase, with a break below $62,372 potentially triggering further downside, while a move above $66,394 could signal a bullish reversal.
Technical Metrics
| Metric | Value |
|---|---|
| Current Price | $63,346.2383 |
| Daily Change | -0.59% |
| MA 20 | $64,383.3400 |
| % from MA20 | -1.61% |
| MA 50 | $63,279.2285 |
| % from MA50 | +0.11% |
| MA 200 | $71,857.3820 |
| % from MA200 | -11.84% |
| BB Upper | $66,394.5965 |
| % from BB Upper | -4.59% |
| BB Lower | $62,372.0836 |
| % from BB Lower | +1.56% |
| RSI (14) | 41.73 |
| MACD | 210.691782 |
| MACD Signal | 326.300328 |
| ATR (14) | 1369.446429 |
| 3-Day High | $65,658.3359 |
| 3-Day Low | $63,058.6641 |
| 52-Week High | $97,860.6016 |
| % from 52W High | -35.27% |
| 52-Week Low | $57,747.7656 |
| % from 52W Low | +9.69% |
| YTD High | $97,860.6016 |
| % from YTD High | -35.27% |
| YTD Low | $57,747.7656 |
| % from YTD Low | +9.69% |
📊 Market Commentary
Bitcoin (BTC) is currently trading at $63,346.2383, down 0.59% on the day, as the market shows signs of consolidation following recent volatility. The Relative Strength Index (RSI) at 41.7 suggests BTC is approaching oversold territory but remains in neutral ground, indicating neither strong buying nor selling pressure at present. Over the past 52 weeks, Bitcoin has fluctuated between $57,747.7656 and $97,860.6016, reflecting the broader crypto market’s swings amid macroeconomic uncertainty and shifting risk appetite.
Market sentiment appears cautious, with traders closely monitoring key support and resistance levels. The $60,000 psychological level remains a critical zone to watch, as a sustained break below could trigger further downside toward the yearly low near $57,700. On the upside, resistance near $65,000 has capped recent rallies, and a move above this level could signal renewed bullish momentum.
Traders are also paying attention to macroeconomic factors, including inflation data and central bank policy, which continue to influence crypto markets alongside traditional assets. Bitcoin’s correlation with equities, particularly tech stocks, remains a focal point. Additionally, on-chain metrics such as exchange flows and whale activity are being scrutinized for signs of accumulation or distribution. While the near-term trend lacks clear direction, the current price action suggests a period of indecision as the market awaits catalysts for the next major move.
Market sentiment appears cautious, with traders closely monitoring key support and resistance levels. The $60,000 psychological level remains a critical zone to watch, as a sustained break below could trigger further downside toward the yearly low near $57,700. On the upside, resistance near $65,000 has capped recent rallies, and a move above this level could signal renewed bullish momentum.
Traders are also paying attention to macroeconomic factors, including inflation data and central bank policy, which continue to influence crypto markets alongside traditional assets. Bitcoin’s correlation with equities, particularly tech stocks, remains a focal point. Additionally, on-chain metrics such as exchange flows and whale activity are being scrutinized for signs of accumulation or distribution. While the near-term trend lacks clear direction, the current price action suggests a period of indecision as the market awaits catalysts for the next major move.
Disclaimer
The content on MarketsFN.com is provided for educational and informational purposes only. It does not constitute financial advice or investment recommendations. All investments involve risk. Cryptocurrency markets are highly volatile. Past performance does not guarantee future results.