Bitcoin Dips to $65.9K as RSI Holds at 66.5
· Crypto · QuoteReporter
Bitcoin Dips to $65.9K as RSI Holds at 66.5
Bitcoin (BTC/USD) | July 22, 2026 $65,933.5234 -0.86%
🔍 Technical Analysis
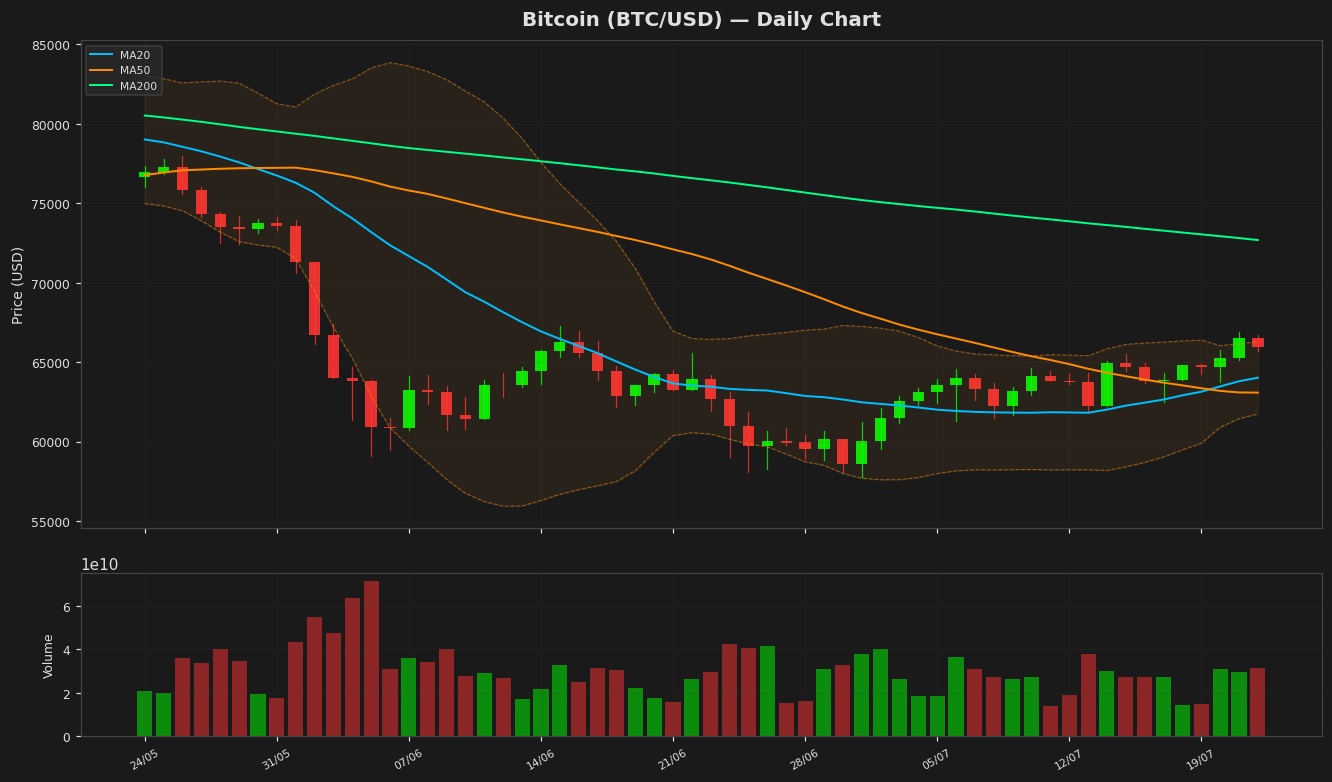
Bitcoin (BTC) is currently trading at $65,933.52, showing a slight daily decline of 0.86%. The price remains above both the 20-day MA ($64,018.17) and the 50-day MA ($63,077.27), indicating short-term bullish momentum. However, the 200-day MA ($72,686.58) suggests a longer-term bearish trend as the price remains below this key level. The Bollinger Bands show the upper band at $66,296.61 and the lower band at $61,739.73, with the price hovering near the upper band, signaling potential overbought conditions. The RSI(14) stands at 66.50, approaching the overbought threshold of 70 but not yet indicating extreme conditions. The MACD histogram shows a bullish crossover with the MACD line (584.07) above the signal line (201.32), reinforcing positive momentum. Key support levels are seen near the 20-day and 50-day MAs, while resistance lies around the YTD high of $97,860.60 and the 52-week high of $104,005.49. The ATR(14) of 1,485.94 reflects moderate volatility. Bitcoin’s ability to hold above the 20-day MA will be crucial for maintaining bullish sentiment, while a break below could test lower support levels.
Technical Metrics
| Metric | Value |
|---|---|
| Current Price | $65,933.5234 |
| Daily Change | -0.86% |
| MA 20 | $64,018.1670 |
| % from MA20 | +2.99% |
| MA 50 | $63,077.2745 |
| % from MA50 | +4.53% |
| MA 200 | $72,686.5797 |
| % from MA200 | -9.29% |
| BB Upper | $66,296.6087 |
| % from BB Upper | -0.55% |
| BB Lower | $61,739.7253 |
| % from BB Lower | +6.79% |
| RSI (14) | 66.50 |
| MACD | 584.070548 |
| MACD Signal | 201.316907 |
| ATR (14) | 1485.936942 |
| 3-Day High | $66,910.0625 |
| 3-Day Low | $63,720.3906 |
| 52-Week High | $104,005.4922 |
| % from 52W High | -36.61% |
| 52-Week Low | $57,747.7656 |
| % from 52W Low | +14.18% |
| YTD High | $97,860.6016 |
| % from YTD High | -32.63% |
| YTD Low | $57,747.7656 |
| % from YTD Low | +14.18% |
📊 Market Commentary
Bitcoin (BTC) is currently trading at $65,933.52, down 0.86% over the past 24 hours amid mixed market sentiment. The Relative Strength Index (RSI) at 66.5 suggests BTC is approaching overbought territory but still has room for upward momentum before hitting extreme levels. The 52-week range of $57,747.77 to $104,005.49 highlights the volatile nature of Bitcoin, with the current price sitting closer to the lower bound, reflecting a cautious but not bearish market stance.
Traders are closely monitoring key support and resistance levels. Immediate support lies near $64,000, a psychological and technical level that has held in recent weeks. A break below this could test the $60,000 zone, which aligns with the lower end of the 52-week range. On the upside, resistance is seen around $68,000, followed by the $70,000 mark, a critical barrier that has capped rallies multiple times this year.
Market sentiment remains divided, with some investors viewing the current consolidation as a healthy pause before another leg higher, while others remain cautious due to macroeconomic uncertainties, including Fed policy and inflation concerns. Trading volumes have been moderate, indicating neither strong accumulation nor distribution. Institutional interest, as seen through ETF flows, continues to play a significant role in price dynamics. For now, traders are watching for a decisive breakout above $68,000 or a breakdown below $64,000 to gauge the next directional move.
Traders are closely monitoring key support and resistance levels. Immediate support lies near $64,000, a psychological and technical level that has held in recent weeks. A break below this could test the $60,000 zone, which aligns with the lower end of the 52-week range. On the upside, resistance is seen around $68,000, followed by the $70,000 mark, a critical barrier that has capped rallies multiple times this year.
Market sentiment remains divided, with some investors viewing the current consolidation as a healthy pause before another leg higher, while others remain cautious due to macroeconomic uncertainties, including Fed policy and inflation concerns. Trading volumes have been moderate, indicating neither strong accumulation nor distribution. Institutional interest, as seen through ETF flows, continues to play a significant role in price dynamics. For now, traders are watching for a decisive breakout above $68,000 or a breakdown below $64,000 to gauge the next directional move.
Disclaimer
The content on MarketsFN.com is provided for educational and informational purposes only. It does not constitute financial advice or investment recommendations. All investments involve risk. Cryptocurrency markets are highly volatile. Past performance does not guarantee future results.