Bitcoin Eyes $67K as RSI Nears Overbought at 62.8
· Crypto · QuoteReporter
Bitcoin Eyes $67K as RSI Nears Overbought at 62.8
Bitcoin (BTC/USD) | July 21, 2026 $66,175.2812 +1.45%
🔍 Technical Analysis
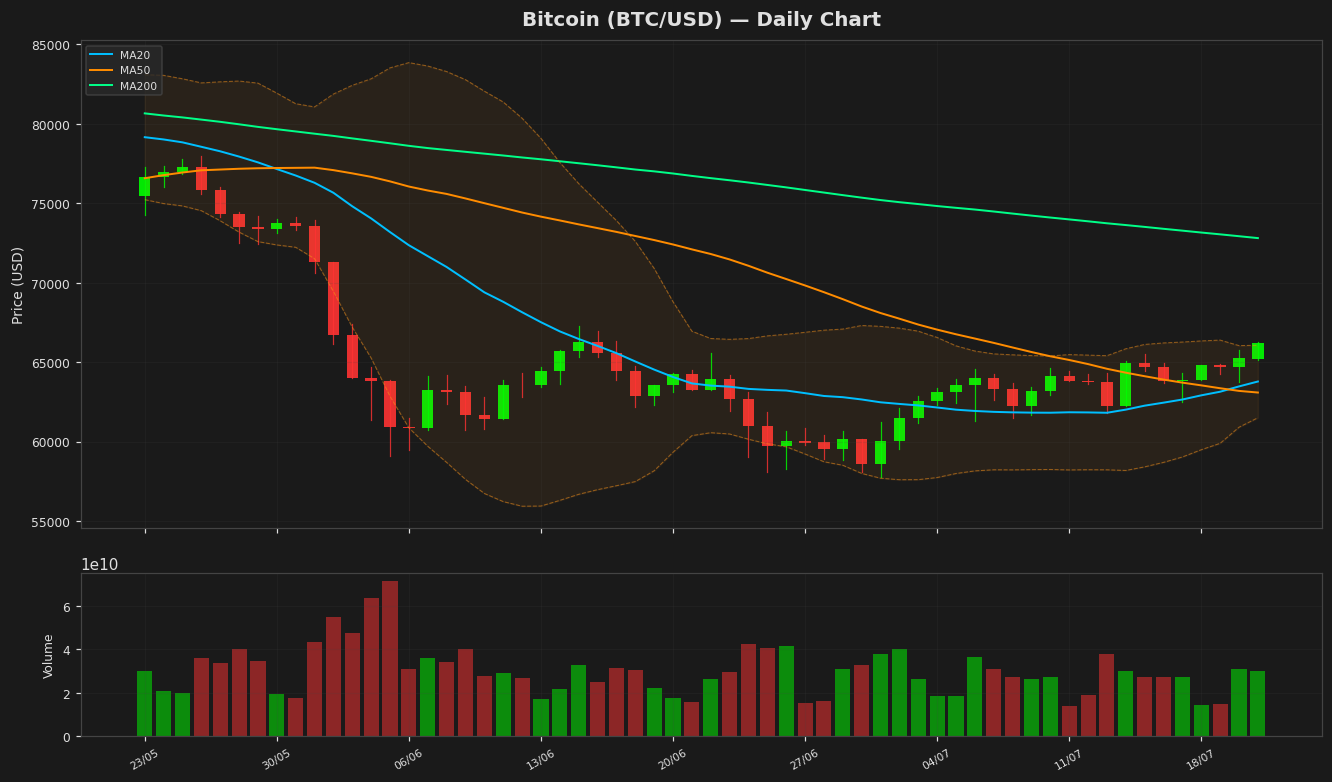
Bitcoin is currently trading at $66,175, showing a modest daily gain of 1.45%. The price remains above both the 20-day MA ($63,779) and the 50-day MA ($63,086), indicating short-term bullish momentum, though it still lags below the 200-day MA ($72,808), suggesting longer-term resistance remains a challenge. The Bollinger Bands show the upper band at $66,061 and the lower band at $61,497, with price hovering near the upper band, signaling potential overbought conditions or a continuation of the uptrend if volatility expands. The RSI at 62.75 is in neutral territory, neither overbought nor oversold, leaving room for further upward movement. The MACD histogram at 478.27 remains above the signal line (100.36), reinforcing bullish momentum. Key support levels to watch are $63,000 (20/50 MA confluence) and $61,500 (Bollinger lower band), while resistance lies at $66,000 (upper band) and the psychological $70,000 level. The ATR of 1,527 suggests moderate volatility, typical of Bitcoin’s recent consolidation phase. Year-to-date, BTC remains below its YTD high of $97,860, but well above its 52-week low of $57,747, reflecting a recovery trend with room for further upside if key resistances are breached.
Technical Metrics
| Metric | Value |
|---|---|
| Current Price | $66,175.2812 |
| Daily Change | +1.45% |
| MA 20 | $63,779.2637 |
| % from MA20 | +3.76% |
| MA 50 | $63,086.0803 |
| % from MA50 | +4.90% |
| MA 200 | $72,808.2788 |
| % from MA200 | -9.11% |
| BB Upper | $66,061.0988 |
| % from BB Upper | +0.17% |
| BB Lower | $61,497.4285 |
| % from BB Lower | +7.61% |
| RSI (14) | 62.76 |
| MACD | 478.273595 |
| MACD Signal | 100.366033 |
| ATR (14) | 1527.904576 |
| 3-Day High | $66,291.3438 |
| 3-Day Low | $63,720.3906 |
| 52-Week High | $105,297.2344 |
| % from 52W High | -37.15% |
| 52-Week Low | $57,747.7656 |
| % from 52W Low | +14.59% |
| YTD High | $97,860.6016 |
| % from YTD High | -32.38% |
| YTD Low | $57,747.7656 |
| % from YTD Low | +14.59% |
📊 Market Commentary
Bitcoin (BTC) is currently trading at $66,175.28, up 1.45% today, as the market shows cautious optimism amid mixed signals. The Relative Strength Index (RSI) at 62.8 suggests BTC is approaching overbought territory but still has room for upward momentum before hitting the 70 threshold that typically signals overheating. Over the past 52 weeks, Bitcoin has fluctuated between $57,747.77 and $105,297.23, reflecting the volatile nature of the asset.
Market sentiment appears cautiously bullish, supported by steady inflows into spot Bitcoin ETFs and renewed institutional interest. However, traders remain watchful for macroeconomic cues, particularly Federal Reserve policy shifts and inflation data, which could influence risk appetite. Key resistance levels to monitor include $68,000, a psychological barrier that, if broken, could pave the way for a retest of $70,000. On the downside, support lies near $64,000, followed by the critical $60,000 zone, which has acted as a strong floor in recent weeks.
Traders are also eyeing Bitcoin’s correlation with traditional markets, particularly equities, as well as on-chain metrics like exchange reserves and whale activity. A sustained move above the RSI’s mid-60s level could attract more buyers, while failure to hold current gains may trigger profit-taking. For now, Bitcoin remains in a consolidation phase, with the market awaiting clearer directional cues.
Market sentiment appears cautiously bullish, supported by steady inflows into spot Bitcoin ETFs and renewed institutional interest. However, traders remain watchful for macroeconomic cues, particularly Federal Reserve policy shifts and inflation data, which could influence risk appetite. Key resistance levels to monitor include $68,000, a psychological barrier that, if broken, could pave the way for a retest of $70,000. On the downside, support lies near $64,000, followed by the critical $60,000 zone, which has acted as a strong floor in recent weeks.
Traders are also eyeing Bitcoin’s correlation with traditional markets, particularly equities, as well as on-chain metrics like exchange reserves and whale activity. A sustained move above the RSI’s mid-60s level could attract more buyers, while failure to hold current gains may trigger profit-taking. For now, Bitcoin remains in a consolidation phase, with the market awaiting clearer directional cues.
Disclaimer
The content on MarketsFN.com is provided for educational and informational purposes only. It does not constitute financial advice or investment recommendations. All investments involve risk. Cryptocurrency markets are highly volatile. Past performance does not guarantee future results.