Brent Oil Declines 0.2%
· Commodities · QuoteReporter
Brent Oil Declines 0.2%
Analysis Date: May 14, 2026
📊 Current Market Data
CURRENT PRICE
$105.37
DAILY CHANGE
-0.25%
WEEKLY CHANGE
+5.31%
52W HIGH
$126.10
52W LOW
$58.72
💡 Key Market Factors
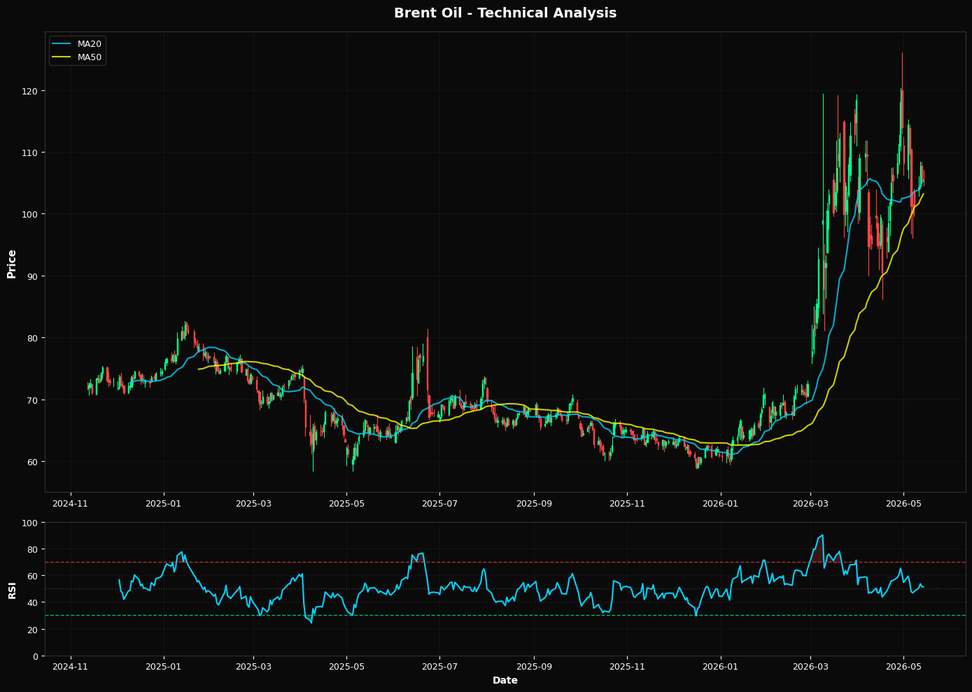
Brent oil prices have recently experienced a notable weekly increase of 5.31%, indicating a bullish trend. This upward movement is supported by the price trading above both the 20-day and 50-day moving averages, which are currently at $105.31 and $103.21, respectively. The Relative Strength Index (RSI) is at 51.3, suggesting that the market is neither overbought nor oversold, providing room for further price movements in either direction. From a macroeconomic perspective, the Federal Reserve's interest rate policy remains a critical factor influencing oil prices. With the Fed maintaining a cautious stance on rate hikes due to persistent inflationary pressures, the cost of borrowing remains relatively high, which can dampen economic growth and, consequently, oil demand. However, any indication of a pause or reduction in rate hikes could provide additional support to oil prices by improving economic activity and increasing energy consumption. Geopolitical tensions, particularly in major oil-producing regions, continue to play a significant role in shaping Brent oil prices. While no new major geopolitical events have been reported recently, ongoing conflicts and sanctions can disrupt supply chains, contributing to price volatility. Market participants should remain vigilant of any developments in these areas, as they can have immediate and significant impacts on oil supply and pricing. Technically, Brent oil is hovering near the 38.2% Fibonacci retracement level at $100.36, which could act as a support level in the event of a price pullback. The proximity of the current price to this Fibonacci level suggests potential consolidation or a corrective move if the bullish momentum weakens. Traders should monitor these technical indicators closely to gauge potential entry and exit points.📈 Technical Indicators Summary
RSI (14)
51.3
50-Day MA
$103.21
200-Day MA
$75.14
Fib Level
38.2%
📊 Technical Analysis Chart (18-Month View)
📐 Fibonacci Retracement Analysis
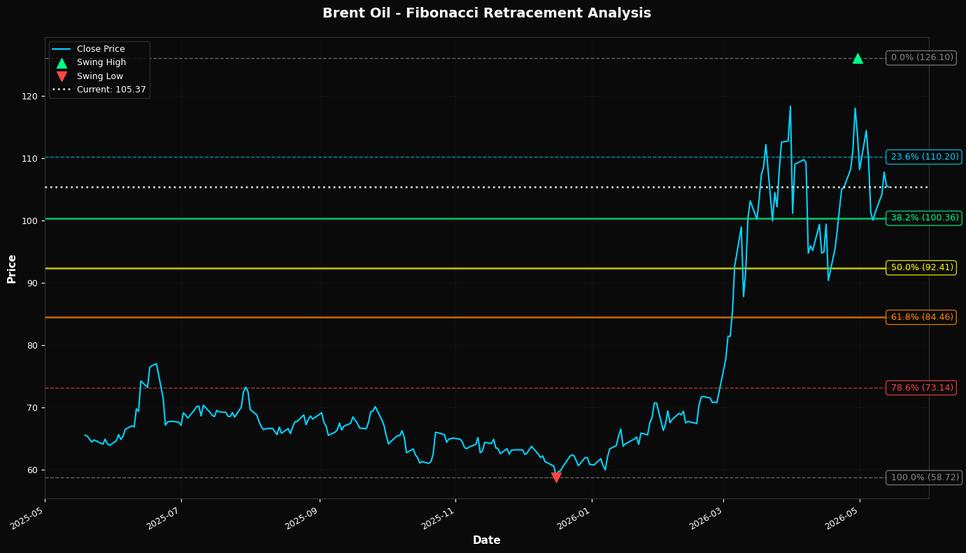
🎯 Key Trading Levels
Key Fibonacci Levels:
- 38.2%: $100.36
- 50.0%: $92.41
- 61.8%: $84.46
Support: $58.72 (Swing Low), $103.21 (50-Day MA)
Resistance: $126.10 (Swing High)
Disclaimer
The content on MarketsFN.com is provided for educational and informational purposes only. It does not constitute financial advice, investment recommendations, or trading guidance. All investments involve risks, and past performance does not guarantee future results. You are solely responsible for your investment decisions and should conduct independent research and consult a qualified financial advisor before acting. MarketsFN.com and its authors are not liable for any losses or damages arising from your use of this information.