Brent Oil Declines 0.3% near 38.2% Fibonacci resistance
· Commodities · MarketsFN Team
Brent Oil Declines 0.3% near 38.2% Fibonacci resistance
Analysis Date: May 07, 2026
📊 Current Market Data
CURRENT PRICE
$100.94
DAILY CHANGE
-0.33%
WEEKLY CHANGE
-11.46%
52W HIGH
$126.10
52W LOW
$58.72
💡 Key Market Factors
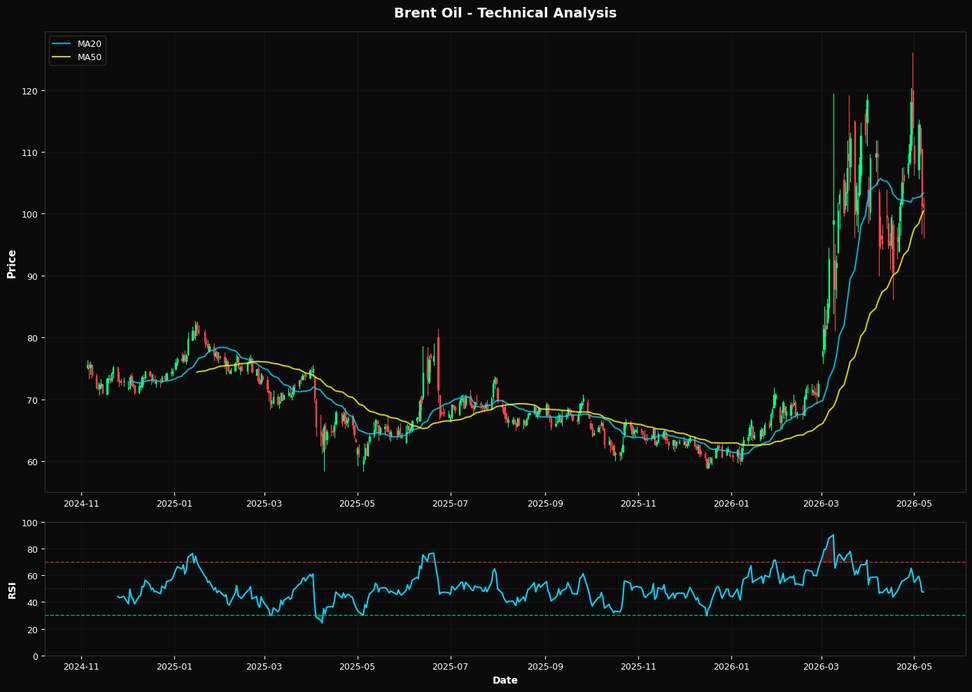
Brent oil prices have recently experienced a sharp decline, with a weekly change of -11.46%, suggesting a significant shift in market sentiment. This downturn is partly influenced by expectations of persistent inflationary pressures, which could dampen demand as central banks, particularly the Federal Reserve, may maintain higher interest rates for an extended period to combat inflation. The prospect of elevated borrowing costs could suppress economic activity and, consequently, oil demand. On the geopolitical front, there are currently no major new developments significantly impacting Brent oil supply or demand. However, ongoing tensions in the Middle East and potential disruptions in major oil-producing regions remain a background risk that could quickly alter market dynamics. Technically, Brent oil is trading below its 20-day moving average of $103.33, indicating a bearish short-term trend, while it hovers around its 50-day moving average of $100.42, which may act as a pivot point. The RSI at 47.5 suggests a neutral momentum, but the proximity to the Fibonacci 38.2% level at $100.36 could provide immediate support. A break below this level might see further downside pressure, while resistance is likely near the 20-day moving average.📈 Technical Indicators Summary
RSI (14)
47.5
50-Day MA
$100.42
200-Day MA
$74.27
Fib Level
38.2%
📊 Technical Analysis Chart (18-Month View)
📐 Fibonacci Retracement Analysis
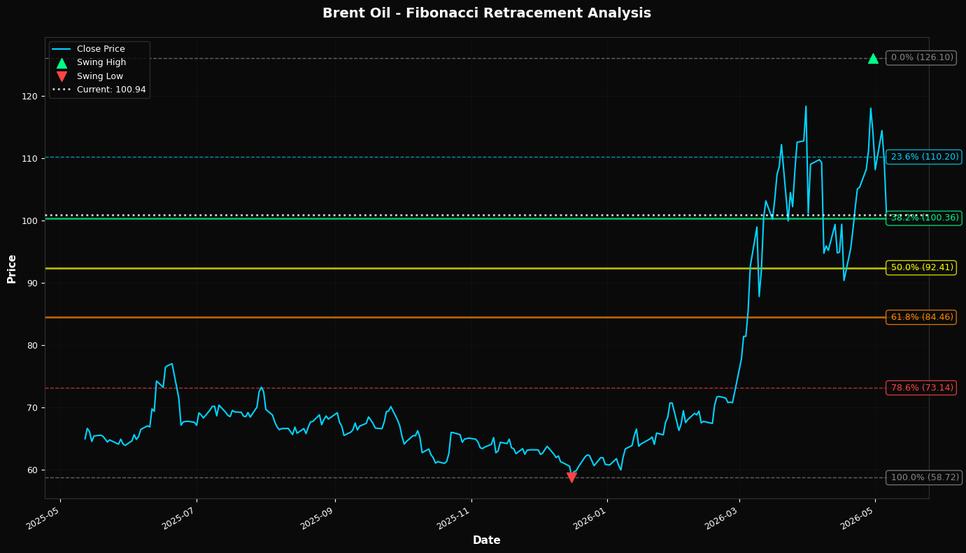
🎯 Key Trading Levels
Key Fibonacci Levels:
- 38.2% Level: $100.36
- 50.0% Level: $92.41
- 61.8% Level: $84.46
Support: $58.72 (Swing Low), $100.42 (50-day MA)
Resistance: $126.10 (Swing High)
Disclaimer
The content on MarketsFN.com is provided for educational and informational purposes only. It does not constitute financial advice, investment recommendations, or trading guidance. All investments involve risks, and past performance does not guarantee future results. You are solely responsible for your investment decisions and should conduct independent research and consult a qualified financial advisor before acting. MarketsFN.com and its authors are not liable for any losses or damages arising from your use of this information.