Brent Oil: Down 0.3% to $79.63 — Oversold at RSI 30 — Watching for Bounce
· Commodities · QuoteReporter
Brent Oil: Down 0.3% to $79.63 — Oversold at RSI 30 — Watching for Bounce
Analysis Date: June 19, 2026
📊 Current Market Data
CURRENT PRICE
$79.63
DAILY CHANGE
-0.28%
WEEKLY CHANGE
-8.82%
52W HIGH
$126.10
52W LOW
$58.72
💡 Key Market Factors
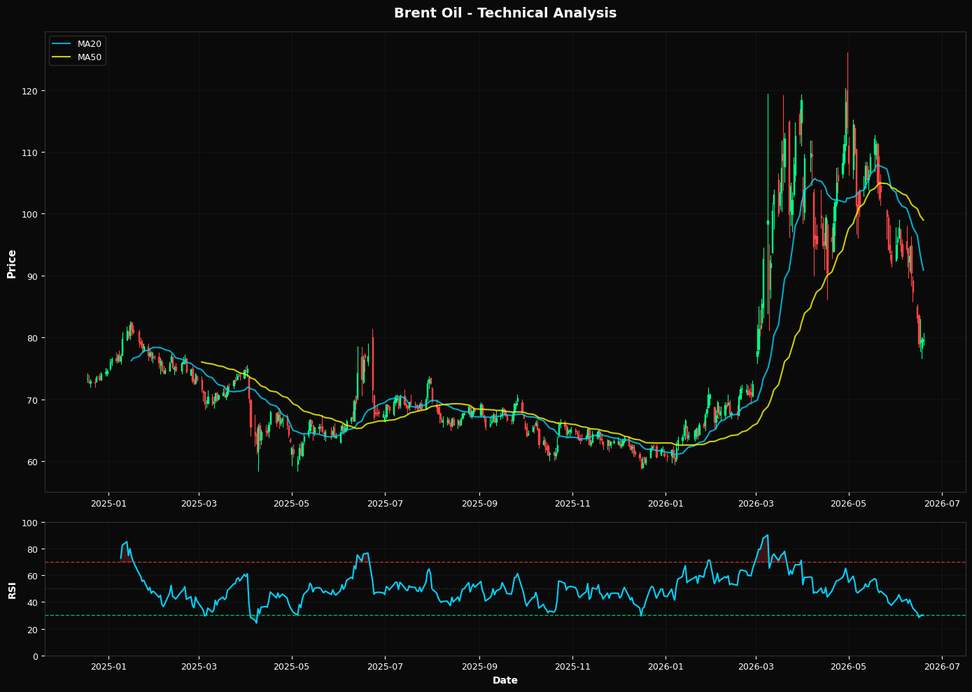
Brent oil is teetering on the edge of a critical technical juncture, with its price at $79.63, perilously close to its 200-day moving average of $78.46. This suggests a potential breakdown if macro conditions do not improve. The most pressing macro driver for Brent oil today is the strength of the U.S. dollar, which has been bolstered by the Federal Reserve's hawkish stance on interest rates. A strong dollar typically exerts downward pressure on oil prices by making it more expensive for holders of other currencies. Given the Fed's current trajectory, the dollar's strength is likely to persist, maintaining pressure on Brent oil prices. From a technical perspective, Brent oil's RSI of 30.0 indicates it is oversold, suggesting a potential for a short-term rebound. However, the price is significantly below its 20-day moving average of $90.89 and the 50-day moving average of $98.97, indicating a bearish trend. The nearest Fibonacci support level at 61.8% is $84.46, which Brent has already breached, further underscoring the bearish sentiment. The convergence of these technical indicators suggests a downward bias unless a significant catalyst emerges to reverse the trend. A key risk that could alter the current bearish outlook is a geopolitical event that disrupts supply, such as heightened tensions in the Middle East. Such an event could lead to a rapid spike in oil prices, overriding the current technical and macroeconomic pressures. Conversely, a resolution or de-escalation in geopolitical tensions could further depress prices, reinforcing the bearish trend. Looking ahead, the upcoming U.S. inflation data release will be pivotal. If inflation comes in higher than expected, it could prompt the Fed to maintain or even increase its hawkish stance, strengthening the dollar further and potentially pushing Brent oil prices below the 200-day moving average. Conversely, a softer inflation print could weaken the dollar, providing some relief to Brent prices and potentially invalidating the current bearish outlook.📈 Technical Indicators Summary
RSI (14)
30.0
50-Day MA
$98.97
200-Day MA
$78.46
Fib Level
61.8%
📊 Technical Analysis Chart (18-Month View)
📐 Fibonacci Retracement Analysis
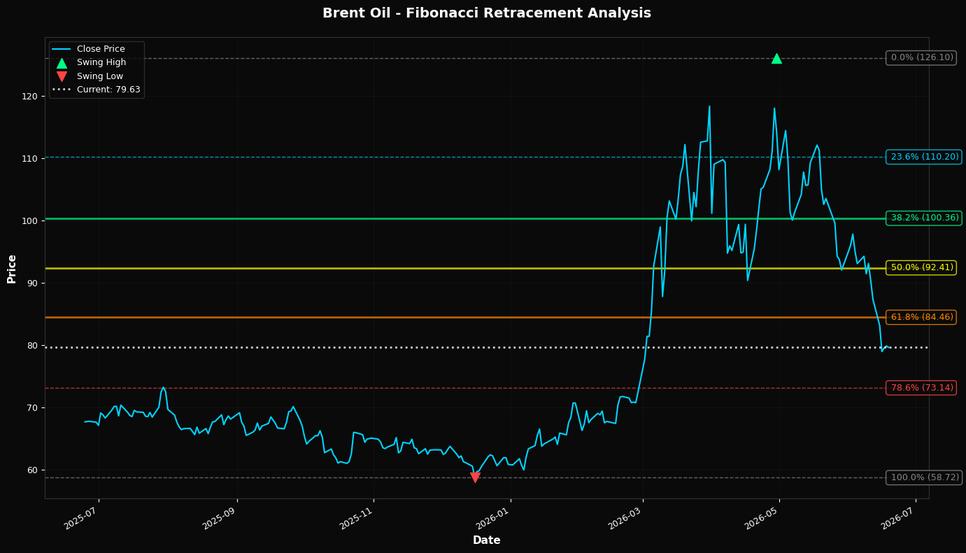
🎯 Key Trading Levels
Key Fibonacci Levels:
- 38.2%: $100.36
- 50.0%: $92.41
- 61.8%: $84.46
Support: $58.72 (Swing Low), $98.97 (50-Day MA)
Resistance: $126.10 (Swing High)
Disclaimer
The content on MarketsFN.com is provided for educational and informational purposes only. It does not constitute financial advice, investment recommendations, or trading guidance. All investments involve risks, and past performance does not guarantee future results. You are solely responsible for your investment decisions and should conduct independent research and consult a qualified financial advisor before acting. MarketsFN.com and its authors are not liable for any losses or damages arising from your use of this information.