Brent Oil: Down 0.8% to $97.01 — Below MA50 ($103.47) — Caution
· Commodities · QuoteReporter
Brent Oil: Down 0.8% to $97.01 — Below MA50 ($103.47) — Caution
Analysis Date: June 04, 2026
📊 Current Market Data
CURRENT PRICE
$97.01
DAILY CHANGE
-0.82%
WEEKLY CHANGE
+3.52%
52W HIGH
$126.10
52W LOW
$58.72
💡 Key Market Factors
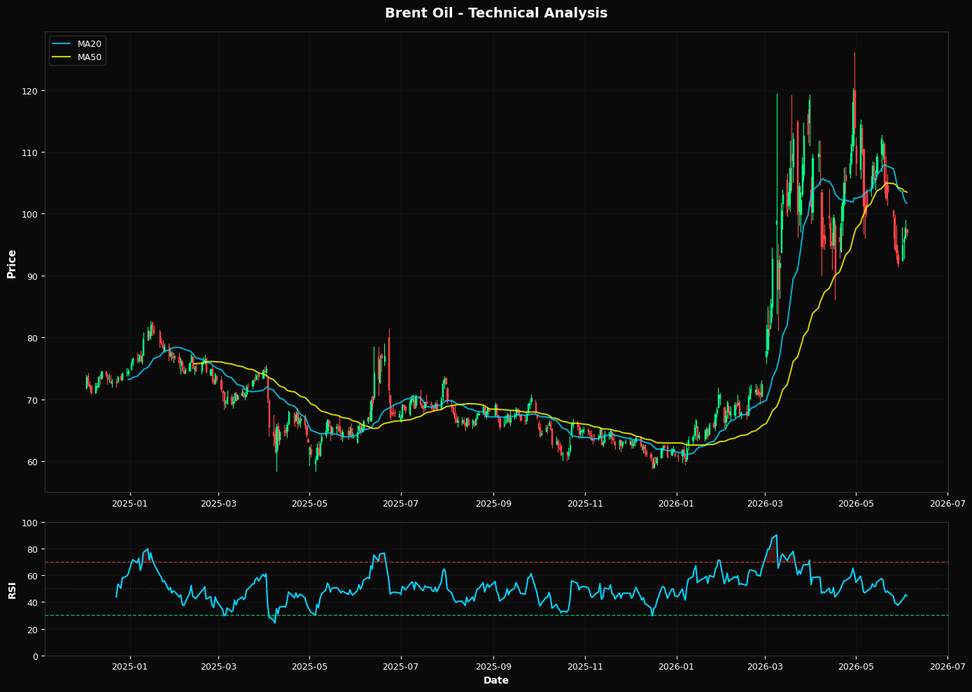
Brent Oil's current price action suggests a potential pullback, with the commodity trading at $97.01, down 0.82% daily but up 3.52% weekly. The most pressing macro driver today is the U.S. Federal Reserve's interest rate policy. With inflationary pressures persisting, the Fed's stance on rates could significantly impact oil prices. A hawkish Fed, maintaining or increasing rates, would likely strengthen the U.S. dollar, making oil more expensive for holders of other currencies and potentially dampening demand. This dynamic is crucial as it could cap Brent's recent rally, especially given its proximity to the $100 psychological level. Technically, Brent Oil is showing signs of weakness. The Relative Strength Index (RSI) at 44.6 indicates a lack of bullish momentum, as it hovers below the neutral 50 mark. The price is also trading below both the 20-day moving average ($101.69) and the 50-day moving average ($103.47), suggesting a bearish trend in the short to medium term. The 200-day moving average at $77.44, however, remains a distant support, indicating that the longer-term trend is still upward. The nearest Fibonacci support at 38.2% ($100.36) has not been breached, but the current price level suggests vulnerability. Overall, the technical setup points to a bearish bias unless Brent can reclaim the $100.36 level. A key risk that could alter the current bearish outlook is geopolitical tension in major oil-producing regions. Any escalation could disrupt supply chains, leading to a spike in oil prices. Conversely, a resolution or easing of tensions could alleviate supply concerns, reinforcing the bearish technical signals. The market may be underpricing the potential for such geopolitical disruptions, which historically have led to sharp price movements. Looking ahead, the upcoming Federal Reserve meeting will be pivotal. Should the Fed signal a pause or a dovish shift in its rate policy, it could weaken the dollar and provide a tailwind for Brent Oil, potentially invalidating the current bearish technical indicators. Conversely, a reaffirmation of a hawkish stance would likely confirm the downward pressure on oil prices. Investors should closely monitor the Fed's language and any geopolitical developments that could serve as catalysts for a significant price move.📈 Technical Indicators Summary
RSI (14)
44.6
50-Day MA
$103.47
200-Day MA
$77.44
Fib Level
38.2%
📊 Technical Analysis Chart (18-Month View)
📐 Fibonacci Retracement Analysis
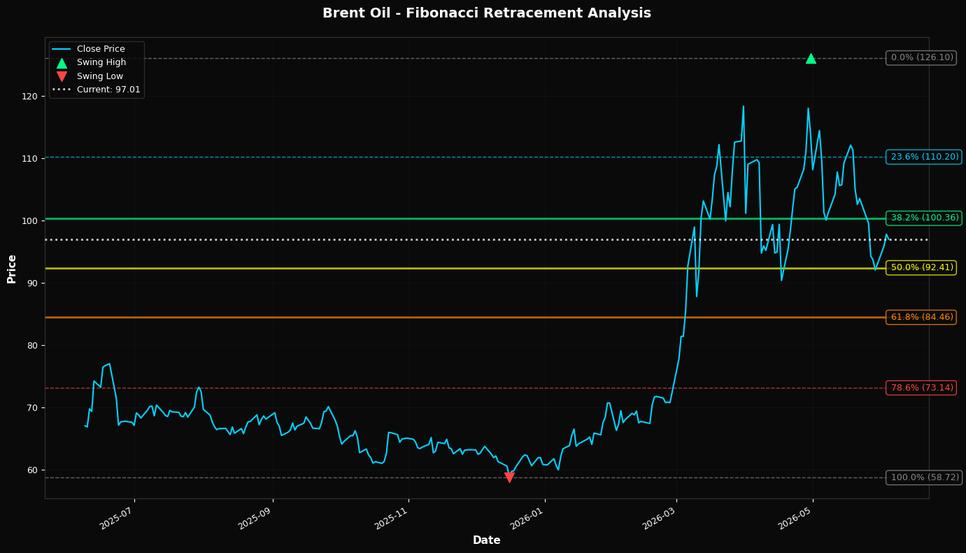
🎯 Key Trading Levels
Key Fibonacci Levels:
- 38.2%: $100.36
- 50.0%: $92.41
- 61.8%: $84.46
Support: $58.72 (Swing Low), $103.47 (50-Day MA)
Resistance: $126.10 (Swing High)
Disclaimer
The content on MarketsFN.com is provided for educational and informational purposes only. It does not constitute financial advice, investment recommendations, or trading guidance. All investments involve risks, and past performance does not guarantee future results. You are solely responsible for your investment decisions and should conduct independent research and consult a qualified financial advisor before acting. MarketsFN.com and its authors are not liable for any losses or damages arising from your use of this information.