Brent Oil: Down 0.9% to $94.15 — Testing 50.0% Fibonacci Support
· Commodities · QuoteReporter
Brent Oil: Down 0.9% to $94.15 — Testing 50.0% Fibonacci Support
Analysis Date: June 02, 2026
📊 Current Market Data
CURRENT PRICE
$94.15
DAILY CHANGE
-0.87%
WEEKLY CHANGE
-5.45%
52W HIGH
$126.10
52W LOW
$58.72
💡 Key Market Factors
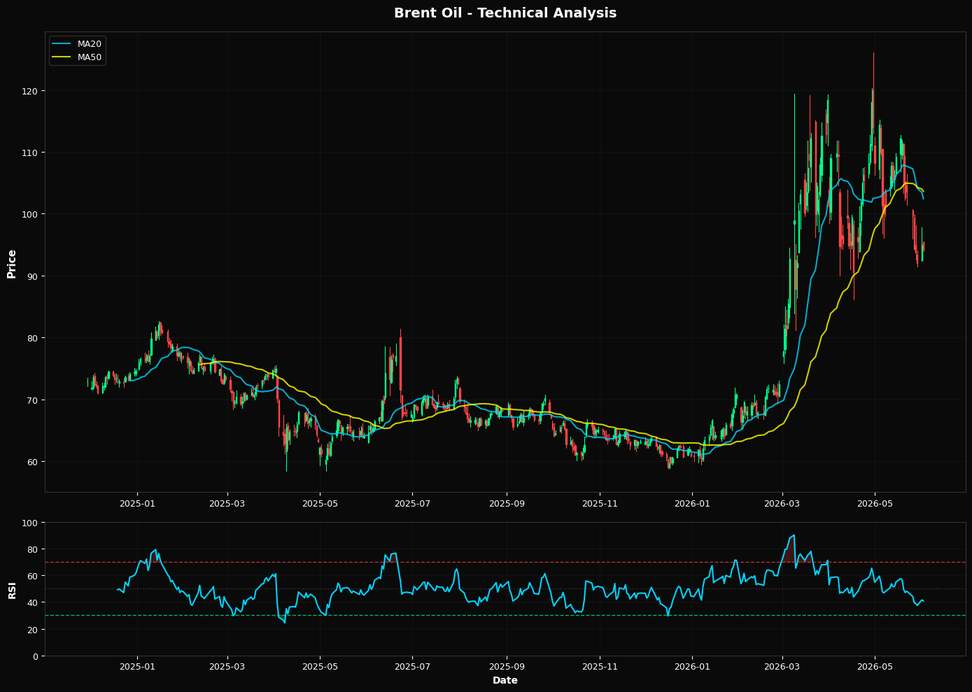
Brent Oil is at a critical juncture, with its price at $94.15, down 0.87% daily and 5.45% weekly, as it hovers near a key Fibonacci support level at $92.41. The most pressing macro driver for Brent Oil today is the strength of the U.S. dollar. A strong USD typically exerts downward pressure on oil prices by making oil more expensive for holders of other currencies. Given the current macroeconomic environment, where the Federal Reserve's hawkish stance on interest rates is likely to persist, the USD could remain robust. This dynamic is crucial as it could further suppress Brent prices, especially if the Fed signals additional rate hikes to combat inflation. Technically, Brent Oil's RSI of 40.7 suggests it is approaching oversold territory, indicating potential for a rebound. However, the price is significantly below its 20-day and 50-day moving averages, at $102.42 and $103.62 respectively, signaling a bearish trend. The 200-day moving average at $77.12 provides a distant support level, underscoring the recent volatility. The proximity to the 50.0% Fibonacci retracement level at $92.41 is pivotal; a breach below this could trigger further declines. Given these technical indicators, the directional bias remains bearish unless a strong reversal signal emerges. A key risk that could alter this bearish outlook is geopolitical tension in major oil-producing regions, which could disrupt supply and drive prices higher. For instance, any escalation in the Middle East or unexpected OPEC+ production cuts could quickly tighten supply, pushing prices upward despite current technical and macro pressures. Such events could catch the market off guard, as current pricing may not fully reflect these potential disruptions. Looking forward, the upcoming Federal Reserve meeting will be crucial. Any indication of a pause or slowdown in rate hikes could weaken the USD, providing relief to Brent Oil prices. Conversely, a reaffirmation of aggressive monetary policy could exacerbate the current downtrend. Monitoring the Fed's language and any shifts in economic projections will be essential to confirm or invalidate the current bearish view on Brent Oil.📈 Technical Indicators Summary
RSI (14)
40.7
50-Day MA
$103.62
200-Day MA
$77.12
Fib Level
50.0%
📊 Technical Analysis Chart (18-Month View)
📐 Fibonacci Retracement Analysis
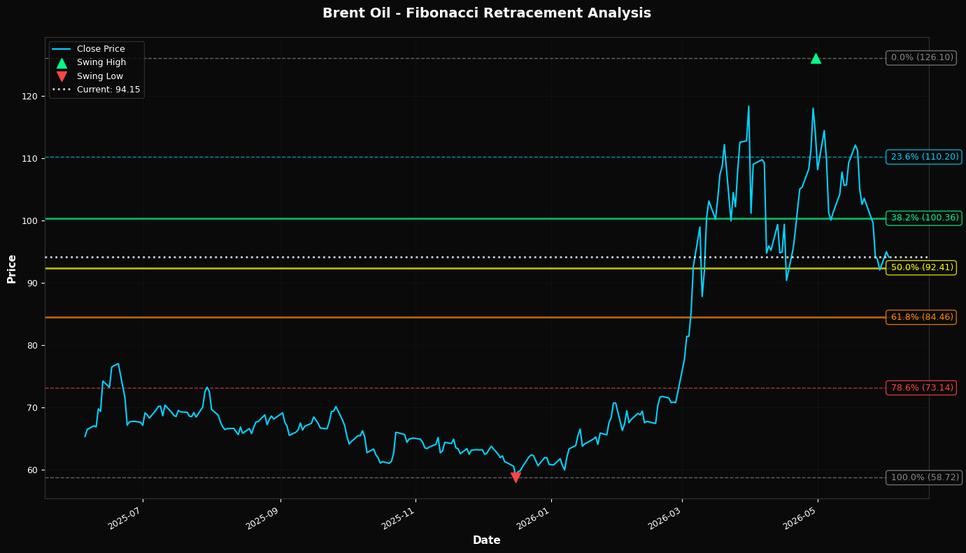
🎯 Key Trading Levels
Key Fibonacci Levels:
- 38.2%: $100.36
- 50.0%: $92.41
- 61.8%: $84.46
Support: $58.72 (Swing Low), $103.62 (50-Day MA)
Resistance: $126.10 (Swing High)
Disclaimer
The content on MarketsFN.com is provided for educational and informational purposes only. It does not constitute financial advice, investment recommendations, or trading guidance. All investments involve risks, and past performance does not guarantee future results. You are solely responsible for your investment decisions and should conduct independent research and consult a qualified financial advisor before acting. MarketsFN.com and its authors are not liable for any losses or damages arising from your use of this information.