Brent Oil: Down 1.3% to $93.06 — Testing 50.0% Fibonacci Support
· Commodities · QuoteReporter
Brent Oil: Down 1.3% to $93.06 — Testing 50.0% Fibonacci Support
Analysis Date: June 09, 2026
📊 Current Market Data
CURRENT PRICE
$93.06
DAILY CHANGE
-1.26%
WEEKLY CHANGE
-3.06%
52W HIGH
$126.10
52W LOW
$58.72
💡 Key Market Factors
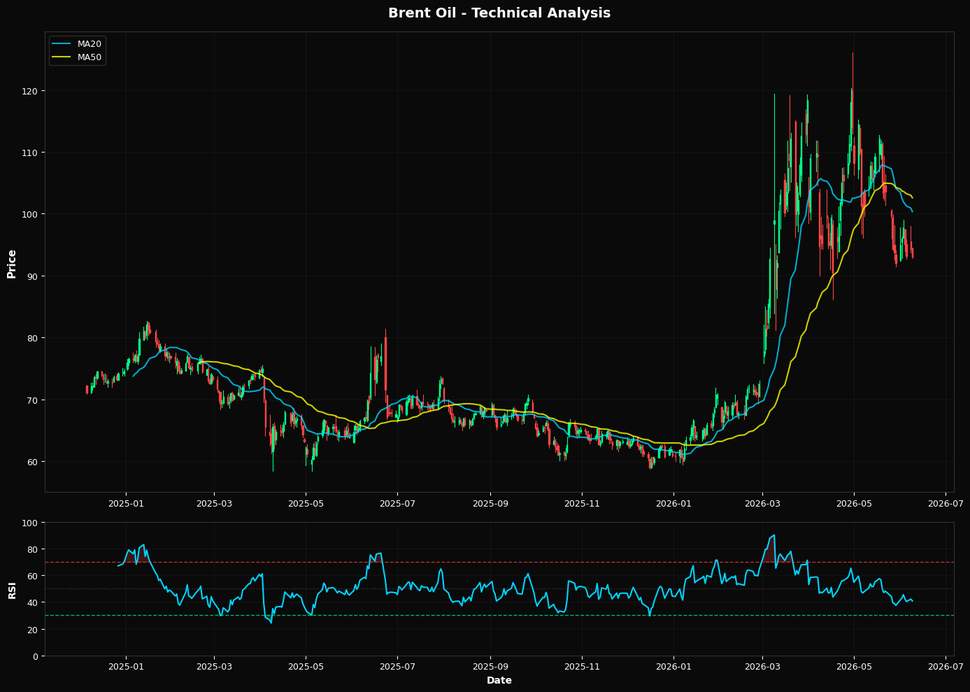
Brent Oil is teetering on a crucial support level, with its price at $93.06, just above the 50.0% Fibonacci retracement at $92.41. This suggests a potential pivot point, where a breach could accelerate downside momentum. The most pressing macro driver for Brent Oil today is the strength of the U.S. dollar. A robust USD, often inversely correlated with commodity prices, is exerting downward pressure on oil. As the Federal Reserve maintains a hawkish stance, the dollar's strength is likely to persist, potentially pushing Brent below key support levels. This dynamic is crucial as it directly impacts the purchasing power of non-dollar-denominated buyers, potentially dampening global demand. Technically, Brent Oil is showing bearish signals. The Relative Strength Index (RSI) at 40.8 indicates that the commodity is approaching oversold territory, but not quite there yet, suggesting further downside potential. The current price is significantly below both the 20-day moving average ($100.34) and the 50-day moving average ($102.58), reinforcing a bearish trend. However, it remains above the 200-day moving average ($77.83), which could act as a longer-term support. The convergence of these technical indicators with the proximity to the Fibonacci support level at $92.41 suggests a critical juncture; a decisive break below could lead to a swift decline towards the next support levels. A key risk that could alter this bearish outlook is any geopolitical event that disrupts oil supply, such as tensions in major oil-producing regions. Such an event could trigger a supply shock, driving prices higher irrespective of the current technical and macroeconomic pressures. Conversely, a de-escalation in geopolitical tensions or a significant increase in U.S. shale production could exacerbate the current downtrend by increasing supply. Looking ahead, the upcoming U.S. inflation data release will be pivotal. Should inflation come in higher than expected, it could reinforce the Fed's hawkish stance, further strengthening the USD and pressuring Brent Oil prices. Conversely, a lower-than-expected inflation figure could weaken the dollar, providing some relief to Brent prices. This data point will be critical in confirming or invalidating the current bearish outlook for Brent Oil.📈 Technical Indicators Summary
RSI (14)
40.8
50-Day MA
$102.58
200-Day MA
$77.83
Fib Level
50.0%
📊 Technical Analysis Chart (18-Month View)
📐 Fibonacci Retracement Analysis
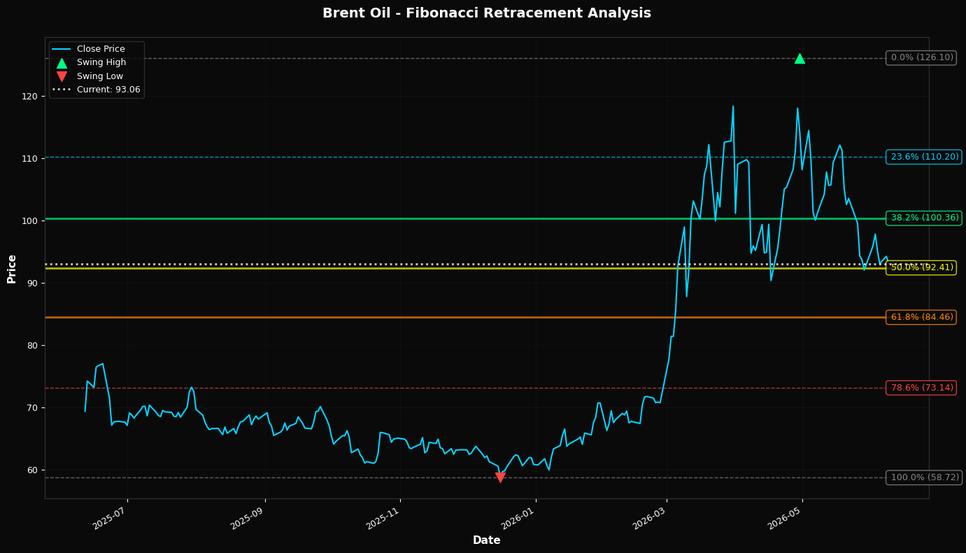
🎯 Key Trading Levels
Key Fibonacci Levels:
- 38.2%: $100.36
- 50.0%: $92.41
- 61.8%: $84.46
Support: $58.72 (Swing Low), $102.58 (50-Day MA)
Resistance: $126.10 (Swing High)
Disclaimer
The content on MarketsFN.com is provided for educational and informational purposes only. It does not constitute financial advice, investment recommendations, or trading guidance. All investments involve risks, and past performance does not guarantee future results. You are solely responsible for your investment decisions and should conduct independent research and consult a qualified financial advisor before acting. MarketsFN.com and its authors are not liable for any losses or damages arising from your use of this information.