Brent Oil: Down 1.7% to $72.52 — Oversold at RSI 24 — Watching for Bounce
· Commodities · QuoteReporter
Brent Oil: Down 1.7% to $72.52 — Oversold at RSI 24 — Watching for Bounce
Analysis Date: June 25, 2026
📊 Current Market Data
CURRENT PRICE
$72.52
DAILY CHANGE
-1.65%
WEEKLY CHANGE
-8.84%
52W HIGH
$126.10
52W LOW
$58.72
💡 Key Market Factors
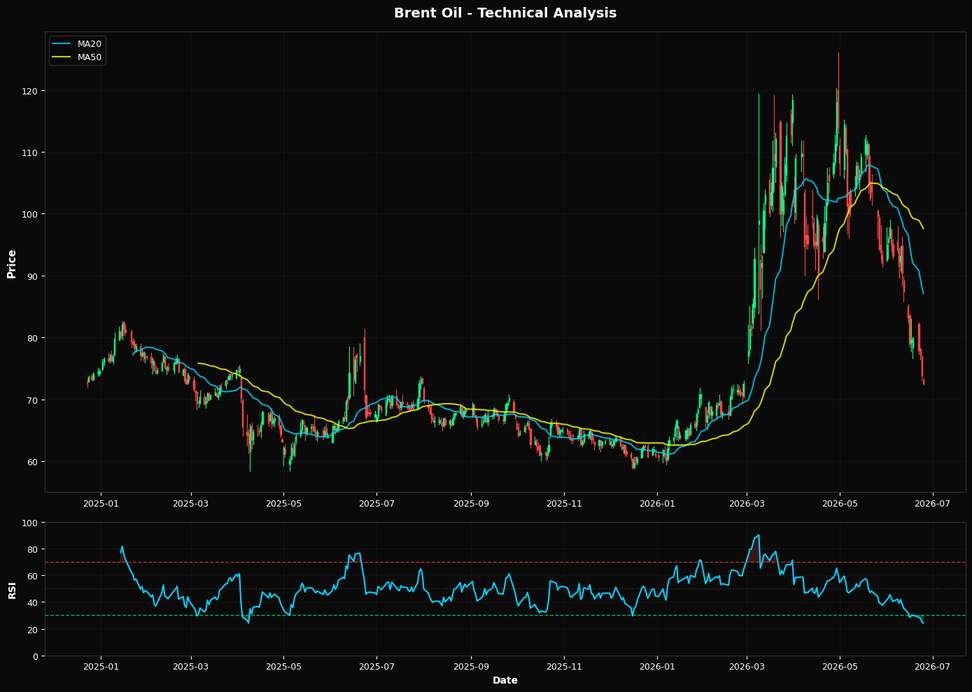
Brent Oil is teetering on the edge of a significant technical breakdown, with its price at $72.52, a stark -8.84% decline over the past week. The most pressing macro driver influencing Brent Oil today is the strength of the U.S. dollar. As the Federal Reserve maintains a hawkish stance on interest rates, the dollar has appreciated, exerting downward pressure on oil prices. A strong dollar makes oil more expensive in other currencies, dampening global demand. This dynamic is crucial now, as inflationary pressures have somewhat eased, shifting the market's focus to currency impacts. From a technical perspective, Brent Oil's RSI of 24.2 indicates it is deeply oversold, suggesting a potential for a short-term bounce. However, the price is significantly below its 20-day moving average of $87.10 and the 50-day moving average of $97.61, signaling a bearish trend. The 200-day moving average at $78.57 also looms above the current price, reinforcing the bearish outlook. The nearest Fibonacci support at 61.8% is at $84.46, which is currently out of reach, further highlighting the downward momentum. The market is likely underpricing the potential for a continued slide if the price fails to reclaim these key technical levels soon. A critical risk that could alter this bearish scenario is a sudden geopolitical event that disrupts supply, such as escalating tensions in a major oil-producing region. Such an event could trigger a rapid reversal in sentiment and prices, as supply concerns would outweigh the current demand-side pressures. Conversely, a dovish pivot by the Federal Reserve, leading to a weaker dollar, could also provide relief to oil prices by making them more affordable globally. Looking ahead, the upcoming Federal Reserve meeting will be pivotal. Any indication of a shift in monetary policy could either confirm the current bearish trend or provide a catalyst for recovery. If the Fed signals a pause or cut in rates, the resulting dollar weakness could support a rebound in Brent Oil prices. Conversely, continued hawkishness would likely validate the current downtrend, keeping prices under pressure.📈 Technical Indicators Summary
RSI (14)
24.2
50-Day MA
$97.61
200-Day MA
$78.57
Fib Level
61.8%
📊 Technical Analysis Chart (18-Month View)
📐 Fibonacci Retracement Analysis
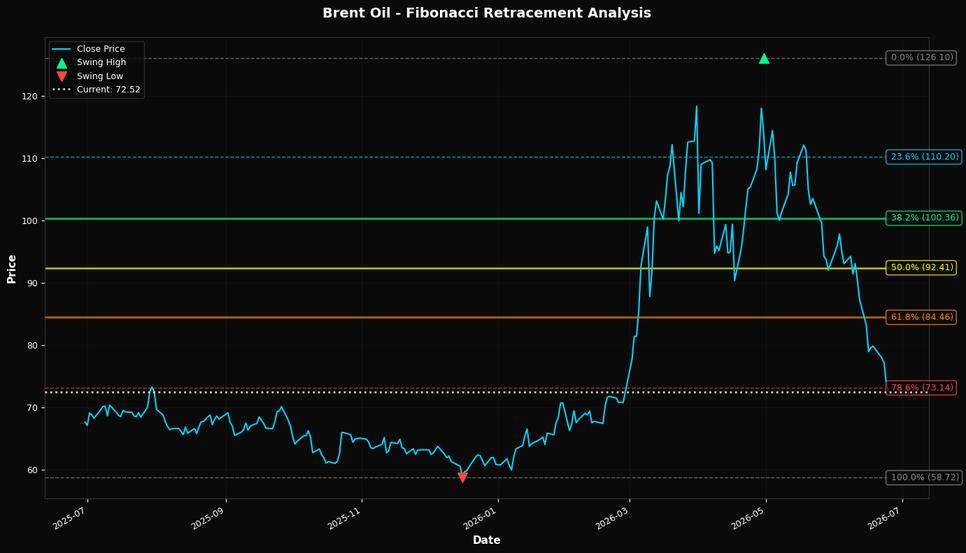
🎯 Key Trading Levels
Key Fibonacci Levels:
- 38.2%: $100.36
- 50.0%: $92.41
- 61.8%: $84.46
Support: $58.72 (Swing Low), $97.61 (50-Day MA)
Resistance: $126.10 (Swing High)
Disclaimer
The content on MarketsFN.com is provided for educational and informational purposes only. It does not constitute financial advice, investment recommendations, or trading guidance. All investments involve risks, and past performance does not guarantee future results. You are solely responsible for your investment decisions and should conduct independent research and consult a qualified financial advisor before acting. MarketsFN.com and its authors are not liable for any losses or damages arising from your use of this information.