Brent Oil Rallies 3.3%
· Commodities · MarketsFN Team
Brent Oil Rallies 3.3%
Analysis Date: May 11, 2026
📊 Current Market Data
CURRENT PRICE
$104.64
DAILY CHANGE
+3.31%
WEEKLY CHANGE
-8.56%
52W HIGH
$126.10
52W LOW
$58.72
💡 Key Market Factors
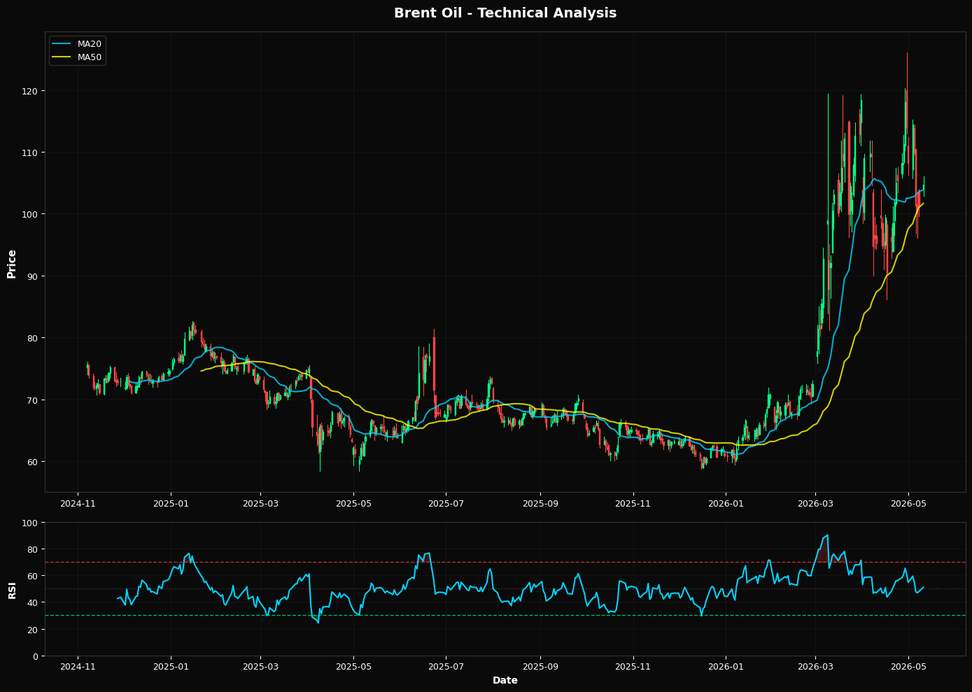
Brent Oil's recent price movement, with a daily increase of 3.31% to $104.64, reflects a rebound from recent declines, though it remains down 8.56% on the week. The current price is slightly above the 20-day moving average of $103.85, suggesting a potential short-term bullish sentiment, while the 50-day moving average at $101.65 offers additional support. The RSI at 50.9 indicates a neutral momentum, suggesting neither overbought nor oversold conditions. Inflation expectations continue to play a significant role in the oil market, as persistent inflation pressures could lead to higher energy costs, thereby supporting oil prices. However, the recent decline in Brent suggests that broader economic concerns, possibly linked to inflation's impact on global growth, are weighing on market sentiment. Interest rate policies, particularly from the Federal Reserve, remain a critical factor. The Fed's ongoing rate hikes to combat inflation could dampen economic activity, potentially reducing oil demand. This balancing act between controlling inflation and sustaining growth is crucial for Brent's future price trajectory. Geopolitical factors remain a key consideration, although no major new developments have surfaced recently. However, ongoing tensions in key oil-producing regions could disrupt supply chains, providing support to prices. Traders should remain vigilant for any shifts in geopolitical landscapes that could impact Brent's supply-demand dynamics.📈 Technical Indicators Summary
RSI (14)
50.9
50-Day MA
$101.65
200-Day MA
$74.61
Fib Level
38.2%
📊 Technical Analysis Chart (18-Month View)
📐 Fibonacci Retracement Analysis
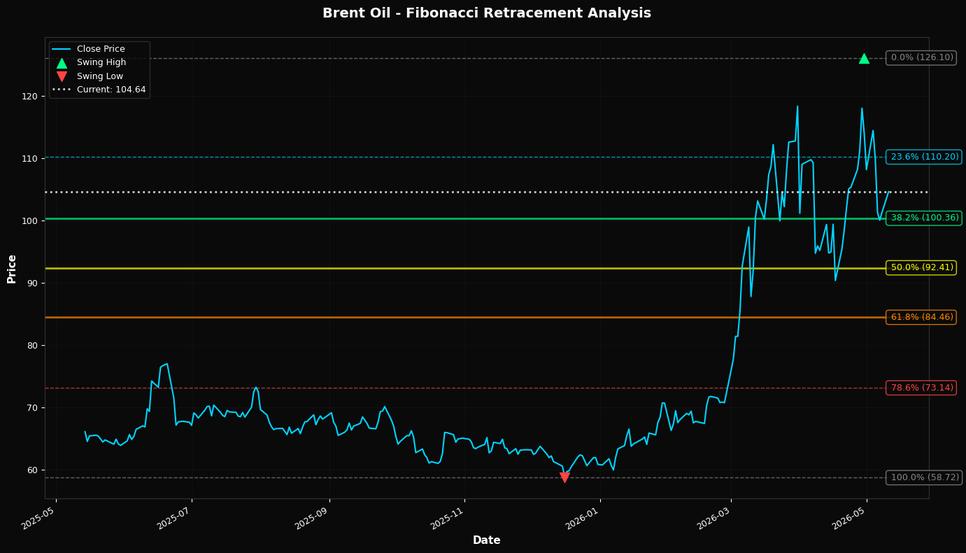
🎯 Key Trading Levels
Key Fibonacci Levels:
- 38.2% Level: $100.36
- 50.0% Level: $92.41
- 61.8% Level: $84.46
Support: $58.72 (Swing Low), $101.65 (50-day MA)
Resistance: $126.10 (Swing High)
Disclaimer
The content on MarketsFN.com is provided for educational and informational purposes only. It does not constitute financial advice, investment recommendations, or trading guidance. All investments involve risks, and past performance does not guarantee future results. You are solely responsible for your investment decisions and should conduct independent research and consult a qualified financial advisor before acting. MarketsFN.com and its authors are not liable for any losses or damages arising from your use of this information.