Brent Oil Retraces 1.0%
· Commodities · QuoteReporter
Brent Oil Retraces 1.0%
Analysis Date: May 19, 2026
📊 Current Market Data
CURRENT PRICE
$110.95
DAILY CHANGE
-1.03%
WEEKLY CHANGE
+2.95%
52W HIGH
$126.10
52W LOW
$58.72
💡 Key Market Factors
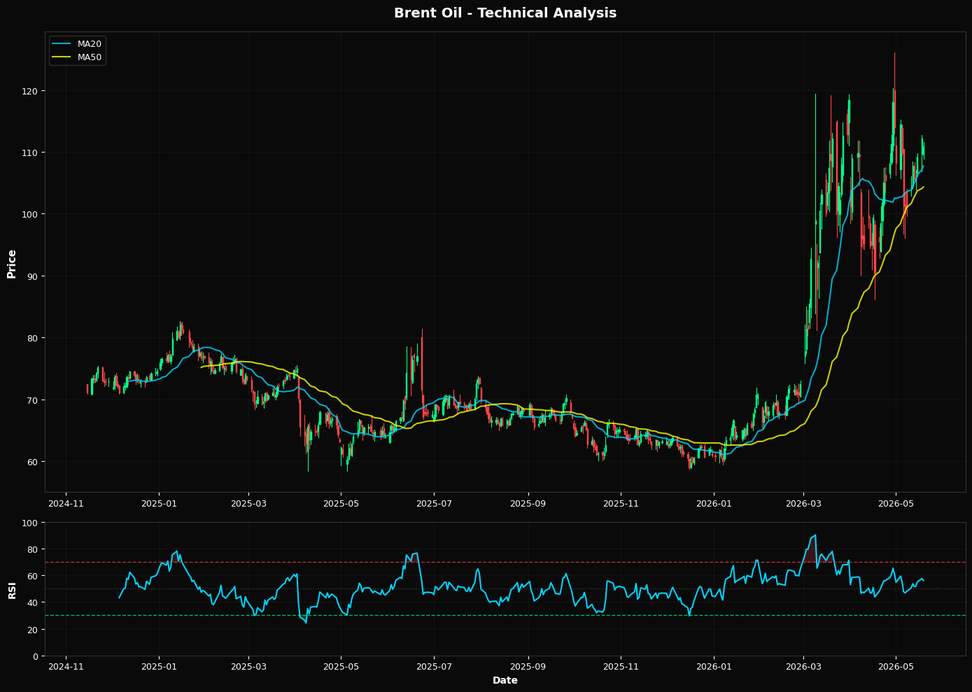
Brent oil's recent price movements are significantly influenced by macroeconomic factors, particularly inflation and monetary policy. The current price of $110.95 reflects a market adjusting to persistent inflationary pressures, which are affecting energy costs globally. High inflation continues to support oil prices as investors seek commodities as a hedge, although the Federal Reserve's monetary policy remains a critical counterbalance. The Fed's stance on interest rates, aiming to curb inflation, could temper demand and impact oil prices if rate hikes slow economic growth. From a technical perspective, Brent oil is trading above its 20-day and 50-day moving averages, which are at $107.73 and $104.32, respectively, indicating a short-term bullish trend. The Relative Strength Index (RSI) at 56.1 suggests that the market is neither overbought nor oversold, providing room for further price movements without immediate correction pressures. Additionally, the nearest Fibonacci retracement level at 38.2% is positioned at $100.36, offering a potential support level should prices decline. Geopolitical tensions, particularly in key oil-producing regions, remain a critical factor for Brent oil prices. While no new major events have emerged, ongoing conflicts and production uncertainties continue to underpin the market's risk premium. These geopolitical dynamics, coupled with OPEC+ production decisions, remain essential in shaping the supply outlook and could lead to further volatility in the oil market.📈 Technical Indicators Summary
RSI (14)
56.1
50-Day MA
$104.32
200-Day MA
$75.73
Fib Level
38.2%
📊 Technical Analysis Chart (18-Month View)
📐 Fibonacci Retracement Analysis
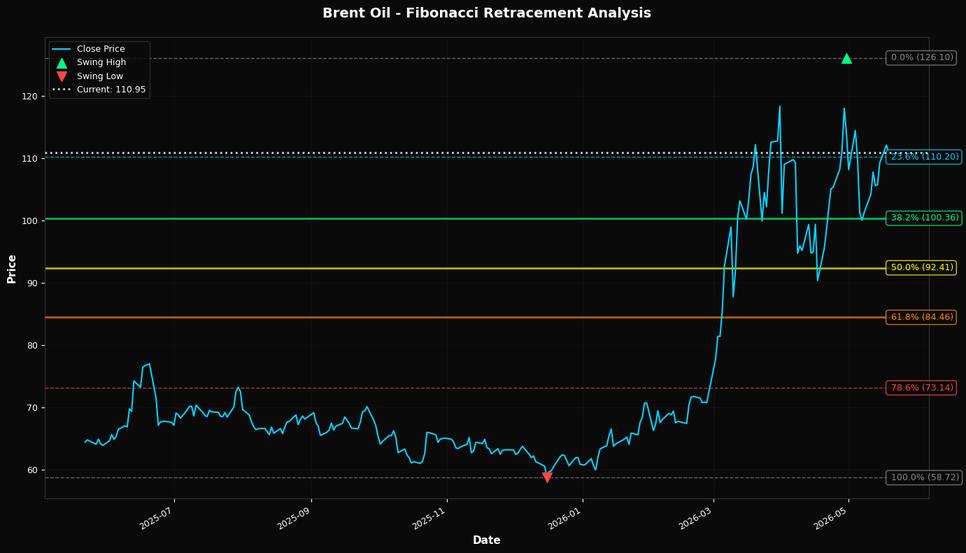
🎯 Key Trading Levels
Key Fibonacci Levels:
- 38.2%: $100.36
- 50.0%: $92.41
- 61.8%: $84.46
Support: $58.72 (Swing Low), $104.32 (50-Day MA)
Resistance: $126.10 (Swing High)
Disclaimer
The content on MarketsFN.com is provided for educational and informational purposes only. It does not constitute financial advice, investment recommendations, or trading guidance. All investments involve risks, and past performance does not guarantee future results. You are solely responsible for your investment decisions and should conduct independent research and consult a qualified financial advisor before acting. MarketsFN.com and its authors are not liable for any losses or damages arising from your use of this information.