Brent Oil Sells Off 2.4%
· Commodities · QuoteReporter
Brent Oil Sells Off 2.4%
Analysis Date: May 20, 2026
📊 Current Market Data
CURRENT PRICE
$108.62
DAILY CHANGE
-2.39%
WEEKLY CHANGE
+2.83%
52W HIGH
$126.10
52W LOW
$58.72
💡 Key Market Factors
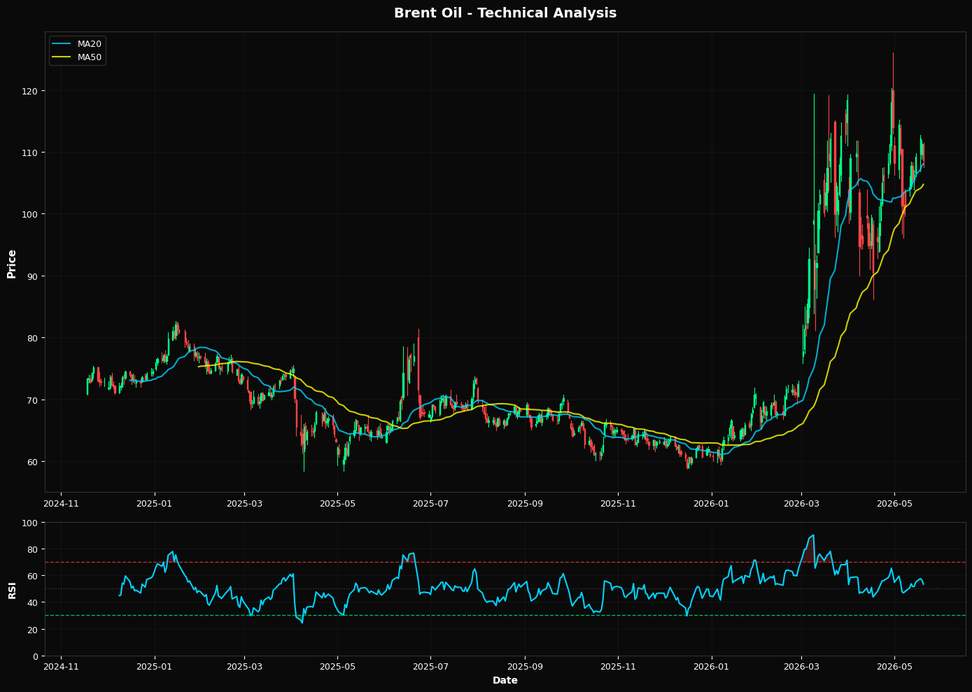
Brent oil's current price dynamics reflect a complex interplay of macroeconomic factors, with inflationary pressures playing a significant role. Elevated inflation rates globally have bolstered oil prices, as energy costs contribute significantly to overall inflation metrics. This has been compounded by supply chain disruptions and increased demand as economies recover, which continue to support higher price levels despite recent daily declines. The Federal Reserve's monetary policy remains a critical factor influencing Brent oil prices. With the Fed maintaining a hawkish stance to combat inflation, interest rate hikes could potentially dampen economic growth and reduce oil demand. However, the market's anticipation of these moves has been somewhat priced in, as evidenced by the recent weekly price increase, suggesting that investors are weighing the balance between rate hikes and persistent demand. Geopolitical tensions, particularly in key oil-producing regions, have been a major driver of price volatility. Any significant escalation in these areas could lead to supply disruptions, further tightening the market. While no immediate crises are currently dominating headlines, the potential for geopolitical events to impact supply remains a key risk factor for Brent oil prices. From a technical perspective, Brent oil's RSI at 53.3 indicates a neutral market sentiment, suggesting neither overbought nor oversold conditions. The price is hovering slightly above the 20-day moving average ($108.08) and well above the 50-day moving average ($104.74), indicating a generally bullish trend. However, the nearest Fibonacci retracement level at 38.2% ($100.36) serves as a potential support level, which could be tested if bearish momentum increases.📈 Technical Indicators Summary
RSI (14)
53.3
50-Day MA
$104.74
200-Day MA
$75.93
Fib Level
38.2%
📊 Technical Analysis Chart (18-Month View)
📐 Fibonacci Retracement Analysis
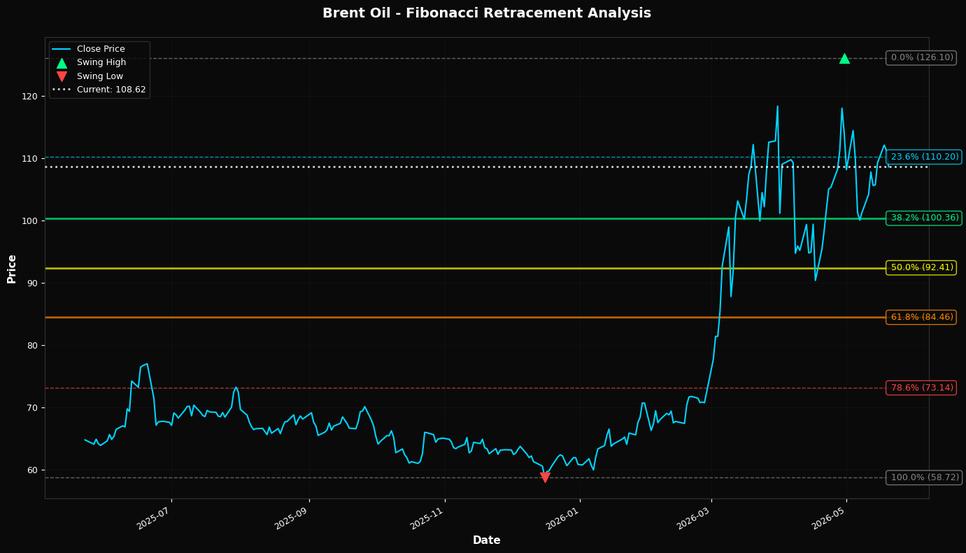
🎯 Key Trading Levels
Key Fibonacci Levels:
- 38.2%: $100.36
- 50.0%: $92.41
- 61.8%: $84.46
Support: $58.72 (Swing Low), $104.74 (50-Day MA)
Resistance: $126.10 (Swing High)
Disclaimer
The content on MarketsFN.com is provided for educational and informational purposes only. It does not constitute financial advice, investment recommendations, or trading guidance. All investments involve risks, and past performance does not guarantee future results. You are solely responsible for your investment decisions and should conduct independent research and consult a qualified financial advisor before acting. MarketsFN.com and its authors are not liable for any losses or damages arising from your use of this information.