Brent Oil Sells Off 3.1%
· Commodities · MarketsFN Team
Brent Oil Sells Off 3.1%
Analysis Date: May 06, 2026
📊 Current Market Data
CURRENT PRICE
$106.46
DAILY CHANGE
-3.10%
WEEKLY CHANGE
-9.80%
52W HIGH
$126.10
52W LOW
$58.72
💡 Key Market Factors
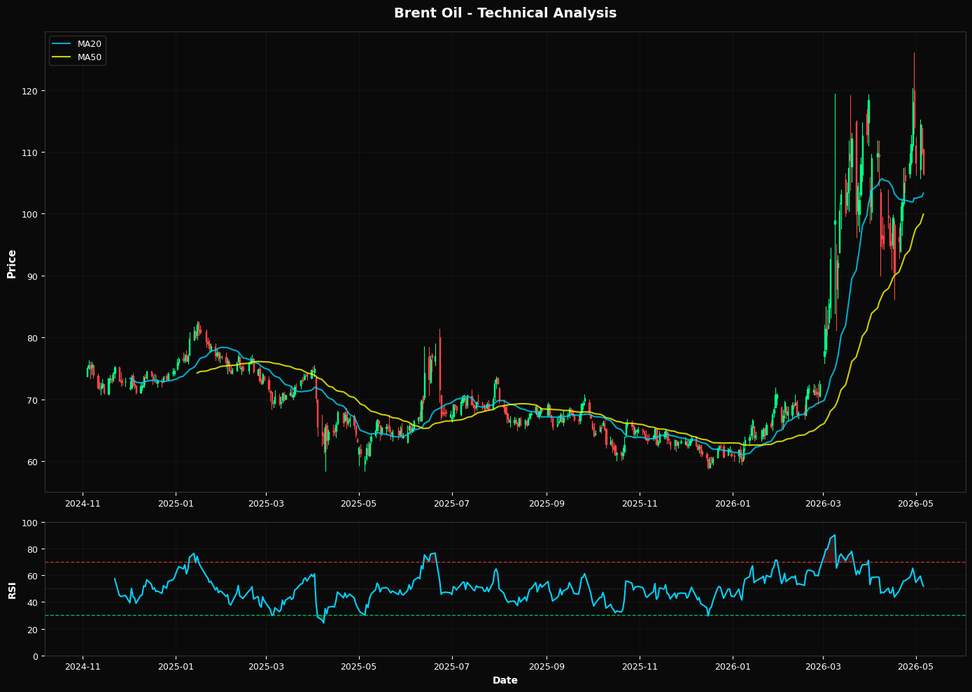
Brent Oil's recent price decline to $106.46, with a significant weekly drop of 9.80%, reflects increasing concerns over global economic slowdown and its impact on demand. Inflationary pressures, while still present, have been somewhat overshadowed by these demand concerns, as central banks, particularly the Federal Reserve, continue to maintain a hawkish stance on interest rates to combat inflation. This has led to a stronger U.S. dollar, which typically exerts downward pressure on oil prices by making it more expensive for holders of other currencies. From a geopolitical perspective, there are no immediate major disruptions affecting Brent supply chains, suggesting that the current price movements are more driven by macroeconomic factors than supply constraints. However, ongoing tensions in the Middle East and potential policy shifts from OPEC+ remain underlying risks that could quickly alter the supply landscape. Technically, Brent Oil is trading above its 20-day and 50-day moving averages, indicating a generally bullish trend despite recent declines. The RSI at 51.8 suggests a neutral momentum, neither overbought nor oversold, providing room for potential upward or downward movement. Key support is seen at the Fibonacci level of 38.2% at $100.36, while resistance is likely around the recent highs, making these levels crucial for traders to watch in the near term.📈 Technical Indicators Summary
RSI (14)
51.8
50-Day MA
$99.92
200-Day MA
$74.13
Fib Level
38.2%
📊 Technical Analysis Chart (18-Month View)
📐 Fibonacci Retracement Analysis
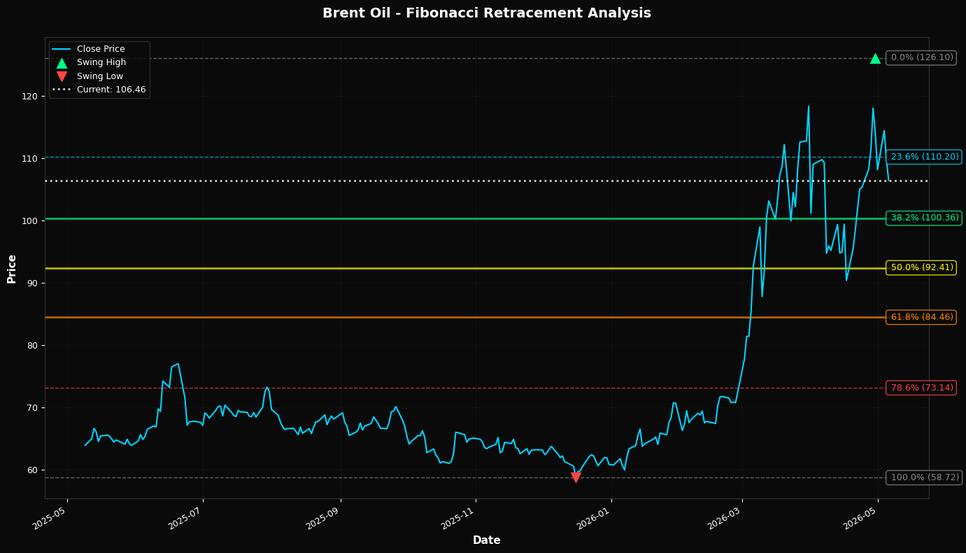
🎯 Key Trading Levels
Key Fibonacci Levels:
- 38.2% Level: $100.36
- 50.0% Level: $92.41
- 61.8% Level: $84.46
Support: $58.72 (Swing Low), $99.92 (50-day MA)
Resistance: $126.10 (Swing High)
Disclaimer
The content on MarketsFN.com is provided for educational and informational purposes only. It does not constitute financial advice, investment recommendations, or trading guidance. All investments involve risks, and past performance does not guarantee future results. You are solely responsible for your investment decisions and should conduct independent research and consult a qualified financial advisor before acting. MarketsFN.com and its authors are not liable for any losses or damages arising from your use of this information.