Brent Oil Soars 2.9% near 38.2% Fibonacci resistance
· Commodities · MarketsFN Team
Brent Oil Soars 2.9% near 38.2% Fibonacci resistance
Analysis Date: February 27, 2026
📊 Current Market Data
CURRENT PRICE
$72.81
DAILY CHANGE
+2.91%
WEEKLY CHANGE
+1.46%
52W HIGH
$81.40
52W LOW
$58.39
💡 Key Market Factors
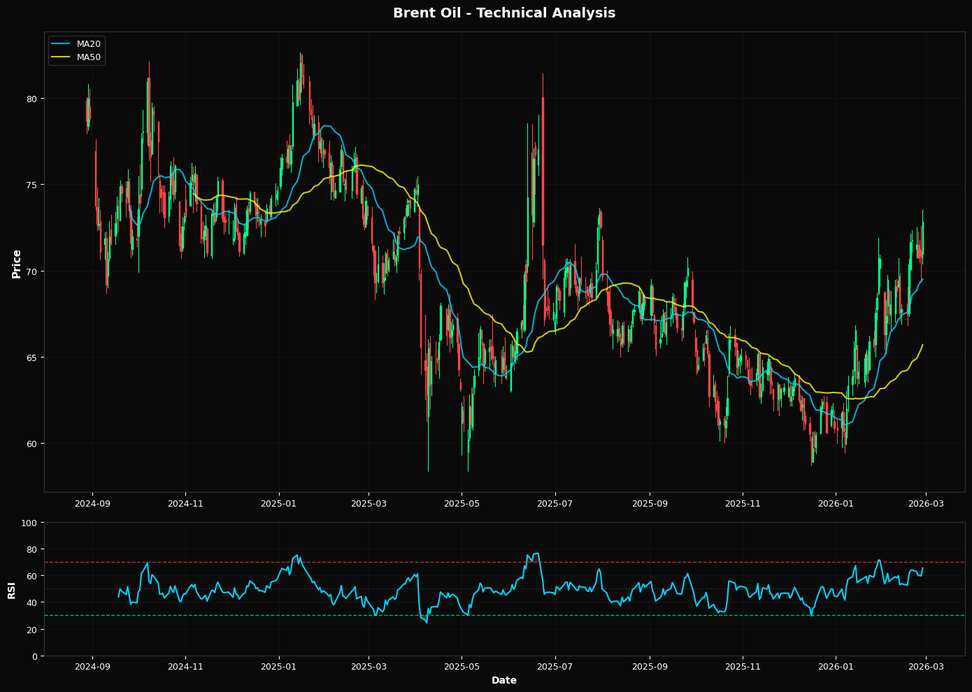
Brent Oil prices have seen a notable uptick, currently trading at $72.81, reflecting a daily increase of 2.91%. This movement aligns with broader inflationary pressures, as rising energy costs contribute to inflation expectations, potentially driving demand for oil as a hedge. However, the impact of inflation on oil prices remains nuanced, with market participants closely monitoring central bank responses. The Federal Reserve's interest rate policy continues to play a pivotal role in shaping oil market dynamics. Recent signals from the Fed suggest a cautious approach to further rate hikes, which could support oil prices by maintaining lower borrowing costs and fostering economic activity. However, any unexpected policy shifts could introduce volatility into the market. Technically, Brent Oil is approaching a critical resistance level at the Fibonacci 38.2% retracement of $72.61. With the RSI at 65.4, the market is nearing overbought conditions, suggesting potential for a short-term pullback. The price is also trading above its 20-day and 50-day moving averages, indicating a bullish trend, but traders should watch for any reversal signals near these key levels.📈 Technical Indicators Summary
RSI (14)
65.4
50-Day MA
$65.71
200-Day MA
$66.23
Fib Level
38.2%
📊 Technical Analysis Chart (18-Month View)
📐 Fibonacci Retracement Analysis
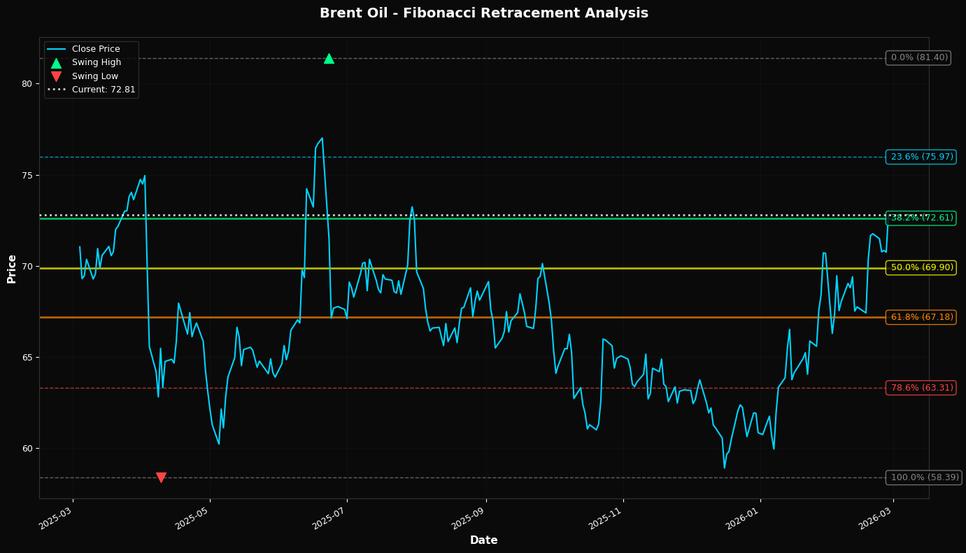
🎯 Key Trading Levels
Key Fibonacci Levels:
- 38.2% Level: $72.61
- 50.0% Level: $69.90
- 61.8% Level: $67.18
Support: $58.39 (Swing Low), $65.71 (50-day MA)
Resistance: $81.40 (Swing High)
Disclaimer
The content on MarketsFN.com is provided for educational and informational purposes only. It does not constitute financial advice, investment recommendations, or trading guidance. All investments involve risks, and past performance does not guarantee future results. You are solely responsible for your investment decisions and should conduct independent research and consult a qualified financial advisor before acting. MarketsFN.com and its authors are not liable for any losses or damages arising from your use of this information.