Brent Oil: Up 0.1% to $95.16 — Below MA50 ($103.29) — Caution
· Commodities · QuoteReporter
Brent Oil: Up 0.1% to $95.16 — Below MA50 ($103.29) — Caution
Analysis Date: June 05, 2026
📊 Current Market Data
CURRENT PRICE
$95.16
DAILY CHANGE
+0.14%
WEEKLY CHANGE
+3.38%
52W HIGH
$126.10
52W LOW
$58.72
💡 Key Market Factors
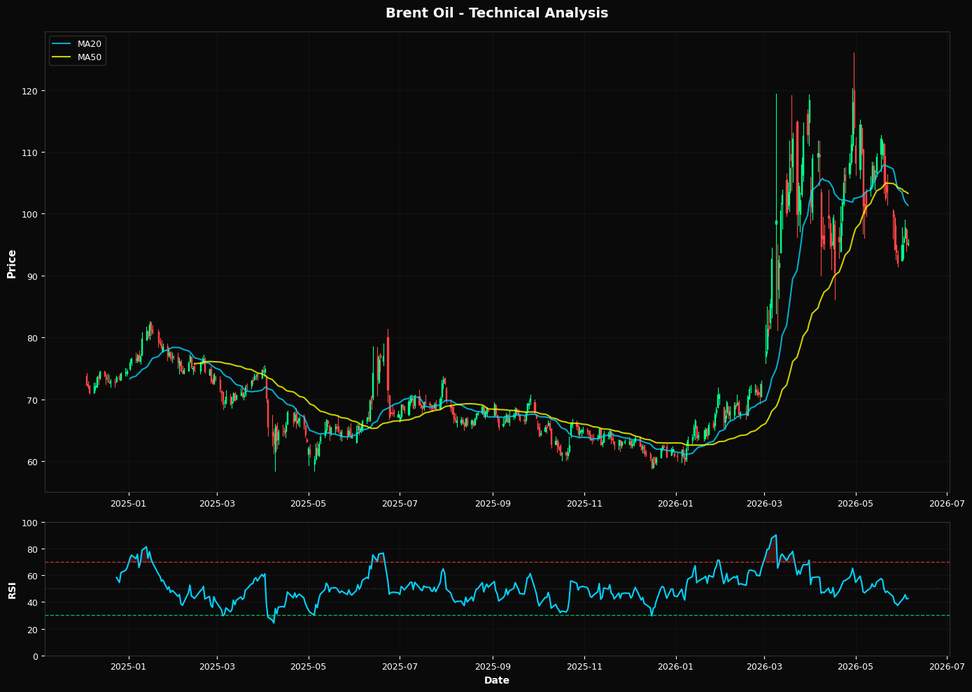
Brent Oil's current price action suggests a potential pullback, with the most critical factor being the U.S. Federal Reserve's monetary policy stance. As Brent trades at $95.16, up +0.14% daily and +3.38% weekly, the market is closely watching the Fed's next move. With inflationary pressures persisting, any indication of a more aggressive rate hike could strengthen the U.S. dollar, exerting downward pressure on oil prices. The Fed's policy decisions are paramount because a stronger dollar makes oil more expensive for holders of other currencies, potentially dampening demand. From a technical perspective, Brent Oil's RSI of 42.6 suggests it is neither overbought nor oversold, indicating a lack of strong momentum in either direction. However, the price is significantly below its 20-day and 50-day moving averages, at $101.35 and $103.29, respectively, while remaining above the 200-day moving average of $77.58. This positioning implies a bearish short-term outlook, with potential support at the nearest Fibonacci level of 50.0% at $92.41. The market may be underestimating the potential for a correction towards this support level, given the current technical setup. A key risk that could alter the current trajectory is a geopolitical event impacting supply, such as disruptions in major oil-producing regions. Such an event could drive prices higher, overriding technical and macroeconomic pressures. Conversely, a significant increase in U.S. crude inventories could push prices lower, reinforcing the bearish technical signals. The market may not be fully pricing in these supply-side risks, which could lead to sudden volatility. Looking ahead, the upcoming U.S. inflation data release will be crucial. If inflation remains stubbornly high, it could prompt the Fed to maintain or even increase its hawkish stance, potentially strengthening the dollar further and pressuring Brent prices. Conversely, a softer inflation reading could alleviate some of the downward pressure, providing a temporary reprieve for oil bulls. This data point will be pivotal in confirming or invalidating the current bearish bias in Brent Oil.📈 Technical Indicators Summary
RSI (14)
42.6
50-Day MA
$103.29
200-Day MA
$77.58
Fib Level
50.0%
📊 Technical Analysis Chart (18-Month View)
📐 Fibonacci Retracement Analysis
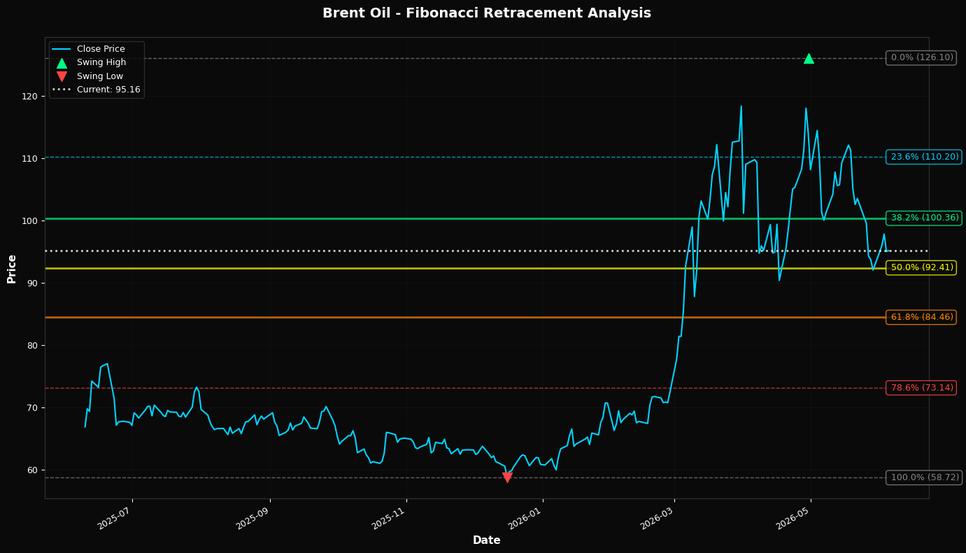
🎯 Key Trading Levels
Key Fibonacci Levels:
- 38.2%: $100.36
- 50.0%: $92.41
- 61.8%: $84.46
Support: $58.72 (Swing Low), $103.29 (50-Day MA)
Resistance: $126.10 (Swing High)
Disclaimer
The content on MarketsFN.com is provided for educational and informational purposes only. It does not constitute financial advice, investment recommendations, or trading guidance. All investments involve risks, and past performance does not guarantee future results. You are solely responsible for your investment decisions and should conduct independent research and consult a qualified financial advisor before acting. MarketsFN.com and its authors are not liable for any losses or damages arising from your use of this information.