Brent Oil: Up 1.8% to $97.69 — Below MA50 ($103.61) — Caution
· Commodities · QuoteReporter
Brent Oil: Up 1.8% to $97.69 — Below MA50 ($103.61) — Caution
Analysis Date: June 03, 2026
📊 Current Market Data
CURRENT PRICE
$97.69
DAILY CHANGE
+1.76%
WEEKLY CHANGE
+3.61%
52W HIGH
$126.10
52W LOW
$58.72
💡 Key Market Factors
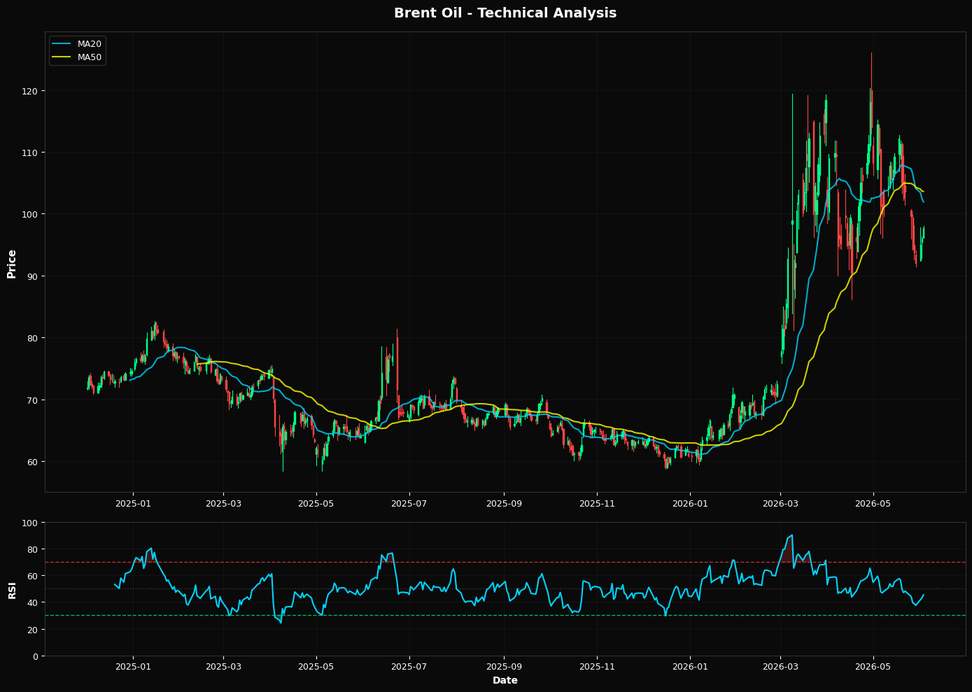
Brent oil's current price action suggests a potential upward momentum, but the market may be underestimating the impact of the U.S. dollar's strength on oil prices. With Brent trading at $97.69, up 1.76% daily and 3.61% weekly, the commodity is showing resilience. However, the U.S. dollar's movements are crucial here. A stronger dollar typically exerts downward pressure on oil prices by making it more expensive for holders of other currencies. Given the Federal Reserve's hawkish stance on interest rates, which supports a robust dollar, this macro driver is the most significant factor influencing Brent oil today. The market might be overlooking how sustained dollar strength could cap further gains in Brent, despite the recent uptick. From a technical perspective, Brent oil is in a precarious position. The Relative Strength Index (RSI) at 45.3 indicates that the commodity is neither overbought nor oversold, suggesting a neutral momentum. However, Brent is trading below its 20-day moving average of $101.90 and the 50-day moving average of $103.61, signaling potential bearish pressure in the short term. The 200-day moving average at $77.29 is significantly lower, indicating a longer-term bullish trend. The nearest Fibonacci support level at 38.2% is $100.36, which Brent has yet to reclaim. This technical setup suggests a cautious bullish bias, contingent on Brent's ability to break above the $100.36 level, which could trigger further buying interest. A key risk that could alter the current trajectory of Brent oil is any unexpected geopolitical event that disrupts supply. For instance, escalating tensions in the Middle East or a significant production cut from OPEC could drive prices higher, counteracting the dollar's impact. Conversely, a resolution to any ongoing geopolitical tensions could ease supply concerns, potentially leading to a price correction. The market may not be fully pricing in these geopolitical risks, which could lead to sudden volatility. Looking ahead, the upcoming U.S. inflation data release will be pivotal. If inflation remains elevated, it could reinforce the Federal Reserve's commitment to maintaining higher interest rates, thereby supporting the dollar and potentially capping Brent's upside. Conversely, a softer inflation print could weaken the dollar, providing a tailwind for Brent prices. This data point will be crucial in confirming or invalidating the current view that the dollar's strength is a limiting factor for Brent oil's price trajectory.📈 Technical Indicators Summary
RSI (14)
45.3
50-Day MA
$103.61
200-Day MA
$77.29
Fib Level
38.2%
📊 Technical Analysis Chart (18-Month View)
📐 Fibonacci Retracement Analysis
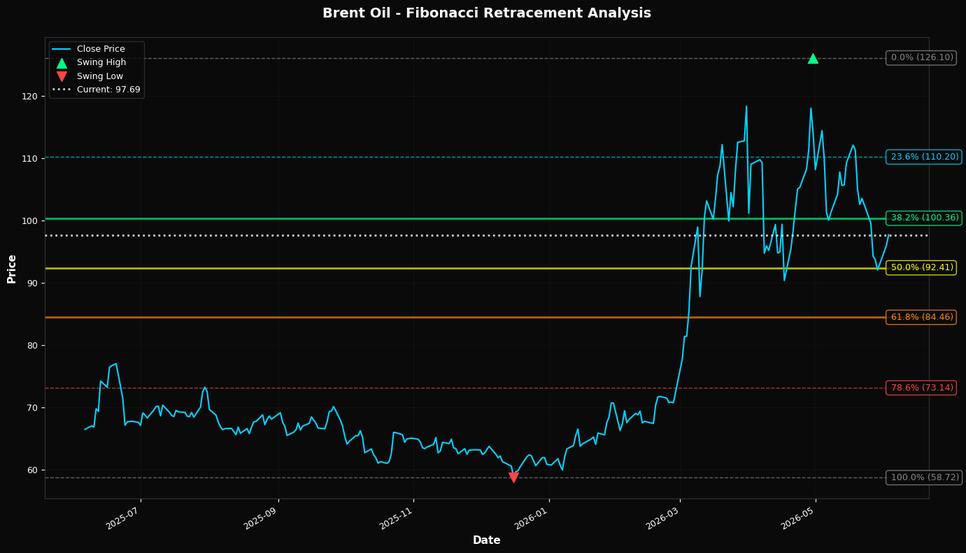
🎯 Key Trading Levels
Key Fibonacci Levels:
- 38.2%: $100.36
- 50.0%: $92.41
- 61.8%: $84.46
Support: $58.72 (Swing Low), $103.61 (50-Day MA)
Resistance: $126.10 (Swing High)
Disclaimer
The content on MarketsFN.com is provided for educational and informational purposes only. It does not constitute financial advice, investment recommendations, or trading guidance. All investments involve risks, and past performance does not guarantee future results. You are solely responsible for your investment decisions and should conduct independent research and consult a qualified financial advisor before acting. MarketsFN.com and its authors are not liable for any losses or damages arising from your use of this information.