Cocoa Sells Off 2.7% amid oversold conditions
· Commodities · MarketsFN Team
Cocoa Sells Off 2.7% amid oversold conditions
Analysis Date: February 27, 2026
📊 Current Market Data
CURRENT PRICE
$2895.00
DAILY CHANGE
-2.66%
WEEKLY CHANGE
-6.01%
52W HIGH
$11280.00
52W LOW
$2883.00
💡 Key Market Factors
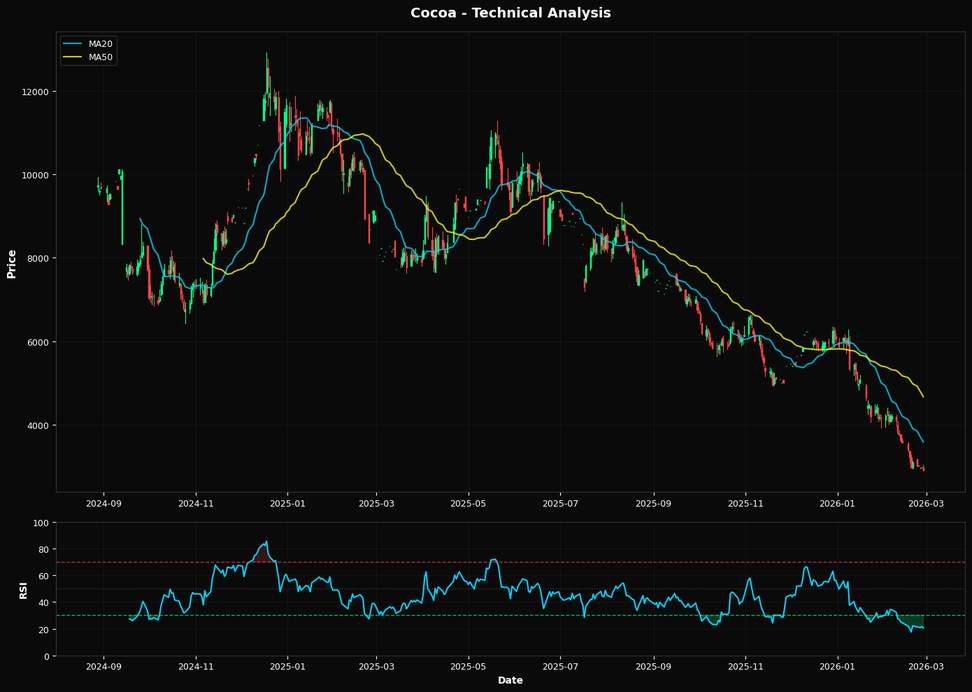
Cocoa prices have experienced a significant decline, with a daily drop of 2.66% and a weekly decrease of 6.01%, reflecting broader market pressures. The current RSI of 20.5 indicates that the market is in oversold territory, suggesting a potential for a technical rebound. However, the price remains well below the 20-day and 50-day moving averages, highlighting persistent bearish momentum. Inflationary pressures have been relatively subdued in their direct impact on cocoa, as recent global inflation trends have shown signs of stabilization. However, the broader macroeconomic environment, influenced by inflation expectations, continues to weigh on consumer spending patterns, indirectly affecting demand for discretionary commodities like cocoa. Interest rate policies, particularly from the Federal Reserve, have not had a direct impact on cocoa prices recently. However, elevated interest rates continue to strengthen the U.S. dollar, which can exert downward pressure on commodity prices denominated in dollars, including cocoa. Technically, cocoa is far from its Fibonacci retracement level of 38.2% at $6090.65, indicating a significant gap from previous highs. The breach below key moving averages suggests that any recovery may face resistance, with immediate support potentially forming around psychological levels or historical price points. The oversold RSI could trigger short-term buying interest, but sustained recovery will require a shift in broader market sentiment.📈 Technical Indicators Summary
RSI (14)
20.5
50-Day MA
$4666.70
200-Day MA
$6872.36
Fib Level
38.2%
📊 Technical Analysis Chart (18-Month View)
📐 Fibonacci Retracement Analysis
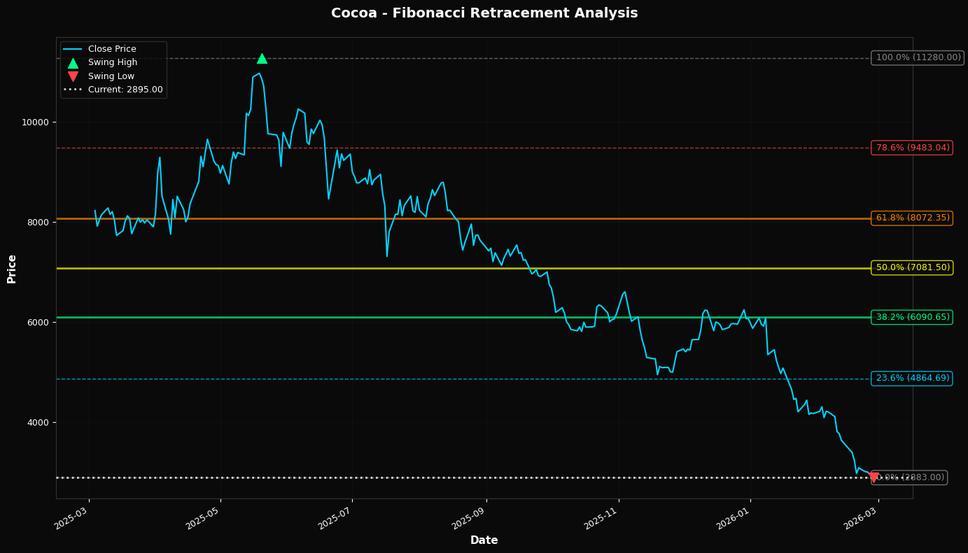
🎯 Key Trading Levels
Key Fibonacci Levels:
- 38.2% Level: $6090.65
- 50.0% Level: $7081.50
- 61.8% Level: $8072.35
Support: $2883.00 (Swing Low), $4666.70 (50-day MA)
Resistance: $11280.00 (Swing High)
Disclaimer
The content on MarketsFN.com is provided for educational and informational purposes only. It does not constitute financial advice, investment recommendations, or trading guidance. All investments involve risks, and past performance does not guarantee future results. You are solely responsible for your investment decisions and should conduct independent research and consult a qualified financial advisor before acting. MarketsFN.com and its authors are not liable for any losses or damages arising from your use of this information.