Cocoa: Up 6.7% to $4142.00 — Above MA50 ($3742.86) — Constructive
· Commodities · QuoteReporter
Cocoa: Up 6.7% to $4142.00 — Above MA50 ($3742.86) — Constructive
Analysis Date: June 17, 2026
📊 Current Market Data
CURRENT PRICE
$4142.00
DAILY CHANGE
+6.70%
WEEKLY CHANGE
+8.12%
52W HIGH
$10288.00
52W LOW
$2798.00
💡 Key Market Factors
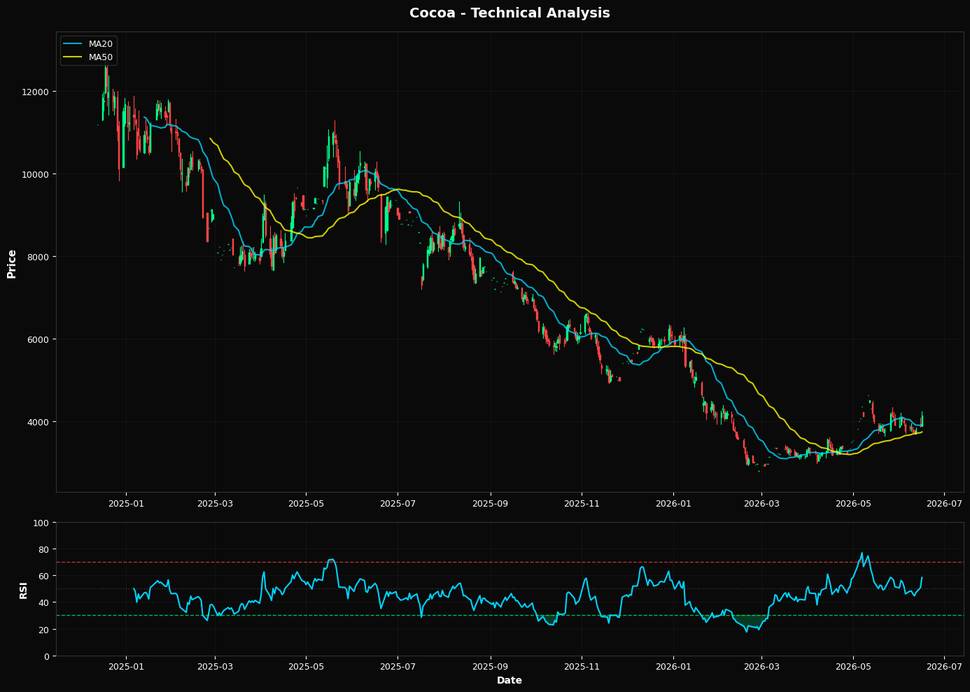
Cocoa prices are surging, with a daily increase of 6.70% to $4142.00, signaling a potential breakout moment driven by macroeconomic factors and technical indicators. The most pressing macro driver for cocoa right now is the strength of the U.S. dollar. As the Federal Reserve maintains a hawkish stance, the dollar's strength typically pressures commodity prices. However, cocoa's recent price action suggests that the market may be underpricing the impact of supply constraints or geopolitical tensions affecting cocoa-producing regions, which could be offsetting the usual dollar dynamics. This divergence indicates that cocoa's rally might have more room to run if these supply-side issues persist or escalate. From a technical perspective, cocoa's current price of $4142.00 is well above its 20-day moving average of $3921.20 and the 50-day moving average of $3742.86, suggesting strong upward momentum. The Relative Strength Index (RSI) at 58.4 indicates that the commodity is not yet overbought, leaving room for further gains. However, the price remains below the 200-day moving average of $4845.32, which could act as a long-term resistance level. The nearest Fibonacci resistance at 38.2% is at $5360.07, providing a potential target for bulls. Given these technical signals, the directional bias for cocoa remains bullish in the short to medium term, especially if it can break through these resistance levels. A key risk that could alter this bullish outlook is any significant change in global supply dynamics, such as a resolution to geopolitical tensions in major cocoa-producing regions or unexpected changes in weather patterns affecting crop yields. Conversely, a catalyst that could further support the current rally would be a continued weakening of the U.S. dollar or a dovish shift in Fed policy, which would enhance the appeal of commodities priced in dollars. Looking ahead, the next major data point to watch is the upcoming U.S. inflation report. A lower-than-expected inflation figure could lead to a softer dollar, providing additional tailwinds for cocoa prices. Conversely, a higher inflation reading might reinforce the Fed's hawkish stance, potentially capping cocoa's upside. Monitoring these developments will be crucial for confirming or challenging the current bullish narrative in the cocoa market.📈 Technical Indicators Summary
RSI (14)
58.4
50-Day MA
$3742.86
200-Day MA
$4845.32
Fib Level
38.2%
📊 Technical Analysis Chart (18-Month View)
📐 Fibonacci Retracement Analysis
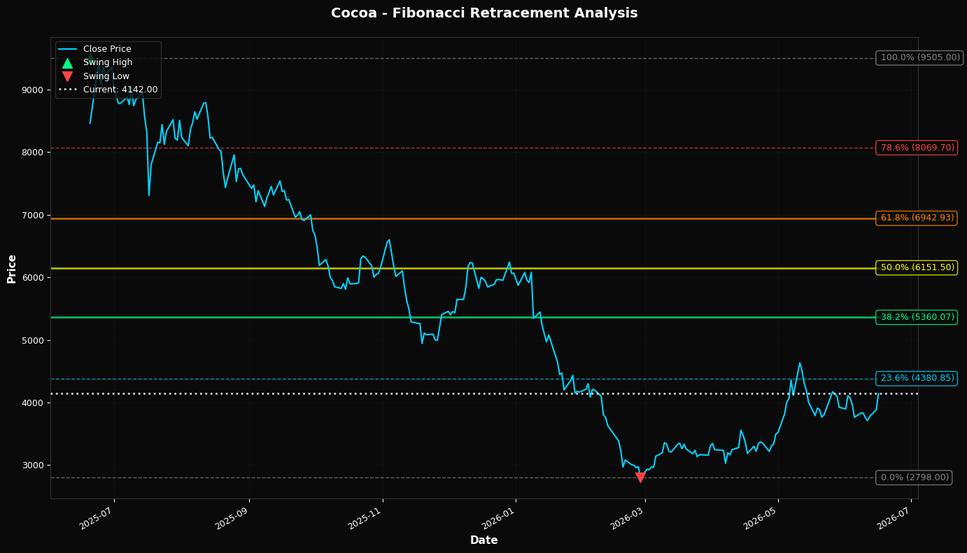
🎯 Key Trading Levels
Key Fibonacci Levels:
- 38.2%: $5360.07
- 50.0%: $6151.50
- 61.8%: $6942.93
Support: $2798.00 (Swing Low), $3742.86 (50-Day MA)
Resistance: $9505.00 (Swing High)
Disclaimer
The content on MarketsFN.com is provided for educational and informational purposes only. It does not constitute financial advice, investment recommendations, or trading guidance. All investments involve risks, and past performance does not guarantee future results. You are solely responsible for your investment decisions and should conduct independent research and consult a qualified financial advisor before acting. MarketsFN.com and its authors are not liable for any losses or damages arising from your use of this information.