Copper: Down 0.2% to $6.36 — Bullish Structure — Above MA50 & MA200
· Commodities · QuoteReporter
Copper: Down 0.2% to $6.36 — Bullish Structure — Above MA50 & MA200
Analysis Date: June 19, 2026
📊 Current Market Data
CURRENT PRICE
$6.36
DAILY CHANGE
-0.24%
WEEKLY CHANGE
-1.11%
52W HIGH
$6.65
52W LOW
$4.32
💡 Key Market Factors
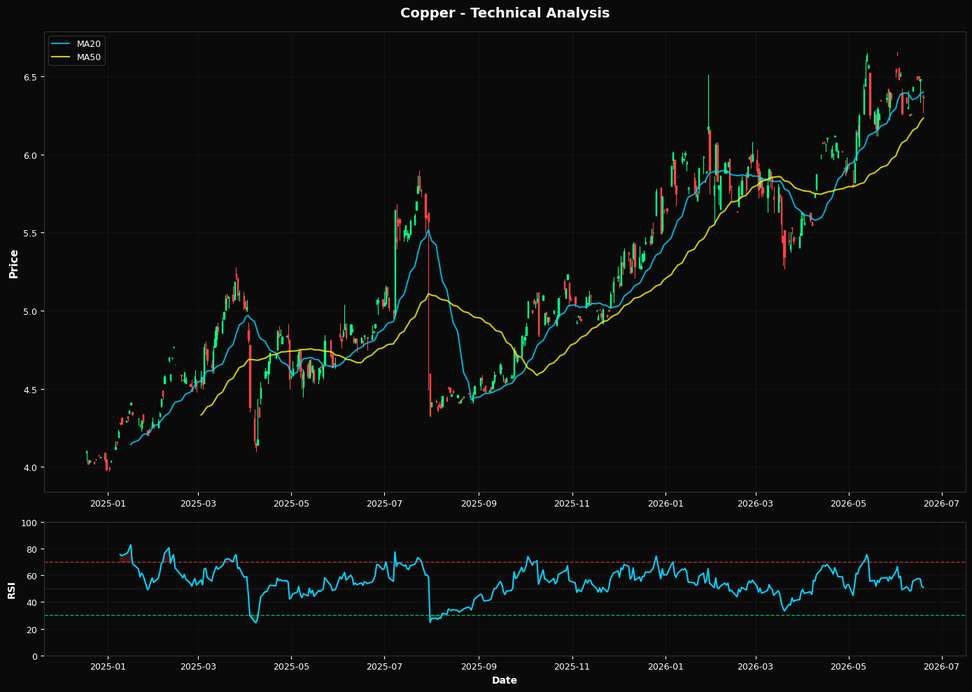
Copper's current price action suggests a cautious outlook, with macroeconomic factors, particularly the strength of the U.S. dollar, exerting significant pressure. The commodity is trading at $6.36, down 0.24% daily and 1.11% weekly. This decline is largely driven by a robust dollar, which typically inversely affects commodity prices. As the Federal Reserve maintains a hawkish stance on interest rates to combat inflation, the dollar remains strong, making dollar-denominated commodities like copper more expensive for foreign buyers. This dynamic is crucial as it directly impacts global demand for copper, a key industrial metal. From a technical perspective, copper's Relative Strength Index (RSI) stands at 51.0, indicating a neutral momentum. However, the price is slightly below its 20-day moving average of $6.40, suggesting short-term bearishness. The 50-day moving average at $6.23 provides a closer support level, while the 200-day moving average at $5.58 indicates a longer-term bullish trend. The nearest Fibonacci support at 38.2% is at $5.76, which could act as a critical support level if the price continues to decline. The technical setup suggests a cautious bias, with potential for further downside if the price breaks below the 50-day moving average. A key risk that could alter copper's trajectory is any unexpected shift in the Federal Reserve's monetary policy. Should the Fed signal a pause or reversal in rate hikes, it could weaken the dollar, providing relief to copper prices. Conversely, stronger-than-expected U.S. economic data could reinforce the Fed's hawkish stance, further strengthening the dollar and pressuring copper prices. The market may be underpricing the potential for a rapid shift in Fed policy, which could lead to significant volatility in copper prices. Looking ahead, the upcoming U.S. inflation data release will be pivotal. If inflation shows signs of cooling, it could prompt the Fed to reconsider its rate hike trajectory, potentially weakening the dollar and providing a boost to copper prices. Conversely, persistent inflationary pressures could reinforce the current bearish outlook. This data point will be critical in confirming or invalidating the current cautious stance on copper.📈 Technical Indicators Summary
RSI (14)
51.0
50-Day MA
$6.23
200-Day MA
$5.58
Fib Level
38.2%
📊 Technical Analysis Chart (18-Month View)
📐 Fibonacci Retracement Analysis
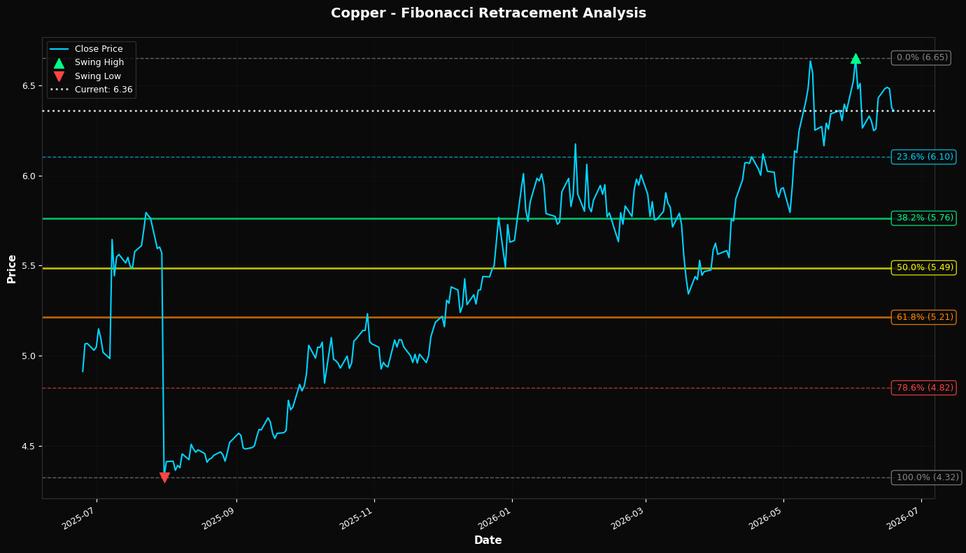
🎯 Key Trading Levels
Key Fibonacci Levels:
- 38.2%: $5.76
- 50.0%: $5.49
- 61.8%: $5.21
Support: $4.32 (Swing Low), $6.23 (50-Day MA)
Resistance: $6.65 (Swing High)
Disclaimer
The content on MarketsFN.com is provided for educational and informational purposes only. It does not constitute financial advice, investment recommendations, or trading guidance. All investments involve risks, and past performance does not guarantee future results. You are solely responsible for your investment decisions and should conduct independent research and consult a qualified financial advisor before acting. MarketsFN.com and its authors are not liable for any losses or damages arising from your use of this information.