Copper: Down 0.3% to $6.35 — Bullish Structure — Above MA50 & MA200
· Commodities · QuoteReporter
Copper: Down 0.3% to $6.35 — Bullish Structure — Above MA50 & MA200
Analysis Date: June 22, 2026
📊 Current Market Data
CURRENT PRICE
$6.35
DAILY CHANGE
-0.33%
WEEKLY CHANGE
-1.20%
52W HIGH
$6.65
52W LOW
$4.32
💡 Key Market Factors
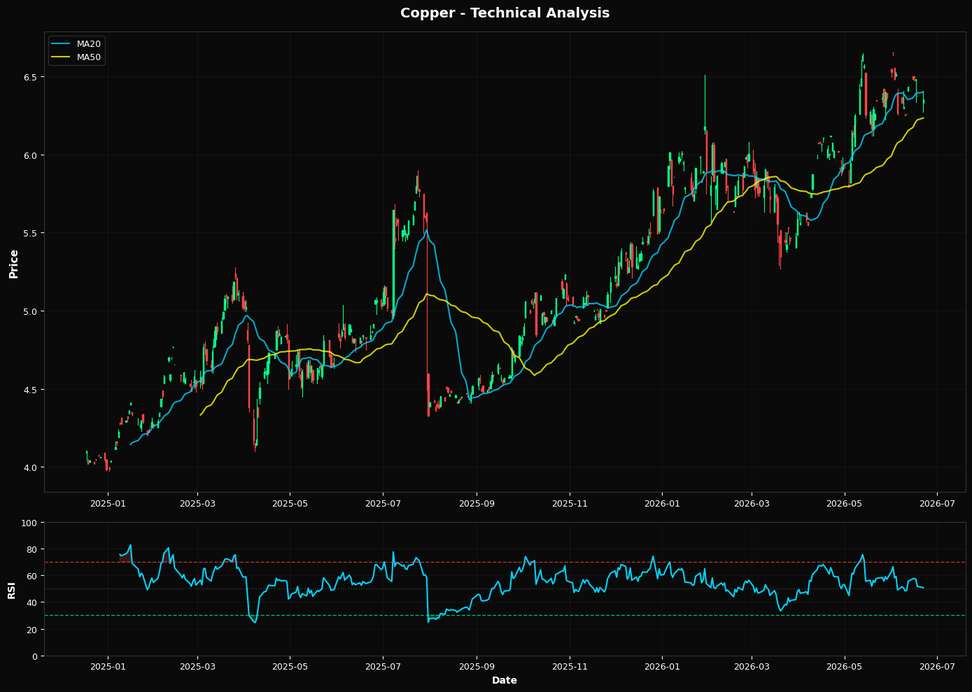
Copper's current price action suggests a cautious stance is warranted, with the most pressing macro driver being the strength of the U.S. dollar. As copper is priced in dollars, a stronger USD typically exerts downward pressure on its price. Given the Federal Reserve's recent hawkish tone, signaling potential for further rate hikes, the dollar has been buoyed, which could continue to weigh on copper prices. This dynamic is crucial as it directly impacts the purchasing power of non-U.S. buyers, potentially dampening demand for copper. From a technical perspective, copper's RSI of 50.7 indicates a neutral momentum, suggesting neither overbought nor oversold conditions. However, the price is currently below the 20-day moving average of $6.40, which could act as immediate resistance. The 50-day moving average at $6.23 provides a closer support level, while the 200-day moving average at $5.58 suggests a longer-term bullish trend remains intact. The nearest Fibonacci support at $5.76 further reinforces this support zone. Given these technical indicators, the bias leans slightly bearish in the short term, with potential for a pullback towards the $6.23 level if the dollar continues to strengthen. A key risk that could alter this outlook is a significant shift in Chinese demand. As the world's largest consumer of copper, any unexpected increase in Chinese industrial activity or government stimulus aimed at infrastructure could drive a rapid reversal in copper prices. This would counteract the dollar's impact and potentially push prices back towards the recent swing high of $6.65. Looking ahead, the upcoming U.S. inflation data release will be pivotal. A higher-than-expected inflation print could reinforce the Fed's hawkish stance, further strengthening the dollar and pressuring copper prices. Conversely, a softer inflation reading might alleviate some of the dollar's strength, providing relief to copper prices. This data point will be crucial in confirming or invalidating the current bearish bias, making it a must-watch for market participants.📈 Technical Indicators Summary
RSI (14)
50.7
50-Day MA
$6.23
200-Day MA
$5.58
Fib Level
38.2%
📊 Technical Analysis Chart (18-Month View)
📐 Fibonacci Retracement Analysis
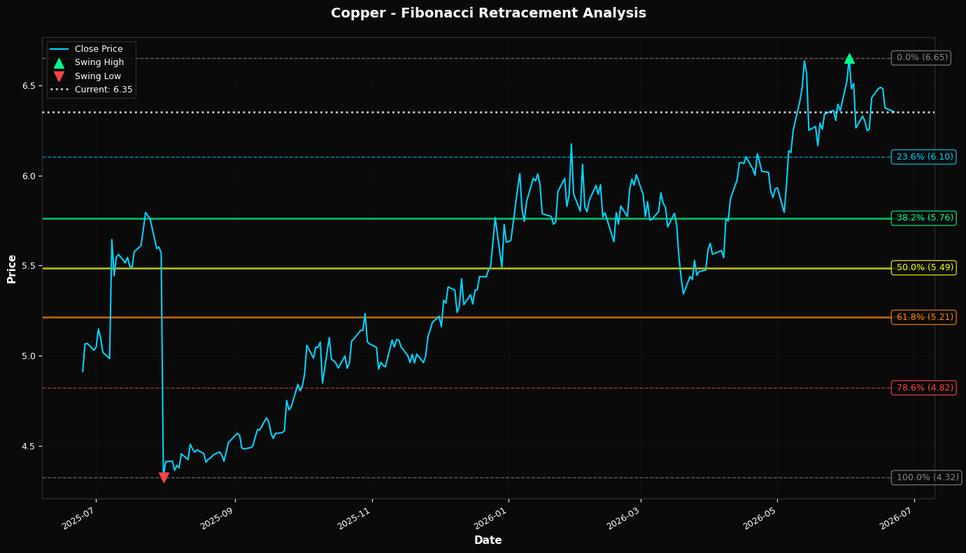
🎯 Key Trading Levels
Key Fibonacci Levels:
- 38.2%: $5.76
- 50.0%: $5.49
- 61.8%: $5.21
Support: $4.32 (Swing Low), $6.23 (50-Day MA)
Resistance: $6.65 (Swing High)
Disclaimer
The content on MarketsFN.com is provided for educational and informational purposes only. It does not constitute financial advice, investment recommendations, or trading guidance. All investments involve risks, and past performance does not guarantee future results. You are solely responsible for your investment decisions and should conduct independent research and consult a qualified financial advisor before acting. MarketsFN.com and its authors are not liable for any losses or damages arising from your use of this information.