Copper: Down 1.5% to $6.41 — Bullish Structure — Above MA50 & MA200
· Commodities · QuoteReporter
Copper: Down 1.5% to $6.41 — Bullish Structure — Above MA50 & MA200
Analysis Date: June 05, 2026
📊 Current Market Data
CURRENT PRICE
$6.41
DAILY CHANGE
-1.54%
WEEKLY CHANGE
+0.81%
52W HIGH
$6.65
52W LOW
$4.32
💡 Key Market Factors
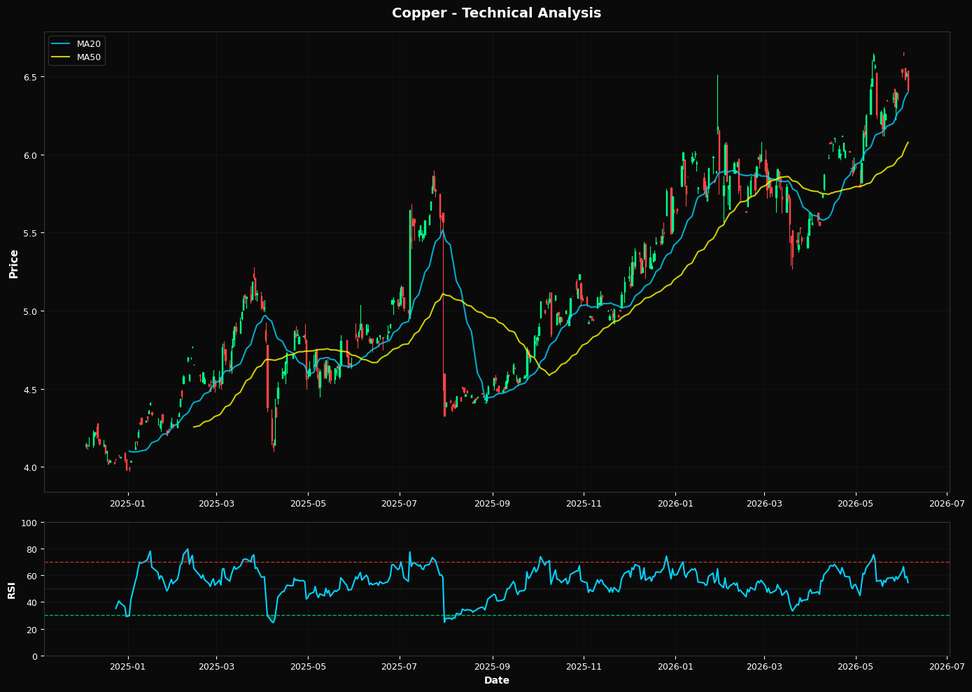
Copper's current price action suggests a cautious bullish outlook, driven by its technical positioning above key moving averages. Despite a daily decline of 1.54%, copper's price at $6.41 remains above its 20-day moving average of $6.40 and significantly above the 50-day and 200-day moving averages of $6.08 and $5.49, respectively. This alignment indicates a bullish trend, supported by an RSI of 54.6, which suggests neither overbought nor oversold conditions. The market appears to be underpricing the potential for further upside, especially given copper's proximity to its 52-week high of $6.65. The nearest Fibonacci support at $5.76 provides a solid foundation, suggesting limited downside risk in the short term. The most critical macro driver for copper right now is the U.S. dollar's strength, influenced by Federal Reserve policy. A stronger dollar typically pressures commodity prices, but copper's resilience above key technical levels indicates that the market may be underestimating the Fed's potential dovish pivot. If the Fed signals a pause or slowdown in rate hikes, this could weaken the dollar, providing a tailwind for copper prices. Inflationary pressures also play a role, as persistent inflation could drive demand for copper in infrastructure and green energy projects, further supporting prices. A key risk to this outlook is the upcoming U.S. inflation data. A higher-than-expected inflation print could prompt the Fed to maintain or even accelerate its rate hikes, strengthening the dollar and potentially pressuring copper prices. Conversely, a lower inflation figure could validate the current bullish technical setup by weakening the dollar and boosting copper demand. The market may be underpricing the impact of a dovish Fed shift, which could catalyze a breakout above the recent swing high of $6.65. Looking ahead, the next Federal Reserve meeting will be crucial. Any indication of a policy shift could confirm or invalidate the current bullish bias. A dovish stance would likely weaken the dollar, supporting copper prices and potentially driving them towards new highs. Conversely, a hawkish surprise could strengthen the dollar and challenge copper's technical support levels, necessitating a reassessment of the bullish outlook.📈 Technical Indicators Summary
RSI (14)
54.6
50-Day MA
$6.08
200-Day MA
$5.49
Fib Level
38.2%
📊 Technical Analysis Chart (18-Month View)
📐 Fibonacci Retracement Analysis
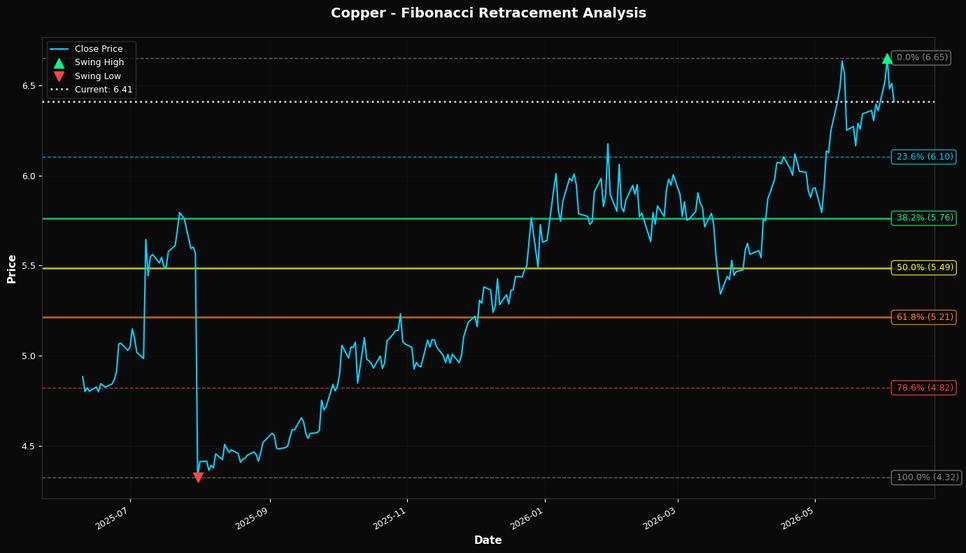
🎯 Key Trading Levels
Key Fibonacci Levels:
- 38.2%: $5.76
- 50.0%: $5.49
- 61.8%: $5.21
Support: $4.32 (Swing Low), $6.08 (50-Day MA)
Resistance: $6.65 (Swing High)
Disclaimer
The content on MarketsFN.com is provided for educational and informational purposes only. It does not constitute financial advice, investment recommendations, or trading guidance. All investments involve risks, and past performance does not guarantee future results. You are solely responsible for your investment decisions and should conduct independent research and consult a qualified financial advisor before acting. MarketsFN.com and its authors are not liable for any losses or damages arising from your use of this information.