Copper: Down 2.4% to $6.00 — Below MA50 ($6.24) — Caution
· Commodities · QuoteReporter
Copper: Down 2.4% to $6.00 — Below MA50 ($6.24) — Caution
Analysis Date: June 24, 2026
📊 Current Market Data
CURRENT PRICE
$6.00
DAILY CHANGE
-2.35%
WEEKLY CHANGE
-7.59%
52W HIGH
$6.65
52W LOW
$4.32
💡 Key Market Factors
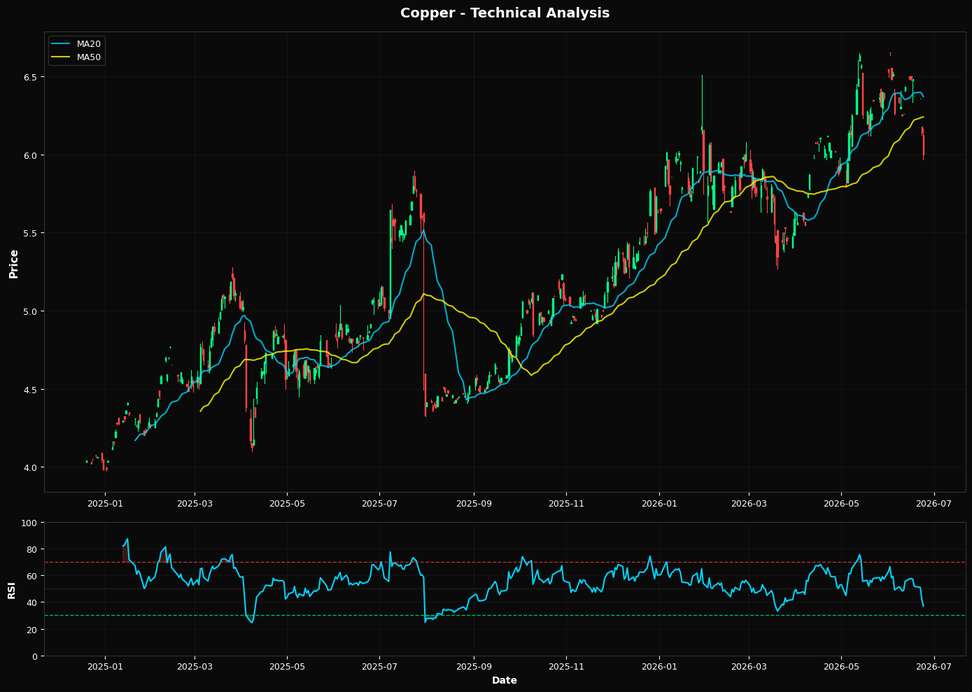
Copper's recent price action suggests a bearish outlook, driven primarily by the strengthening U.S. dollar. As the Federal Reserve maintains a hawkish stance on interest rates, the dollar has appreciated, exerting downward pressure on dollar-denominated commodities like copper. This macroeconomic factor is the most significant driver for copper today, as a stronger dollar makes copper more expensive for foreign buyers, reducing demand. The current price of copper at $6.00, down 2.35% daily and 7.59% weekly, reflects this dynamic. The market may be underestimating the persistence of dollar strength, which could continue to weigh on copper prices. From a technical perspective, copper's Relative Strength Index (RSI) at 37.0 indicates that it is approaching oversold territory, suggesting potential for a short-term bounce. However, the price is below both the 20-day moving average of $6.37 and the 50-day moving average of $6.24, reinforcing a bearish trend. The 200-day moving average at $5.60 serves as a longer-term support level. Additionally, the nearest Fibonacci support at the 38.2% retracement level of $5.76 could provide a temporary floor. Despite these technical supports, the overall setup suggests a continuation of the downward trend unless a significant catalyst emerges. A key risk that could alter the current bearish outlook is a shift in Federal Reserve policy. If upcoming economic data, such as the Consumer Price Index (CPI), indicates a slowdown in inflation, the Fed might signal a pause or reduction in rate hikes. This would likely weaken the dollar, providing relief to copper prices. The market may not be fully pricing in the potential for a dovish pivot by the Fed, which could lead to a rapid reversal in copper's fortunes. Looking ahead, the next CPI release will be crucial in confirming or invalidating this view. A lower-than-expected inflation reading could prompt a reassessment of the Fed's policy trajectory, potentially weakening the dollar and providing a tailwind for copper prices. Conversely, persistently high inflation would reinforce the current bearish trend, as it would likely lead to continued dollar strength and further pressure on copper.📈 Technical Indicators Summary
RSI (14)
37.0
50-Day MA
$6.24
200-Day MA
$5.60
Fib Level
38.2%
📊 Technical Analysis Chart (18-Month View)
📐 Fibonacci Retracement Analysis
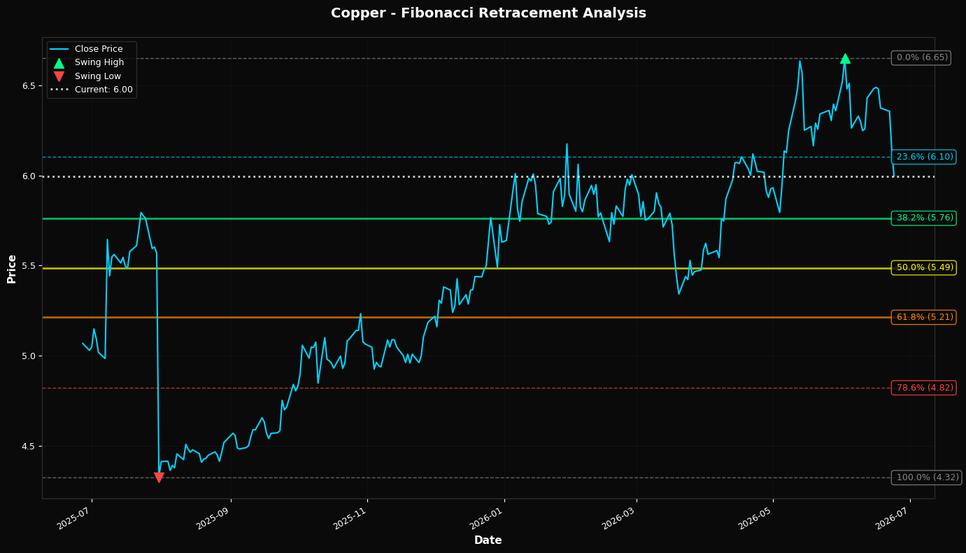
🎯 Key Trading Levels
Key Fibonacci Levels:
- 38.2%: $5.76
- 50.0%: $5.49
- 61.8%: $5.21
Support: $4.32 (Swing Low), $6.24 (50-Day MA)
Resistance: $6.65 (Swing High)
Disclaimer
The content on MarketsFN.com is provided for educational and informational purposes only. It does not constitute financial advice, investment recommendations, or trading guidance. All investments involve risks, and past performance does not guarantee future results. You are solely responsible for your investment decisions and should conduct independent research and consult a qualified financial advisor before acting. MarketsFN.com and its authors are not liable for any losses or damages arising from your use of this information.