Copper Retraces 1.0%
· Commodities · QuoteReporter
Copper Retraces 1.0%
Analysis Date: May 19, 2026
📊 Current Market Data
CURRENT PRICE
$6.21
DAILY CHANGE
-1.03%
WEEKLY CHANGE
-4.28%
52W HIGH
$6.64
52W LOW
$4.32
💡 Key Market Factors
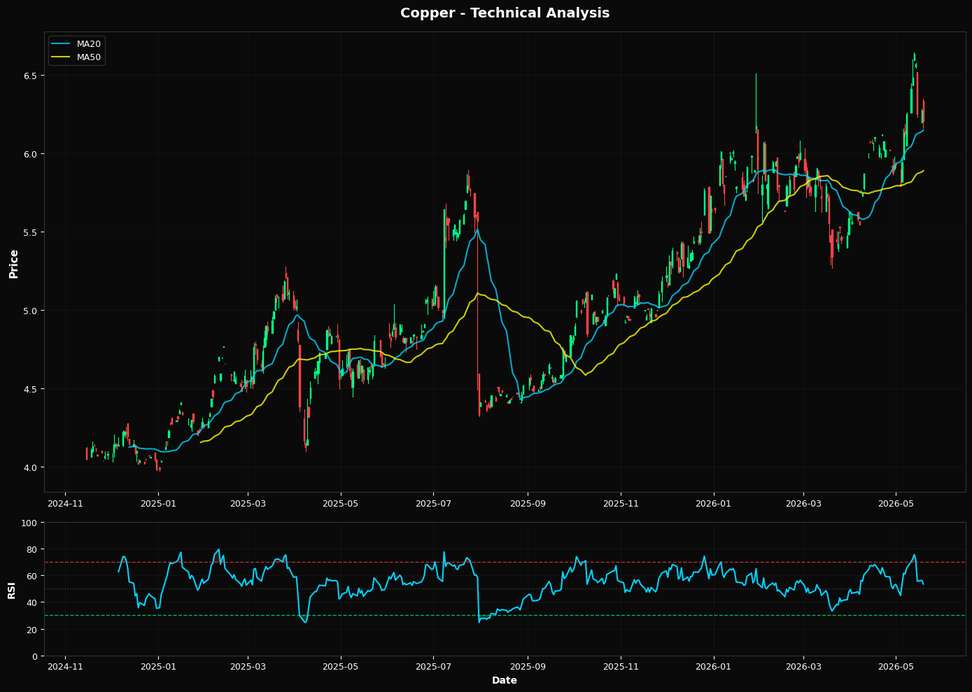
Copper prices have recently experienced a decline, with a daily drop of 1.03% and a weekly decrease of 4.28%, positioning the current price at $6.21. This movement can be partly attributed to ongoing concerns about inflation and its impact on global economic growth. As inflationary pressures persist, central banks, particularly the Federal Reserve, are maintaining a hawkish stance on monetary policy. The Fed's commitment to higher interest rates to combat inflation could dampen industrial demand for copper, given its extensive use in construction and manufacturing. From a technical perspective, copper's Relative Strength Index (RSI) is at 53.5, indicating a neutral stance without signaling overbought or oversold conditions. The price is currently above the 20-day moving average (MA20) of $6.15 but significantly higher than the 50-day moving average (MA50) of $5.89, suggesting a short-term bullish trend despite recent declines. However, the proximity of the nearest Fibonacci retracement level at 38.2% ($5.76) suggests potential support if the price continues to fall, providing a critical level for traders to watch. Geopolitical factors, while not currently at the forefront, remain a potential risk for copper markets. Any significant escalation in geopolitical tensions, particularly involving major copper-producing regions or trade routes, could disrupt supply chains and impact prices. However, absent such developments, the market's focus remains predominantly on macroeconomic indicators and central bank policies, which are currently exerting downward pressure on copper prices.📈 Technical Indicators Summary
RSI (14)
53.5
50-Day MA
$5.89
200-Day MA
$5.37
Fib Level
38.2%
📊 Technical Analysis Chart (18-Month View)
📐 Fibonacci Retracement Analysis
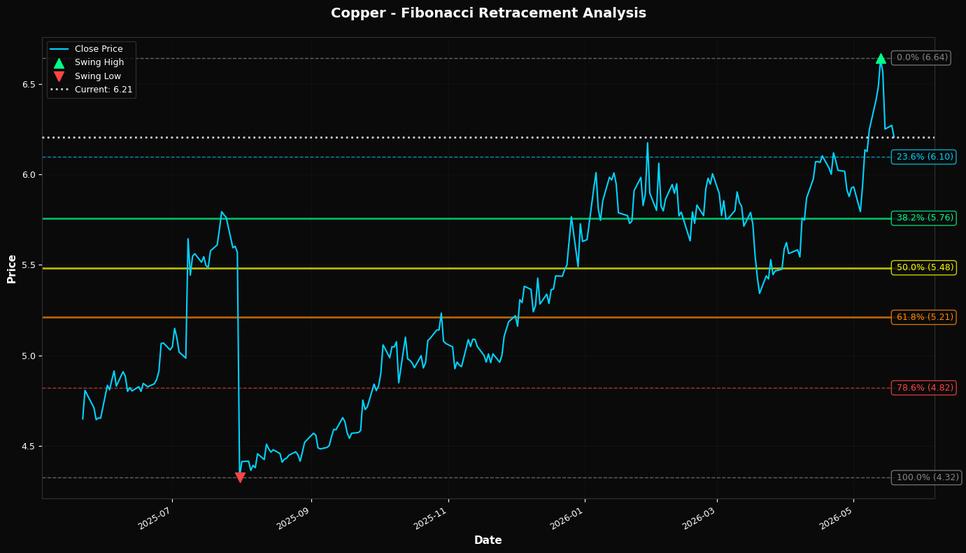
🎯 Key Trading Levels
Key Fibonacci Levels:
- 38.2%: $5.76
- 50.0%: $5.48
- 61.8%: $5.21
Support: $4.32 (Swing Low), $5.89 (50-Day MA)
Resistance: $6.64 (Swing High)
Disclaimer
The content on MarketsFN.com is provided for educational and informational purposes only. It does not constitute financial advice, investment recommendations, or trading guidance. All investments involve risks, and past performance does not guarantee future results. You are solely responsible for your investment decisions and should conduct independent research and consult a qualified financial advisor before acting. MarketsFN.com and its authors are not liable for any losses or damages arising from your use of this information.